
The dual-pol upgrade brings several new radar products to the existing suite of products provided by our WSR-88Ds. In addition to three new base products, there are also several new products which are derived from the new dual-pol products and existing radar products. Many of the derived products are related to precipitation accumulation. Scroll down the page or choose one of the options below for more information about each individual product. See the applications page for information on how these products may be used together to reveal a particular weather feature.
Base Products
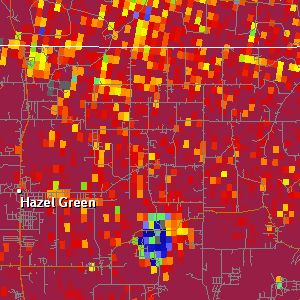
Correlation Coefficient (CC)
| Resolution: 1° x 0.25 km, 256 data levels Possible Values: 0.2 to 1.05 / Units: (none) Available at all elevation angles Definition: Correlation coefficient (also referred to as ρhv or rho) provides a measure of the consistency of the shapes and sizes of targets within the radar beam. A higher value shows a higher consistency in the size and shape of radar targets, while a lower value indicates greater variability in shapes and sizes. Uses: CC can be used to help distinguish between meterological and non-meteorologial targets, find the melting layer, identify giant hail, identify tornadic debris, and check the quality of other dual-pol products. |
 |
Differential Reflectivity (ZDR)
| Resolution: 1° x 0.25 km, 256 data levels Possible Values: -7.9 to 7.9 / Units: dB Available at all elevation angles Definition: Differential Reflectivity is the logarithm ratio of the horizontally polarized reflectivity to the vertically polarized reflectivity. Positive values of ZDR indicate that dominant hydrometeors are larger in the horizontal than in the vertical. Negative values indicate dominant hydrometeors are larger in the vertical than the horizontal. Values near zero indicate that hydrometeors are similar in size in the vertical and horizonatal. Uses: ZDR can be used to help identify hail shafts, detect updrafts, determine rain drop size, and identify aggregation of dry snow. |
 |
Differential Phase Shift (ΦDP)
| Resolution: 1° x 0.25 km, 256 data levels Possible Values: 0 to 360 / Units: deg Available at all elevation angles Definition: Differential Phase Shift (ΦDP or PHI) is a measure of the difference in 2-way attenuation for the horizontal and vertical pulses in a pulse volume. As vertical and horizontal radar pulses pass through a particular target, the two pulses attenuate, or slow down, causing each pulse's phase to change. ΦDP shows the difference in phase shift between the horizontal pulse and the vertical pulse. This provides information about the shape and concentration of radar targets. However, ΦDP values are cumulative along a particular radar radial, which makes it more difficult to interpret. See Specific Differential Phase (KDP) for an easier way to view this data. |
 |
Derived Products
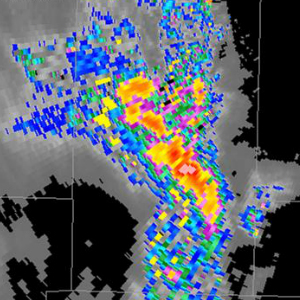
Specific Differential Phase (KDP)
| Resolution: 1° x 0.25 km, 256 data levels Possible Values: -2 to 10 / Units: deg/km Available at all elevation angles Definition: Specific Differential Phase is a derived product that shows the gradient, or change, in Differential Phase Shift (ΦDP). Positive KDP values indicate greater phase shift in the horizontal than the vertical. Uses: Increasing KDP is an indication of an increase in the size and concentration of rain drops, and thus, an increase in rain rate. This means that KDP is useful for pinpointing areas where the heaviest rainfall is occurring. Compare the sample KDP image at right to the sample ΦDP image above from the same time to see how it is much easier to pick out areas of interest. |
 |
Hydrometeor Classification (HC)
| Resolution: 1° x 0.25 km, 13 data levels used Possible Values: BI,GC,IC,DS,WS,RA,HR,BD,GR,HA,UK, RF Available at all elevation angles Definition: The HC product attempts to provide a representation of radar echo types (out of 10 possible echoes - biological, clutter, ice crystals, dry snow, west snow, rain, heavy rain, big drops, graupel, and hail) in each radar range bin. It uses information from the base reflectivity, ZDR, CC, KDP, base velocity, and ΦDP products to make each determination. Uses: HC can provide a first-guess for precipitation type, and it can help point out non-precipitation echoes. |
 |
Hybrid Hydrometeor Classification (HHC)
| Resolution: 1° x 0.25 km, 12 data levels used Possible Values: BI,GC,IC,DS,WS,RA,HR,BD,GR,HA,UK, RF One product per volume scan Definition: The HHC product uses output from the Hydrometeor Classification products at each elevation angle to make a cumulative "best guess" of echo type. Uses: The HHC was created specifically to be used as the input for the dual-pol quantitative precipitation estimation (QPE) algorithm. Thus it serves an important role in improving precipitation estimates. |
 |
| Can be overlayed at each elevation angle Description: The melting layer (ML) is represented by four concentric rings drawn around the radar. The inner ring represents the point where the top edge of the radar beam enters the ML, the next ring where the beam centerpoint enters the ML, the next ring where the beam centerpoint exits the ML, and the outermost ring where the bottom edge of the beam exits the ML. The dual-pol melting layer algorithm uses the reflectivity, ZDR, and CC products to make its height estimations, and thus is impacted by the availability of sufficient radar echoes. Uses: This product can supplement observed ROAB data and model data in helping determine the approximate freezing/melting height and the approximate web bult 0° height. |
 |
Derived Precipitation Products
Digital Precipitation Rate (DPR)
| Resolution: 1° x 0.25 km, 65,536 data levels Possible Values: 0+ / Units: inches/hour One product per volume scan Definition: The Digital Precipitation Rate is a product that displays instantaneous precipitation rate information in 0.001 inch/hour increments. This product uses HHC as an input. Uses: The most obvious use for this product is to pick out areas where the heaviest rain is occurring at the current time. |
 |
Digital Accumulation Array (DAA)
| Resolution: 1° x 0.25 km, 256 data levels Possible Values: 0+ / Units: inches One product per volume scan Definition: The Digital Accumulation Array product provides a dual-pol estimate of how much rain has fallen over the past hour, updated each radar volume scan. A bias is never applied to this product to attempt to improve it. This product is comparable to the OHA, which does provide bias correction. Uses: This product is intended to provide useful precipitation accumulation information and to help forecasters monitor for potential flash flooding. Because no bias is applied, it provides an idea of the raw dual-pol precipitation estimates. |
 |
| Resolution: 1° x 2 km, 16 data levels Possible Values: 0+ / Units: inches One product per volume scan Definition: The One Hour Accumulation product provides a dual-pol estimate of how much rain has fallen over the past hour, updated each radar volume scan. A bias can be applied to this product to attempt to improve output. It is comparable to the DAA, which does not provide bias correction. It is analogous to the pre-dual pol product OHP. Uses: This product is intended to provide useful precipitation accumulation information and to help forecasters monitor for potential flash flooding. |
 |
Digital Storm Total Accumulation (DSA)
| Resolution: 1° x 0.25 km, 256 data levels Possible Values: 0+ / Units: inches One product per volume scan Definition: The Digital Storm Total Accumulation product provides a dual-pol estimate of how much rain has fallen since the beginning of a precipitation event, updated each radar volume scan. A bias can be applied to this product to attempt to improve output. This product is comparable to the STA, which is a lower-resolution product. Uses: This product is intended to provide useful precipitation accumulation information and to help forecasters monitor for potential flash flooding. |
 |
Storm Total Accumulation (STA)
| Resolution: 1° x 2 km, 16 data levels Possible Values: 0+ / Units: inches One product per volume scan Definition: The Storm Total Accumulation product provides a dual-pol estimate of how much rain has fallen over the past hour, updated each radar volume scan. A bias can be applied to this product to attempt to improve output. It is comparable to the DSA product, but STA is a lower-resolution product, which makes it analogous to the pre-dual pol product STP. Uses: This product is intended to provide useful precipitation accumulation information and to help forecasters monitor for potential flash flooding. |
 |
Digital User-Selectable Accumulation (DUA)
| Resolution: 1° x 0.25 km, 256 data levels Possible Values: 0+ / Units: inches Possible durations range from 15 minutes to 24 hours Definition: The Digital User-Selectable Accumulation product provides a dual-pol estimate of how much rain has fallen over a time period selected by the local National Weather Service office. A bias can be applied to this product to attempt to improve output. Uses: This product is intended to provide useful precipitation accumulation information and to help forecasters monitor for potential flash flooding. |
 |
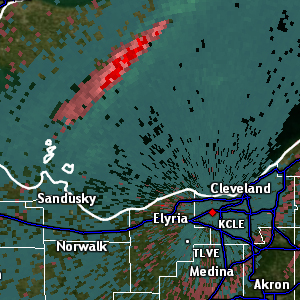
Digital One-hour Difference (DOD)
| Resolution: 1° x 0.25 km, 256 data levels Units: inches One product per volume scan Definition: The Digital One-hour Difference product shows the difference between the dual-pol DAA one-hour precipitation accumulation product and the legacy OHP precipitation accumulation product. Bias cannot be applied to this product. Uses: This product is intended to highlight the differences between dual-pol precipitation estimation products and legacy precipitation estimation products. |
 |
Digital Storm-total Difference (DSD)
| Resolution: 1° x 0.25 km, 256 data levels Units: inches One product per volume scan Definition: The Digital Storm-total Difference product shows the difference between the dual-pol DSA storm-total precipitation accumulation product and the legacy STP precipitation accumulation product. Bias cannot be applied to this product. Uses: This product is intended to highlight the differences between dual-pol precipitation estimation products and legacy precipitation estimation products. |
 |


 Follow us on YouTube