| Northern Mountains |
| December-January-February Precipitation |
|
(Return to Main Feature) or go to CD1 | CD3 | CD4 | CD5 | CD6 | CD7 | CD8 |
|
While above normal precipitation is correlated to El Niño events across much of New Mexico, the relationship is weaker across the northern tier of the state and at high elevation stations. The tilt toward above average precipitation is not as pronounced in these areas. High elevations sites are able to capture moisture from a variety of weather systems that track over our northern mountains and thus the anomalies associated with the ENSO cycle are more variable. The charts for climate division 2 illustrate more variability than other divisions. Considering only strong El Niños, the increase in precipitation during the winter months is actually reduced at some locations including values of 79% at Eagle Nest and 85% at Red River. Precipitation at Las Vegas was greater than average during 4 of 7 strong El Niño events, with an average 131% of precipitation. Las Vegas is located in the southern portion of the climate division, east of the Sangre de Cristo mountains, and at a lower elevation. A description of the graphs is located at the bottom of the page. |
 |
| Percent of Longterm Average for all El Niño Events = 102% , for strong El Niño Events =102% |
 |
| Percent of Longterm Average for all El Niño Events =96% , for strong El Niño Events = 79% |
 |
| Percent of Longterm Average for all El Niño Events = 110% , for strong El Niño Events = 98% |
 |
| Percent of Longterm Average for all El Niño Events = 95%, for strong El Niño Events = 85% |
 |
| Percent of Longterm Average for all El Niño Events = 110% , for strong El Niño Events = 113% |
 |
| Percent of Longterm Average for all El Niño Events = 112%, for strong El Niño Events = 116% |
 |
| Percent of Longterm Average for all El Niño Events =105% , for strong El Niño Events = 131% |
|
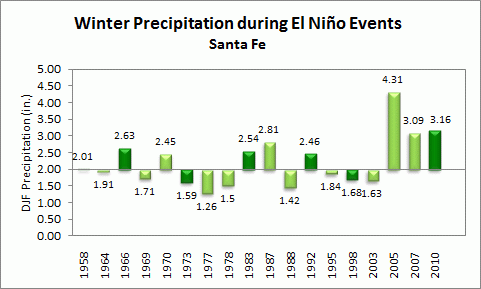
Precipitation values for 3-month periods during 18 El Niño Events since 1949-50 are plotted with respect to the long term precipitation average, listed to the right of the graph. The precipitation totals for each 3-month period are plotted above or below each bar. Years for which the El Niño Event was considered to be strong are colored in dark green. "M" represents a 3-month period with missing data. Finally, the percents of long term normal for all El Niño events and for the strong El Niño events are listed below each graph. |