It may be wild to think that the atmosphere around you is a fluid that is constant motion. On our human scale, we are aware of this motion when wind blows or when you encounter a a current running along a beach while you are swimming. Yet, your eyes alone rarely observe the larger scale phenomena of fluid motion in the atmosphere. Luckily, science and technology have progressed in such a way that we can visualize this information in real time. So what are we looking at?
The phenomena shown are known as Von Karman vortices. They are named after Theodore Von Karman, who first described this in the atmosphere and who also was a co-founder of NASA's Jet Propulsion Laboratory. Von Karman vortices look like spirals that form in the clouds in the wind-wake of islands. As a prevailing wind encounters the island, the disturbance in the flow propagates downstream of the island in the form of a double row of vortices which alternate their direction of rotation.
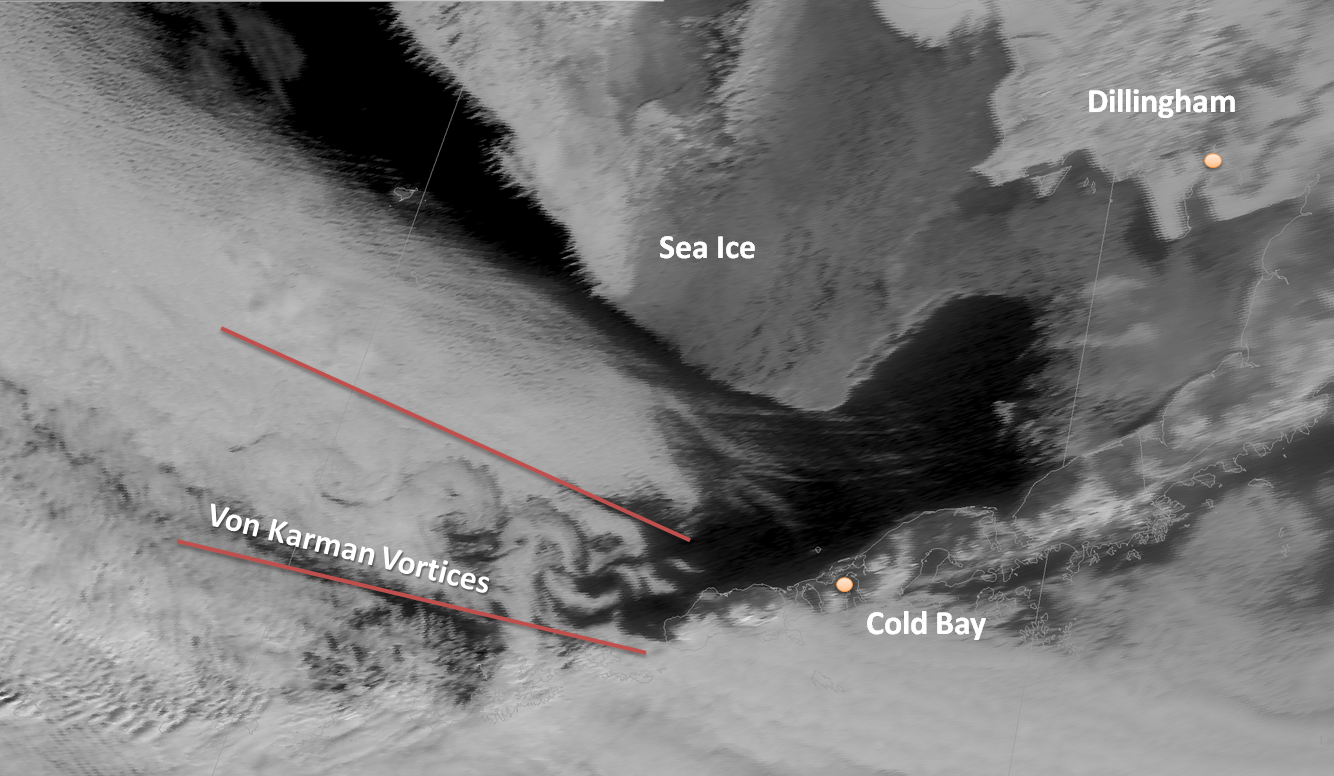
This animated image was obtained on March 25th, 2017 from the Himawari 8 satellite. Himawari-8 is operated by the Japan Meteorological Agency and the imagery is courtesy of the JMA. The data was taken from the 0.5 km resolution, red or visible channel 0.64 μm imager. In this example, lower level winds are flowing from the east/southeast to the west/northwest along Unimak Island. It's hard to tell if these vortices are being formed from only the Westdahl Volcano (that reaches to over 5,000 ft in altitude). Inspection reveals that Shishaldin (at 9,300 ft) may also be aiding in these cloud features. From start to finish, we are observing about 4 hours of data in this animation.
We've slowed the image down to a single frame to dissect it for easier interpretation.
Credit is due to the JMA for the imagery and also to NASA for much of the verbiage. For much more detailed information, please visit this link.
![]()
![]()

