|
|
|
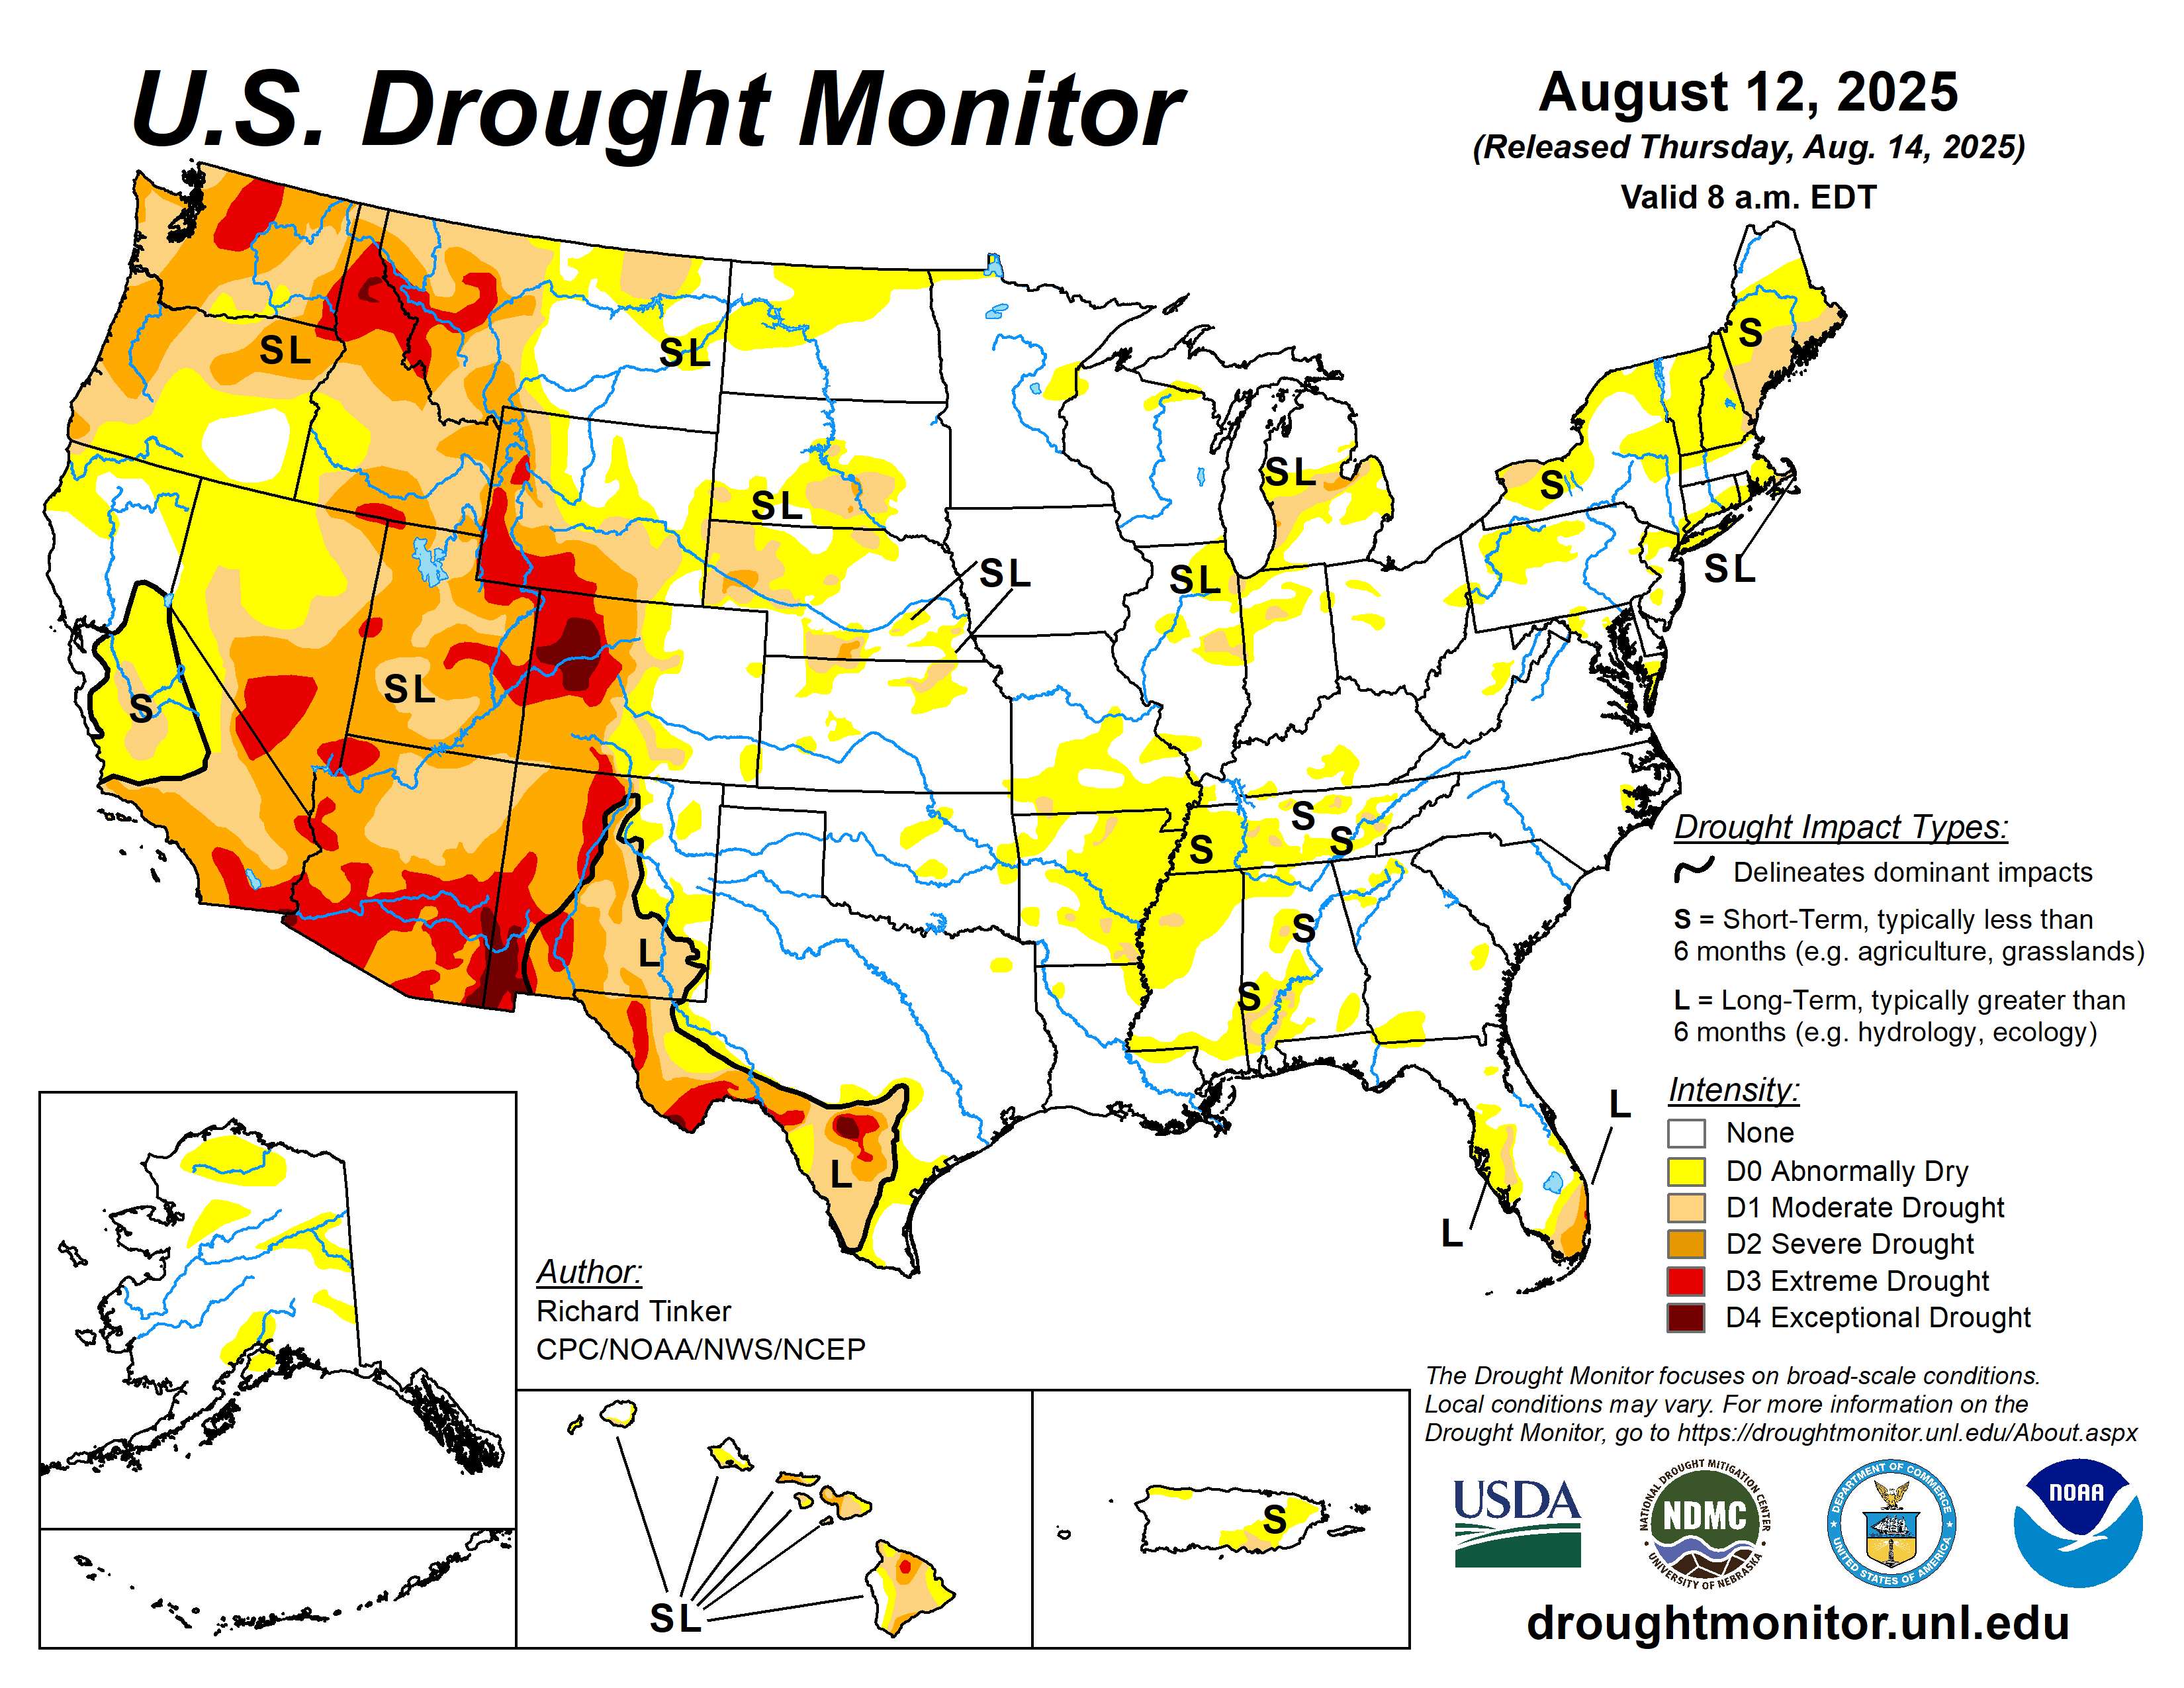
The map below is from the U.S. Drought Monitor. It shows the latest drought conditions across the United States.
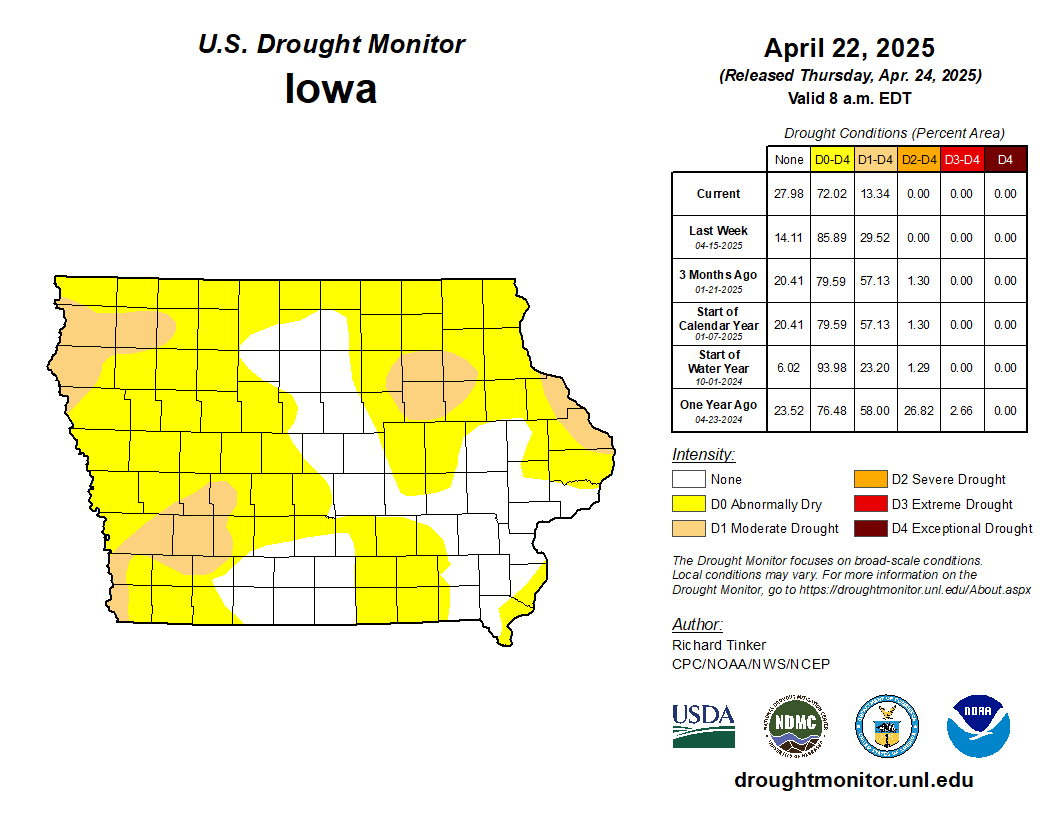
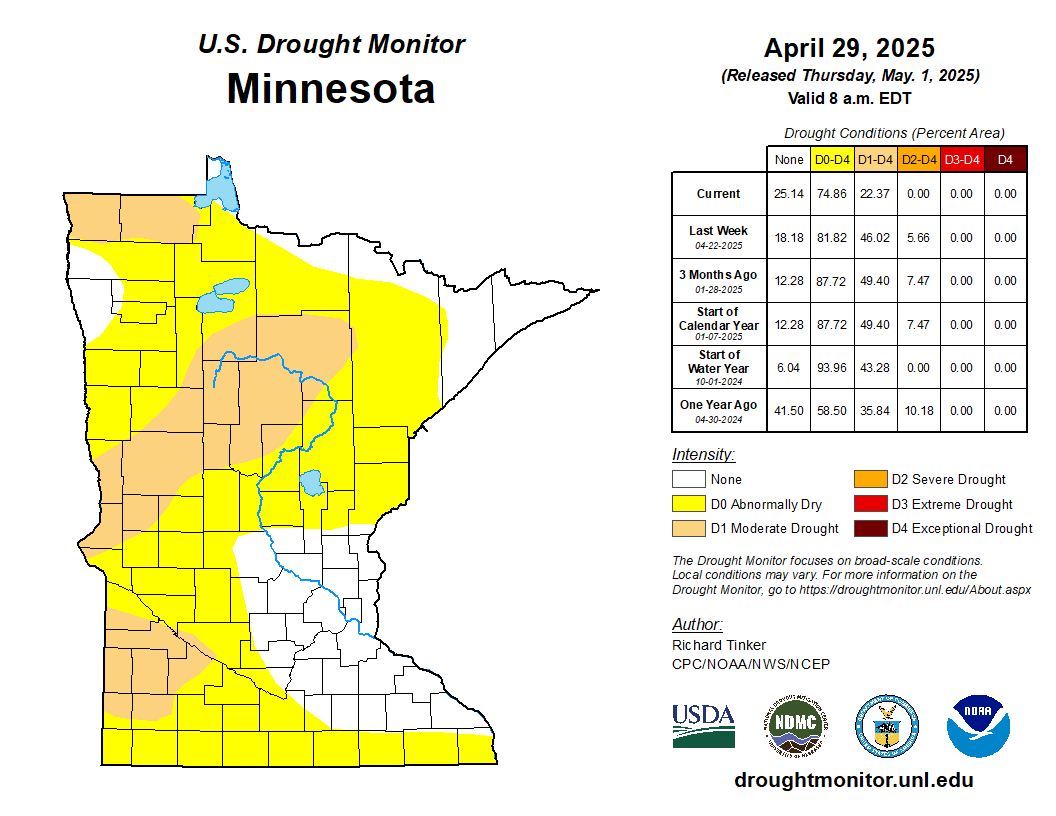
The U.S. Drought Monitor is a weekly collaborative effort between a number of federal agencies including NOAA/NWS, U.S. Department of Agriculture and the National Drought Mitigation Center. The data cutoff is Tuesdays at 6 AM Central Standard Time and the product is updated weekly on Thursdays at 7:30 AM Central Time. For those needing to look at past U.S. Drought Monitors an archive is available back to May 20, 1999. This information can be found at the following link. Local Drought Situation: The maps below are compliments of the U.S. Drought Monitor and they show the current drought conditions across Iowa, Minnesota, and Wisconsin.
|
The categories of drought are defined as follows: Moderate Drought (D1) - Some damage to crops, pastures; fire risk high; streams, reservoirs, or wells low, some water shortages developing or imminent, voluntary water use restrictions requested. Severe Drought (D2) - Crop or pasture losses likely; fire risk very high; water shortages common; water restrictions imposed. Extreme Drought (D3) - Major crop/pasture losses; extreme fire danger; widespread water shortages or restrictions. Exceptional Drought (D4) - Exceptional and widespread crop/pasture losses; exceptional fire risk; shortages of water in reservoirs, streams, and wells, creating water emergencies. |
|
Climatological Summary: |
|
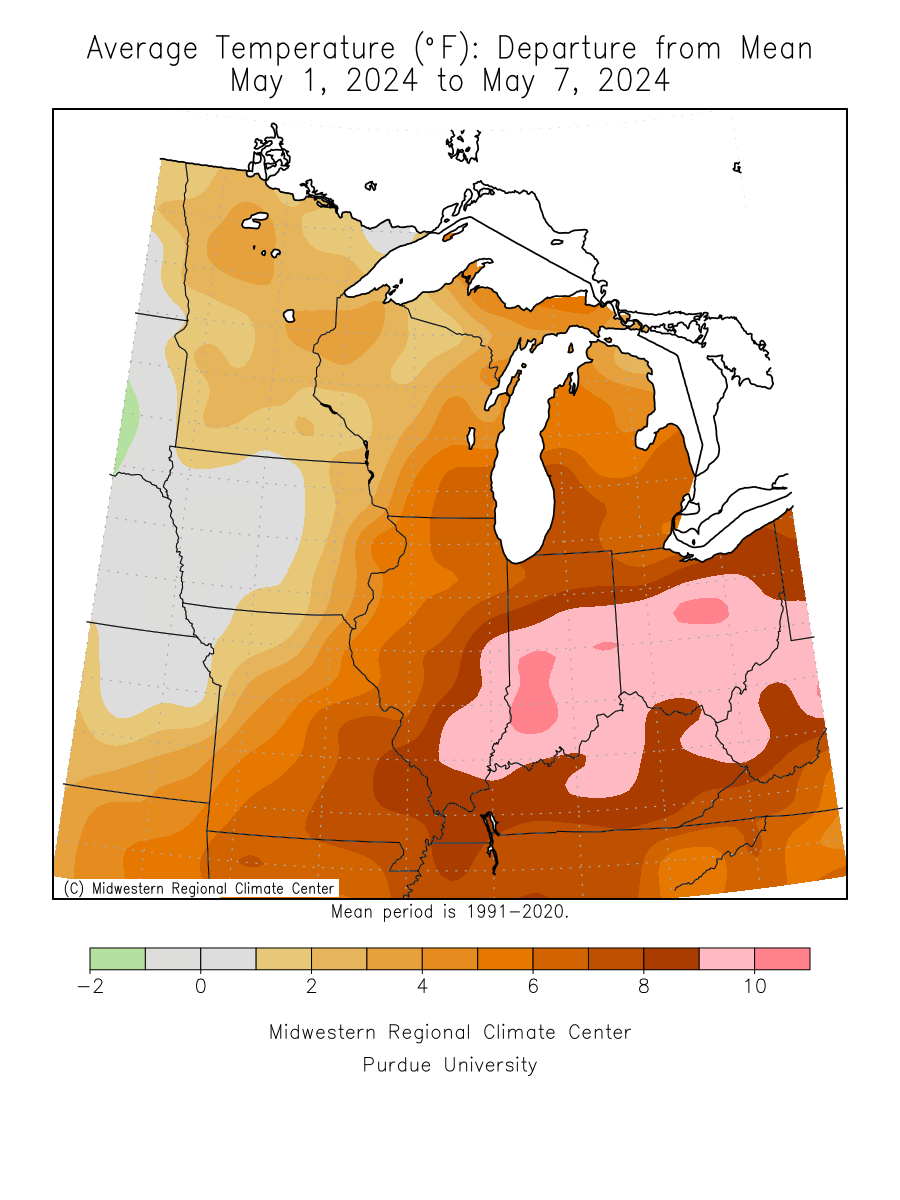
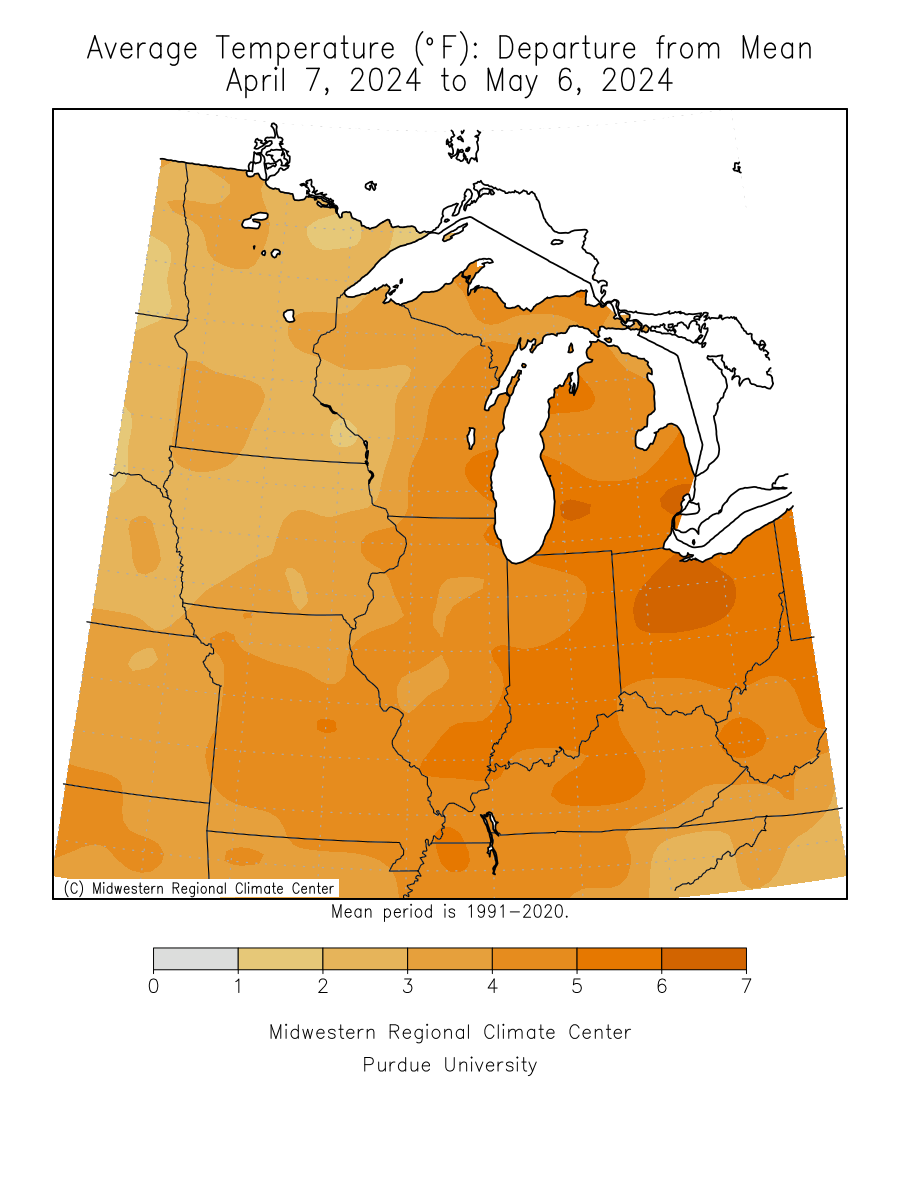
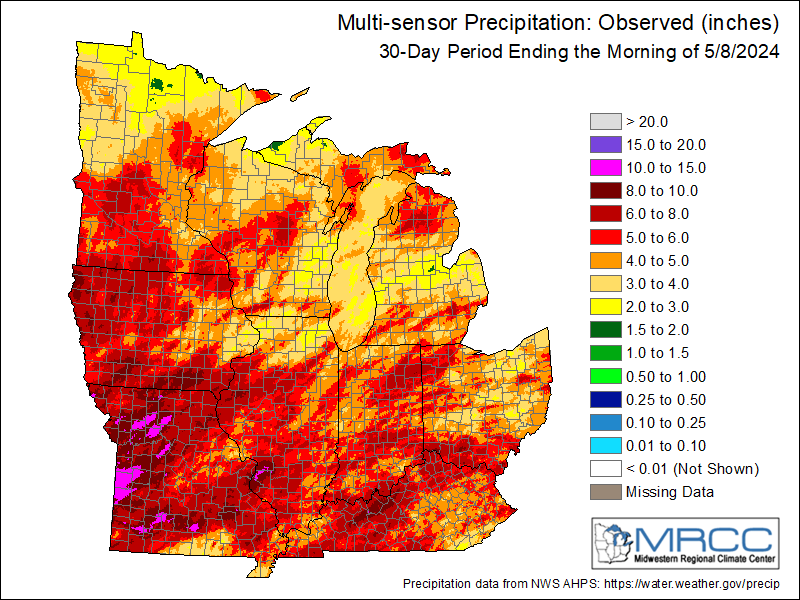
Temperature Departures: The images below are compliments of the Midwestern Regional Climate Center (MRCC) and High Plains Regional Climate Center (HPRCC), They provide specifics on where temperatures were above or below normal across Wisconsin, southeast Minnesota, and northeast Iowa during the past week and 30-days.
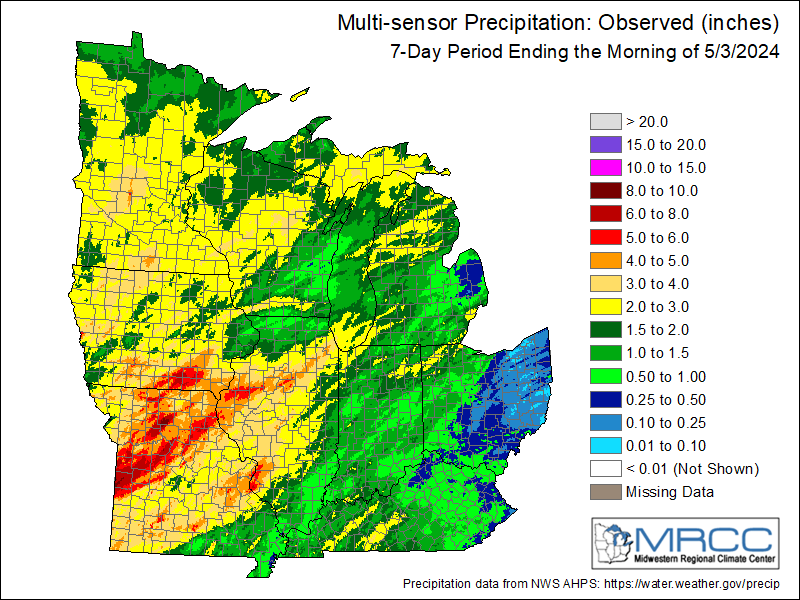
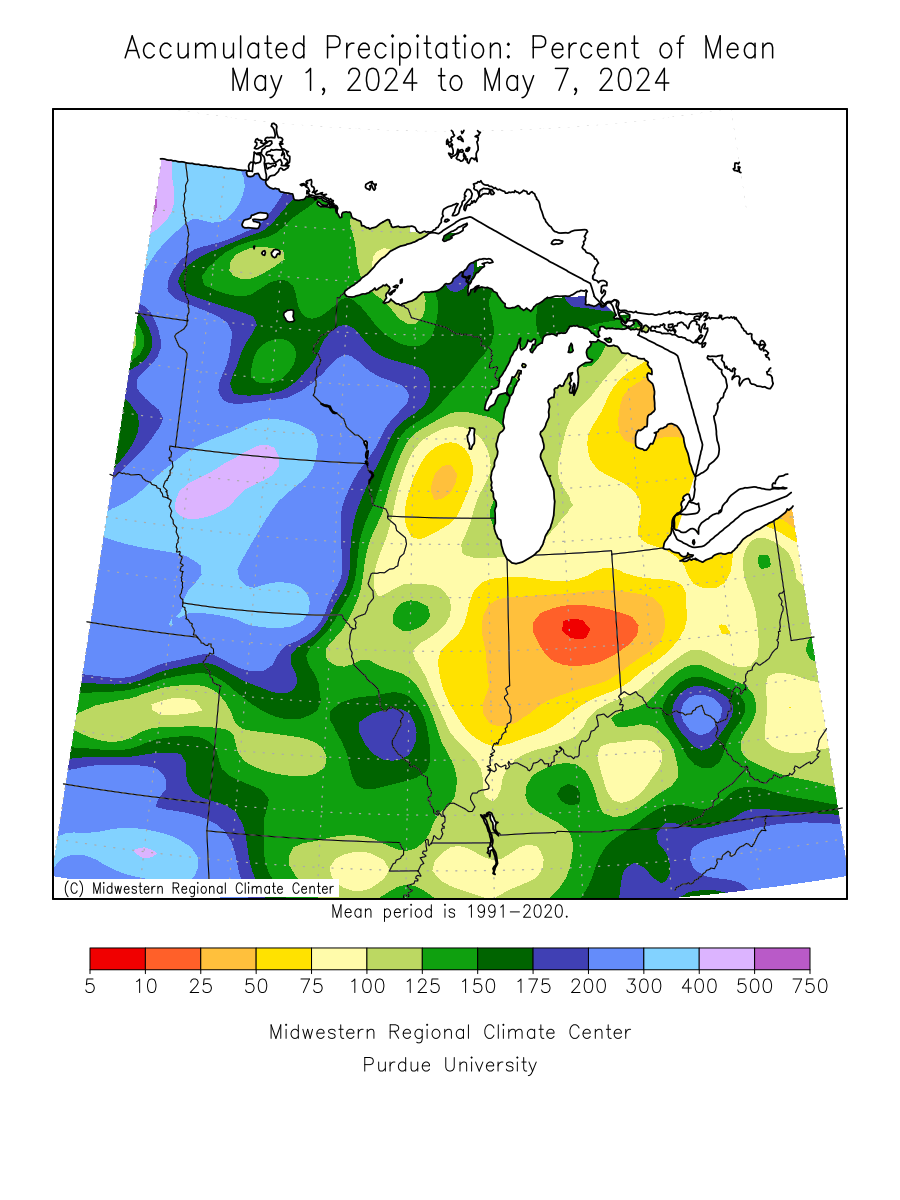
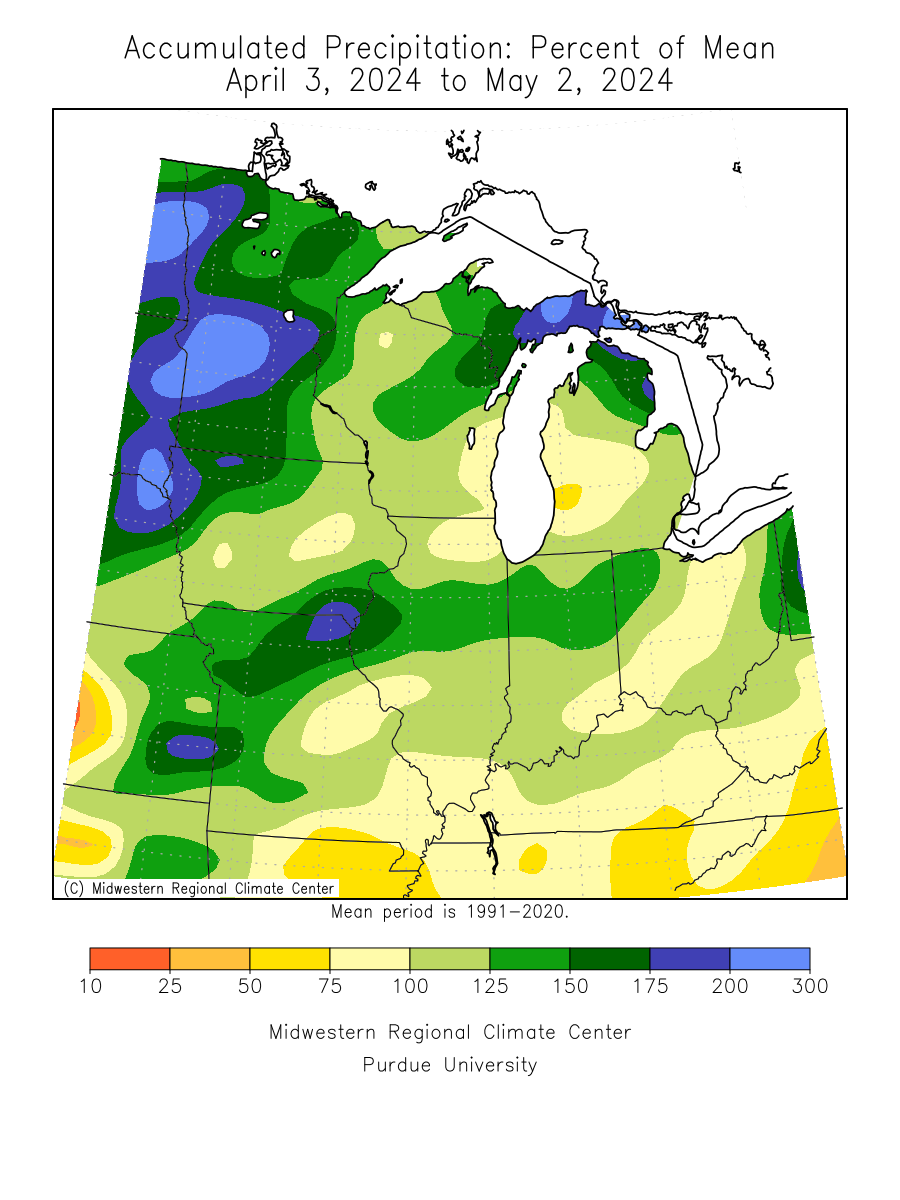
Precipitation Departures: The images below are compliments of the Midwestern Regional Climate Center (MRCC), They provide specifics on where and it provides more specifics on where these precipitation deficits or surpluses exist across Wisconsin, southeast Minnesota, and northeast Iowa during the past 30, 90, and 180 days.
|
Precipitation departures out to 180 days, year-to-date, and water-year-to-date (beginning on October 1st) can be obtained from the NWS Experimental Precipitation Analysis Web Page: Drought ACIS: This tool allows you the ability to explore data related to drought from the Regional Climate Centers (RCCs). You can look at length or periods without rain, temperature data, and more. Click on the logo below to gain access to this tool.
|
|
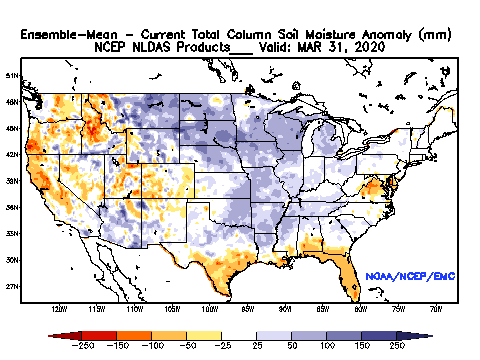
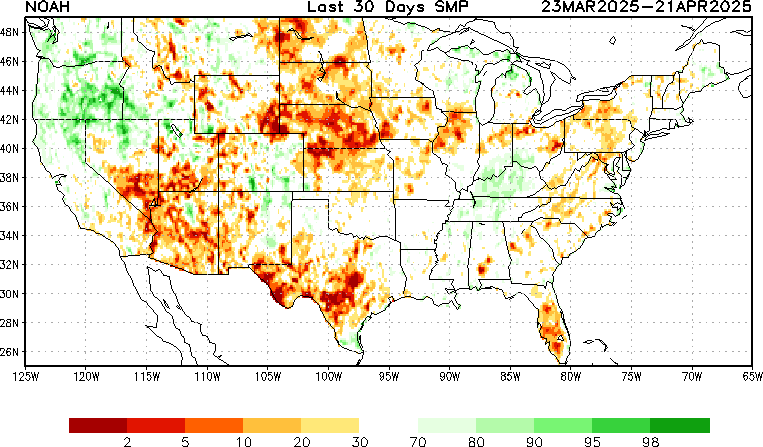
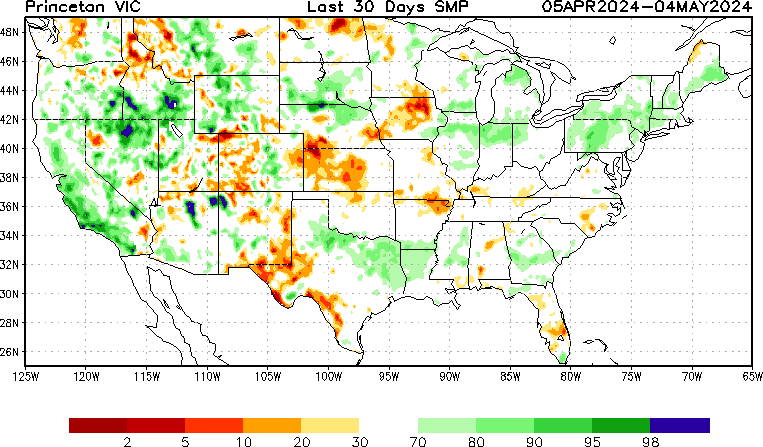
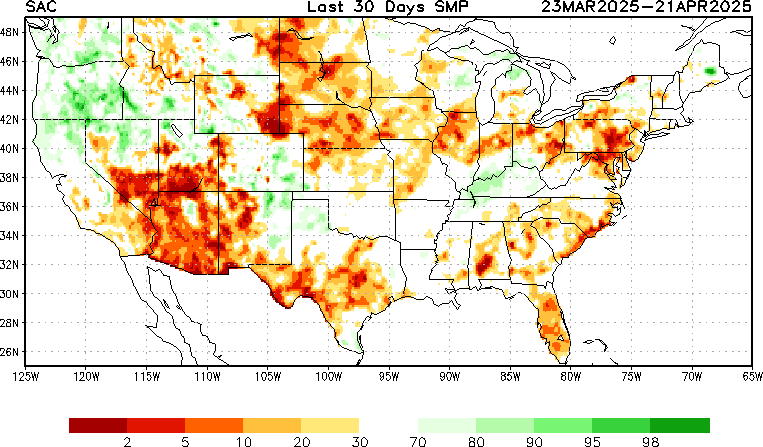
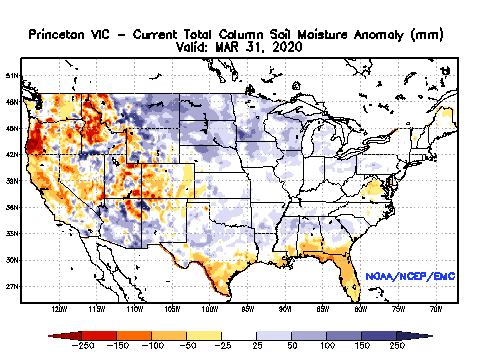
Soil Moisture Conditions: |
|
| Soil moisture from the NLDAS Drought Monitor Soil Moisture. The NLDAS experimental drought monitor is derived from near real-time soil moisture output from both the NASA MOSAIC and NCEP Noah land surface models. The anomalies and percentiles are based on a 28 year climatology (1980 - 2007). Two separate climatology files are used; one for the calculation of anomalies, and one for the calculation of percentiles. The anomaly climatology file contains 1 soil moisture value per day (daily average over 28 years) for each gridbox. The percentile climatology file contains 140 soil moisture values per day (5 for each year) for each gridbox.
Anomalies are calculated by comparing the current soil moisture values to mean values for the same time of year over each gridbox. For weekly anomalies, the past week's worth of soil moisture values are first averaged together to form a single value. The same procedure is applied to the corresponding week of the anomaly climatology file. The two values are then differenced to derive an anomaly soil moisture value. A similar procedure is followed to compute monthly (30 day) anomalies. Percentiles are based upon an 5 day moving window of soil moisture values. This acts to smooth out the soil moisture record. Weekly analyses for each gridbox are computed by comparing the past 7 days to corresponding period in the percentile climatology. Taking day 1 of the week as an example, hourly soil moisture values from this day are averaged together to form a single value. This value is then ranked against the soil moisture values from each day of the 5 day window surrounding day 1 of the corresponding week in the percentile climatology. This same process is then repeated for days 2-7 of the week, with each day of the week contributing equally to the overall ranking value. Monthly (30 day) percentile analyses are computed in a similar fashion. |
|
|
|||||||||||||||||||||||
|
Ground Water Impacts: |
|
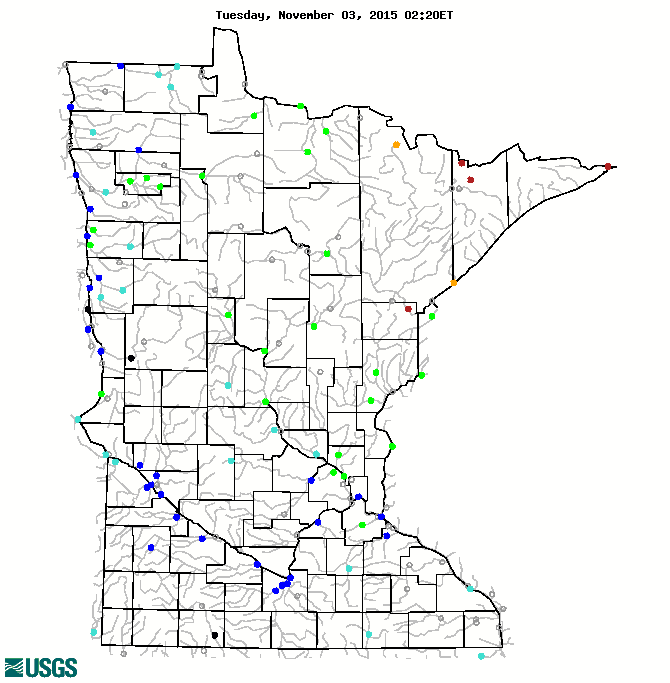
The USGS maintains a network of wells to monitor the effects of droughts and other climate variability on ground-water levels. The network consists of a national network of about 140 wells monitored as part of the Ground-Water Resources Program, supplemented by wells in some States monitored as part of the Cooperative Water Program. For a list of network wells, click on a State on the image below. USGS Ground-Water Climate Response Network |
Additional information about ground levels can be found either at the USGS Ground-Water Climate Response Network at: https://groundwaterwatch.usgs.gov/
|
|
River and Stream Flow Conditions: |
|
The maps below depict streamflow conditions as computed at USGS gaging stations. The colors represent real-time streamflow compared to percentiles of historical daily streamflow for the day of the year. Only stations having at least 30 years of record are used.
The data used to produce the maps above are provisional and have not been reviewed or edited. They may be subject to significant change. Maps containing no dots indicate locations where flow data for the current day are temporarily unavailable. During winter months, some states (or parts of states) may have fewer dots than at other times of the year due to ice effects. |
Hourly and forecast river stages out to 90 days can be found at the National Weather Service's (NWS) Advanced Hydrologic Prediction Service (AHPS) web page: https://water.weather.gov/ahps2/ Additional Current stream and river stages may be viewed at the following USGS Web Site: |
||||||||
|
Fire Danger Hazards: |
|
Minnesota:
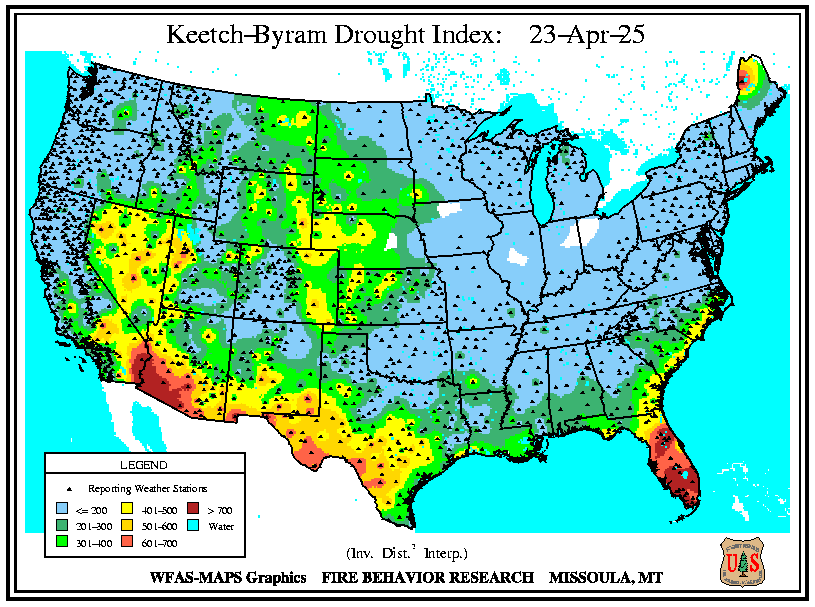
Wisconsin: https://dnr.wi.gov/forestry/Fire/Fire_Danger/Wis_Burn/StateCounties.asp Keetch-Byram Drought Index (KBDI): This is a drought index that is specifically related to fire potential. The KBDI is broken into four categories which indicate the susceptibility of ground fuels to fire danger. The table in the right hand column indicate what the categories mean.
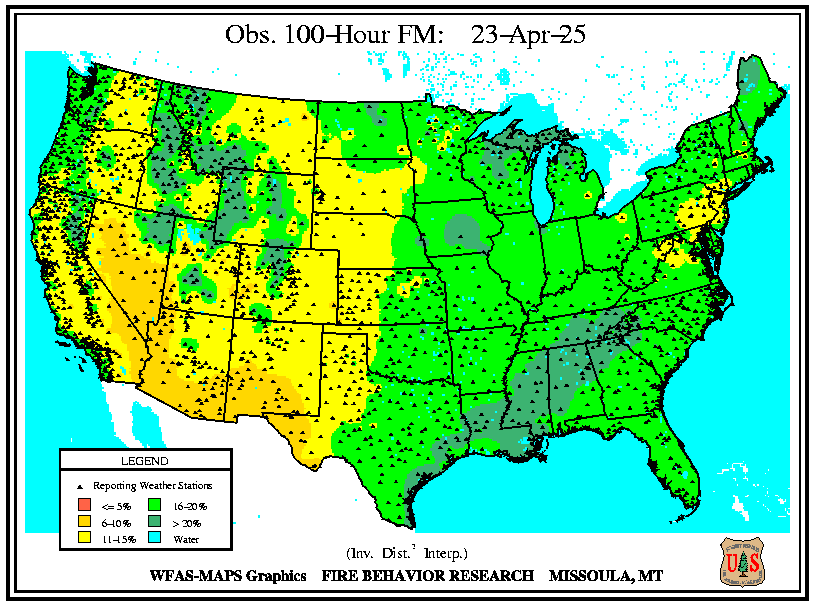
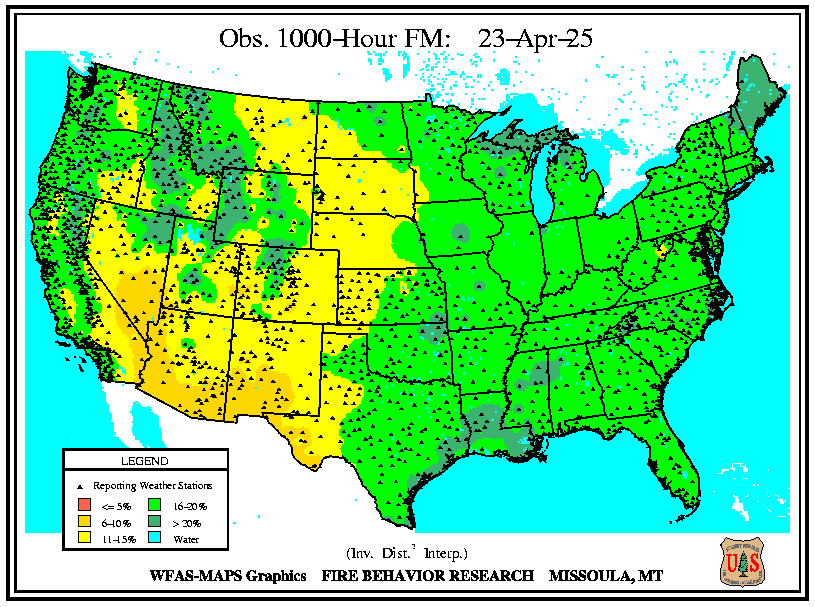
Dead Fuel Moisture: Dead fuel moisture responds solely to ambient environmental conditions and is critical in determining fire potential. Dead fuel moistures are classed by timelag. A fuel's timelag is proportional to its diameter and is loosely defined as the time it takes a fuel particle to reach 2/3's of its way to equilibrium with its local environment. Dead fuels in NFDRS fall into four classes (1-hour, 10-hour, 100-hour, and 1000-hour); however, when looking at droughts usually only the 100-hour and 1000-hour fuel moisture are watched. 100-hour Dead Fuel Moisture: Measured from fuels which are 1 to 3" in diameter.Computed from 24-hour average boundary condition composed of day length, hours of rain, and daily temperature/humidity ranges.
1000-hour Dead Fuel Moisture: Measured from fuels which are 3 to 8" diameter. Computed from a 7-day average boundary condition composed of day length, hours of rain, and daily temperature/humidity ranges.
|
For updated DNR Fire Conditions consult the following Web Sites: In Minnesota: In Wisconsin: The Keetch-Byram Drought Index (KBDI) is a drought index that is specifically related to fire potential. The KBDI is broken into four categories which indicate the susceptibility of ground fuels to fire danger. Below are the four categories and a brief description of each.
From the Wildland Fire Assessment System, one can get Keetch-Byram Drought Index (KBDI) and Dead Fuel Moisture data. |
||||||||||||||||
|
Agriculture Impacts: |
|
For additional information on agriculture impacts may be viewed at the United States Department of Agriculture (USDA) National Agricultural Statistics Service NASS Web Site. |
|
Precipitation/Temperature Outlooks: |
|
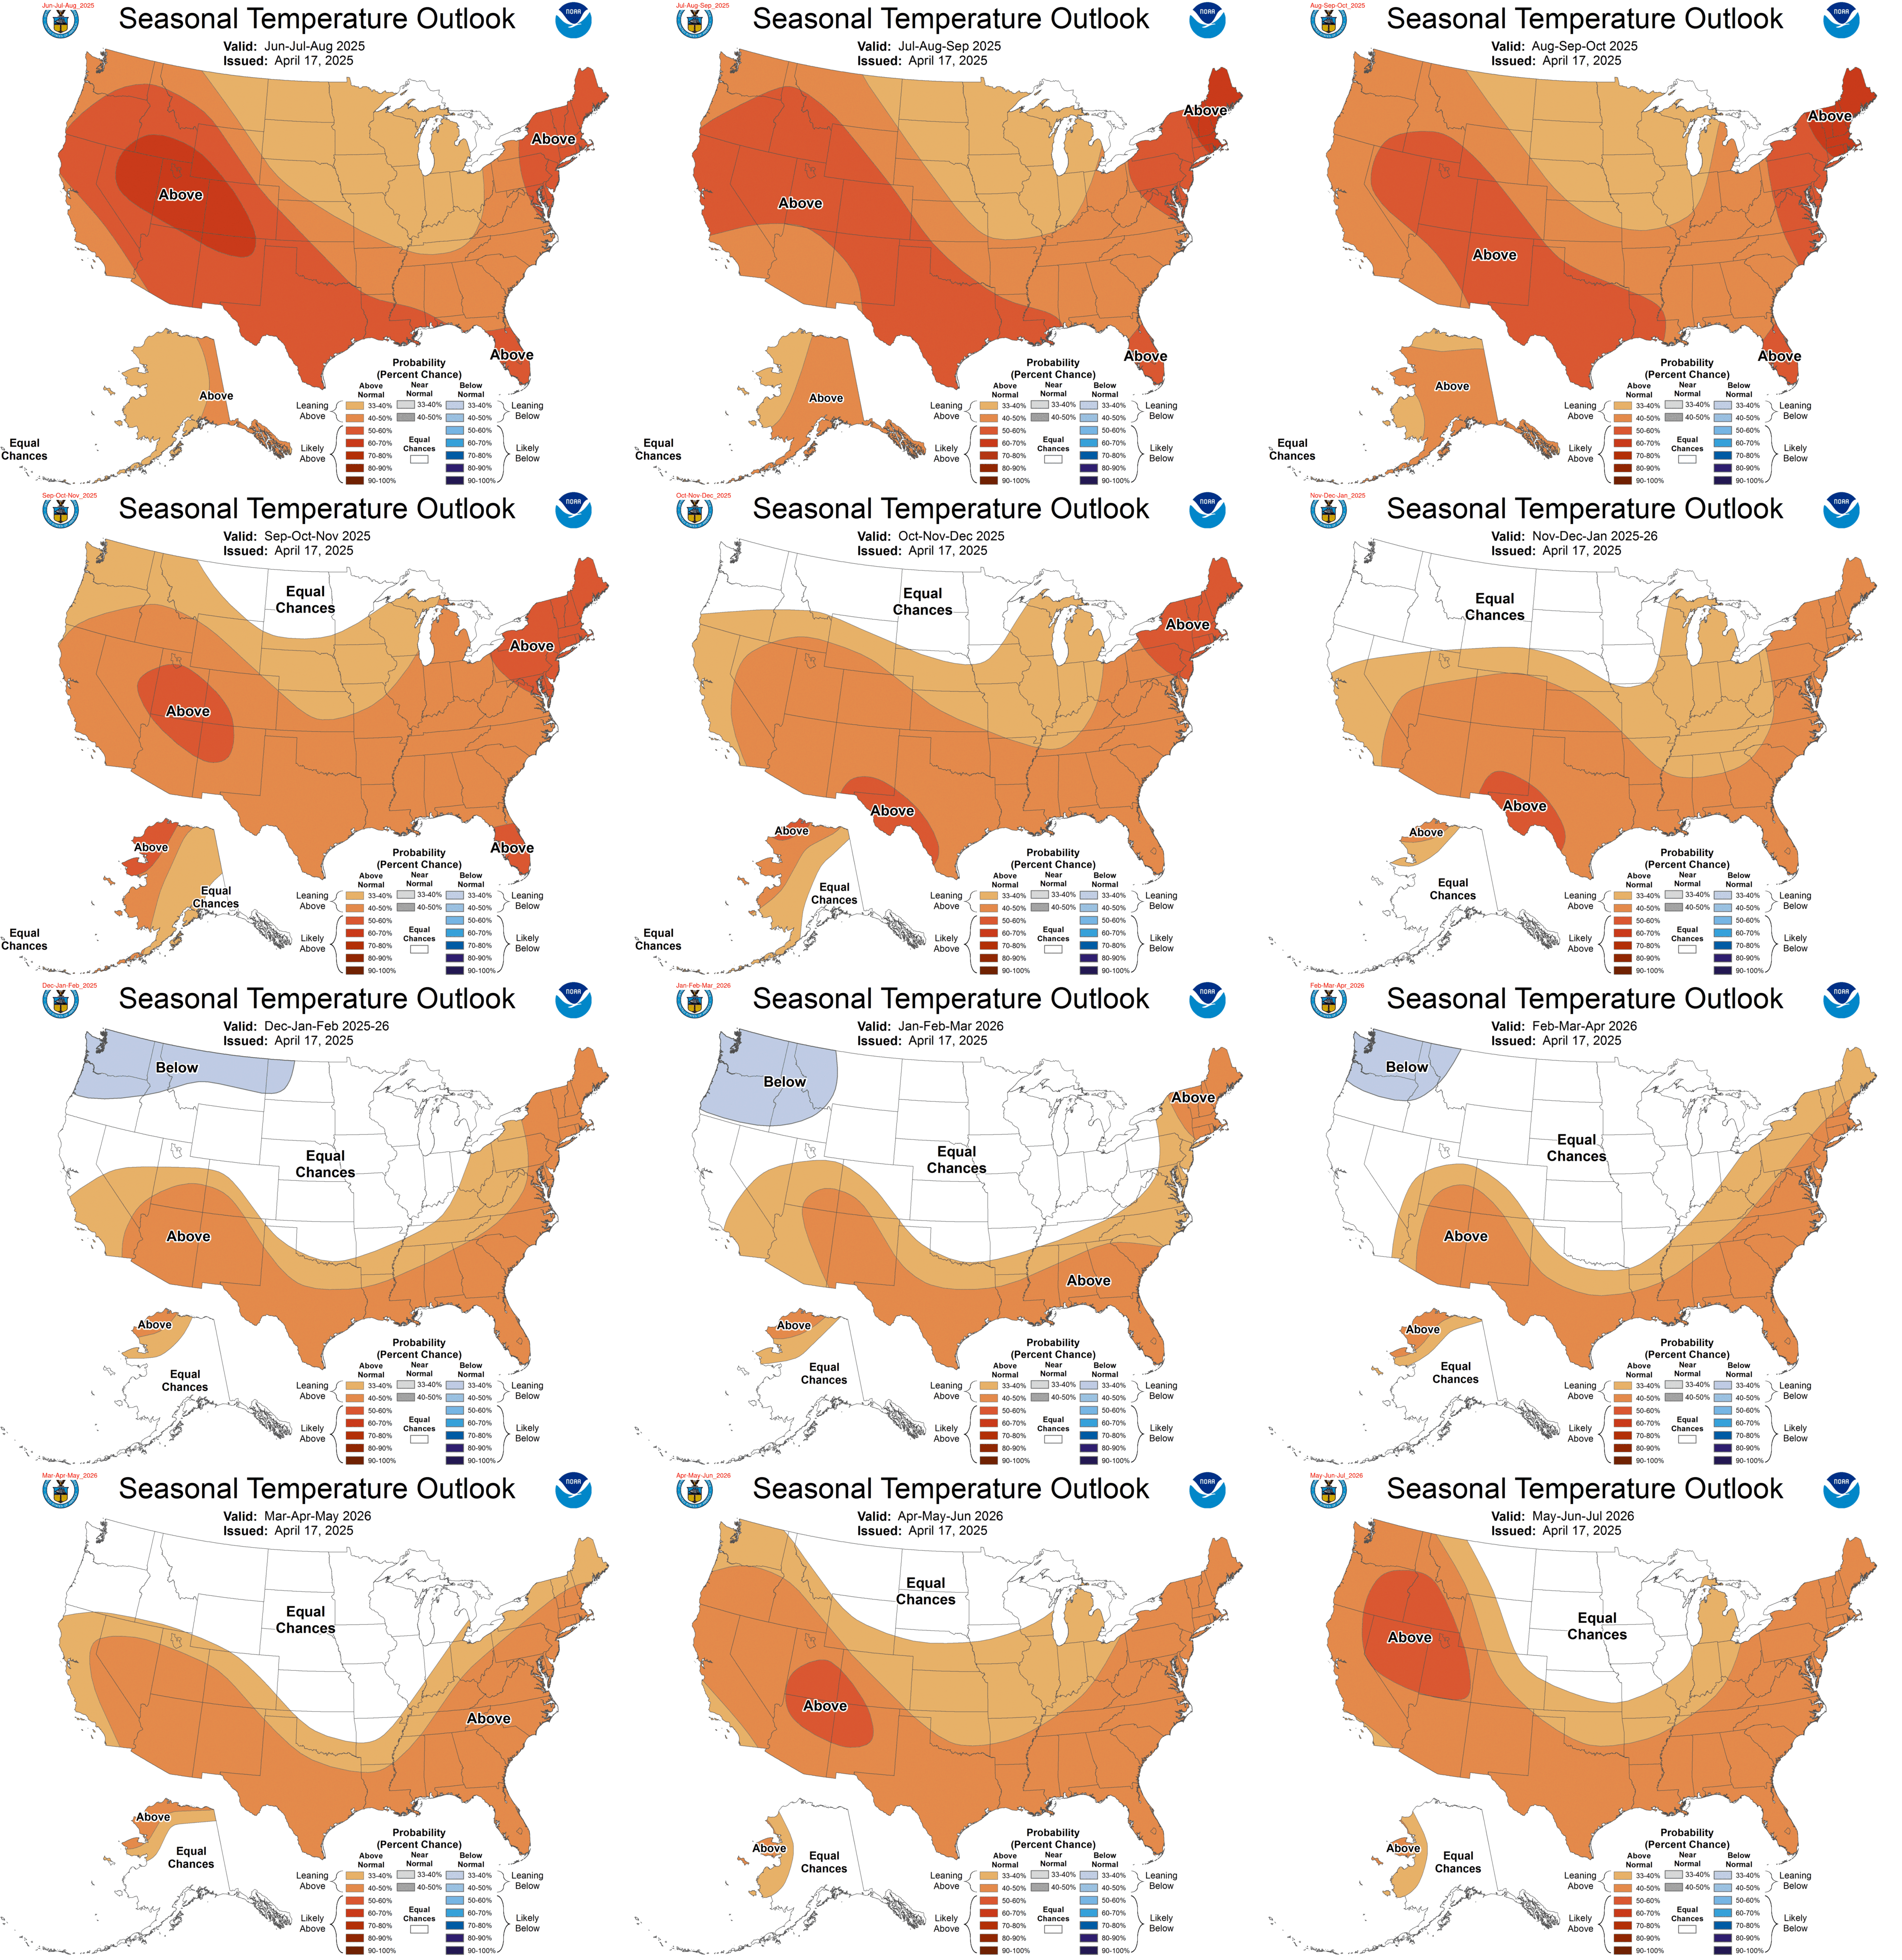
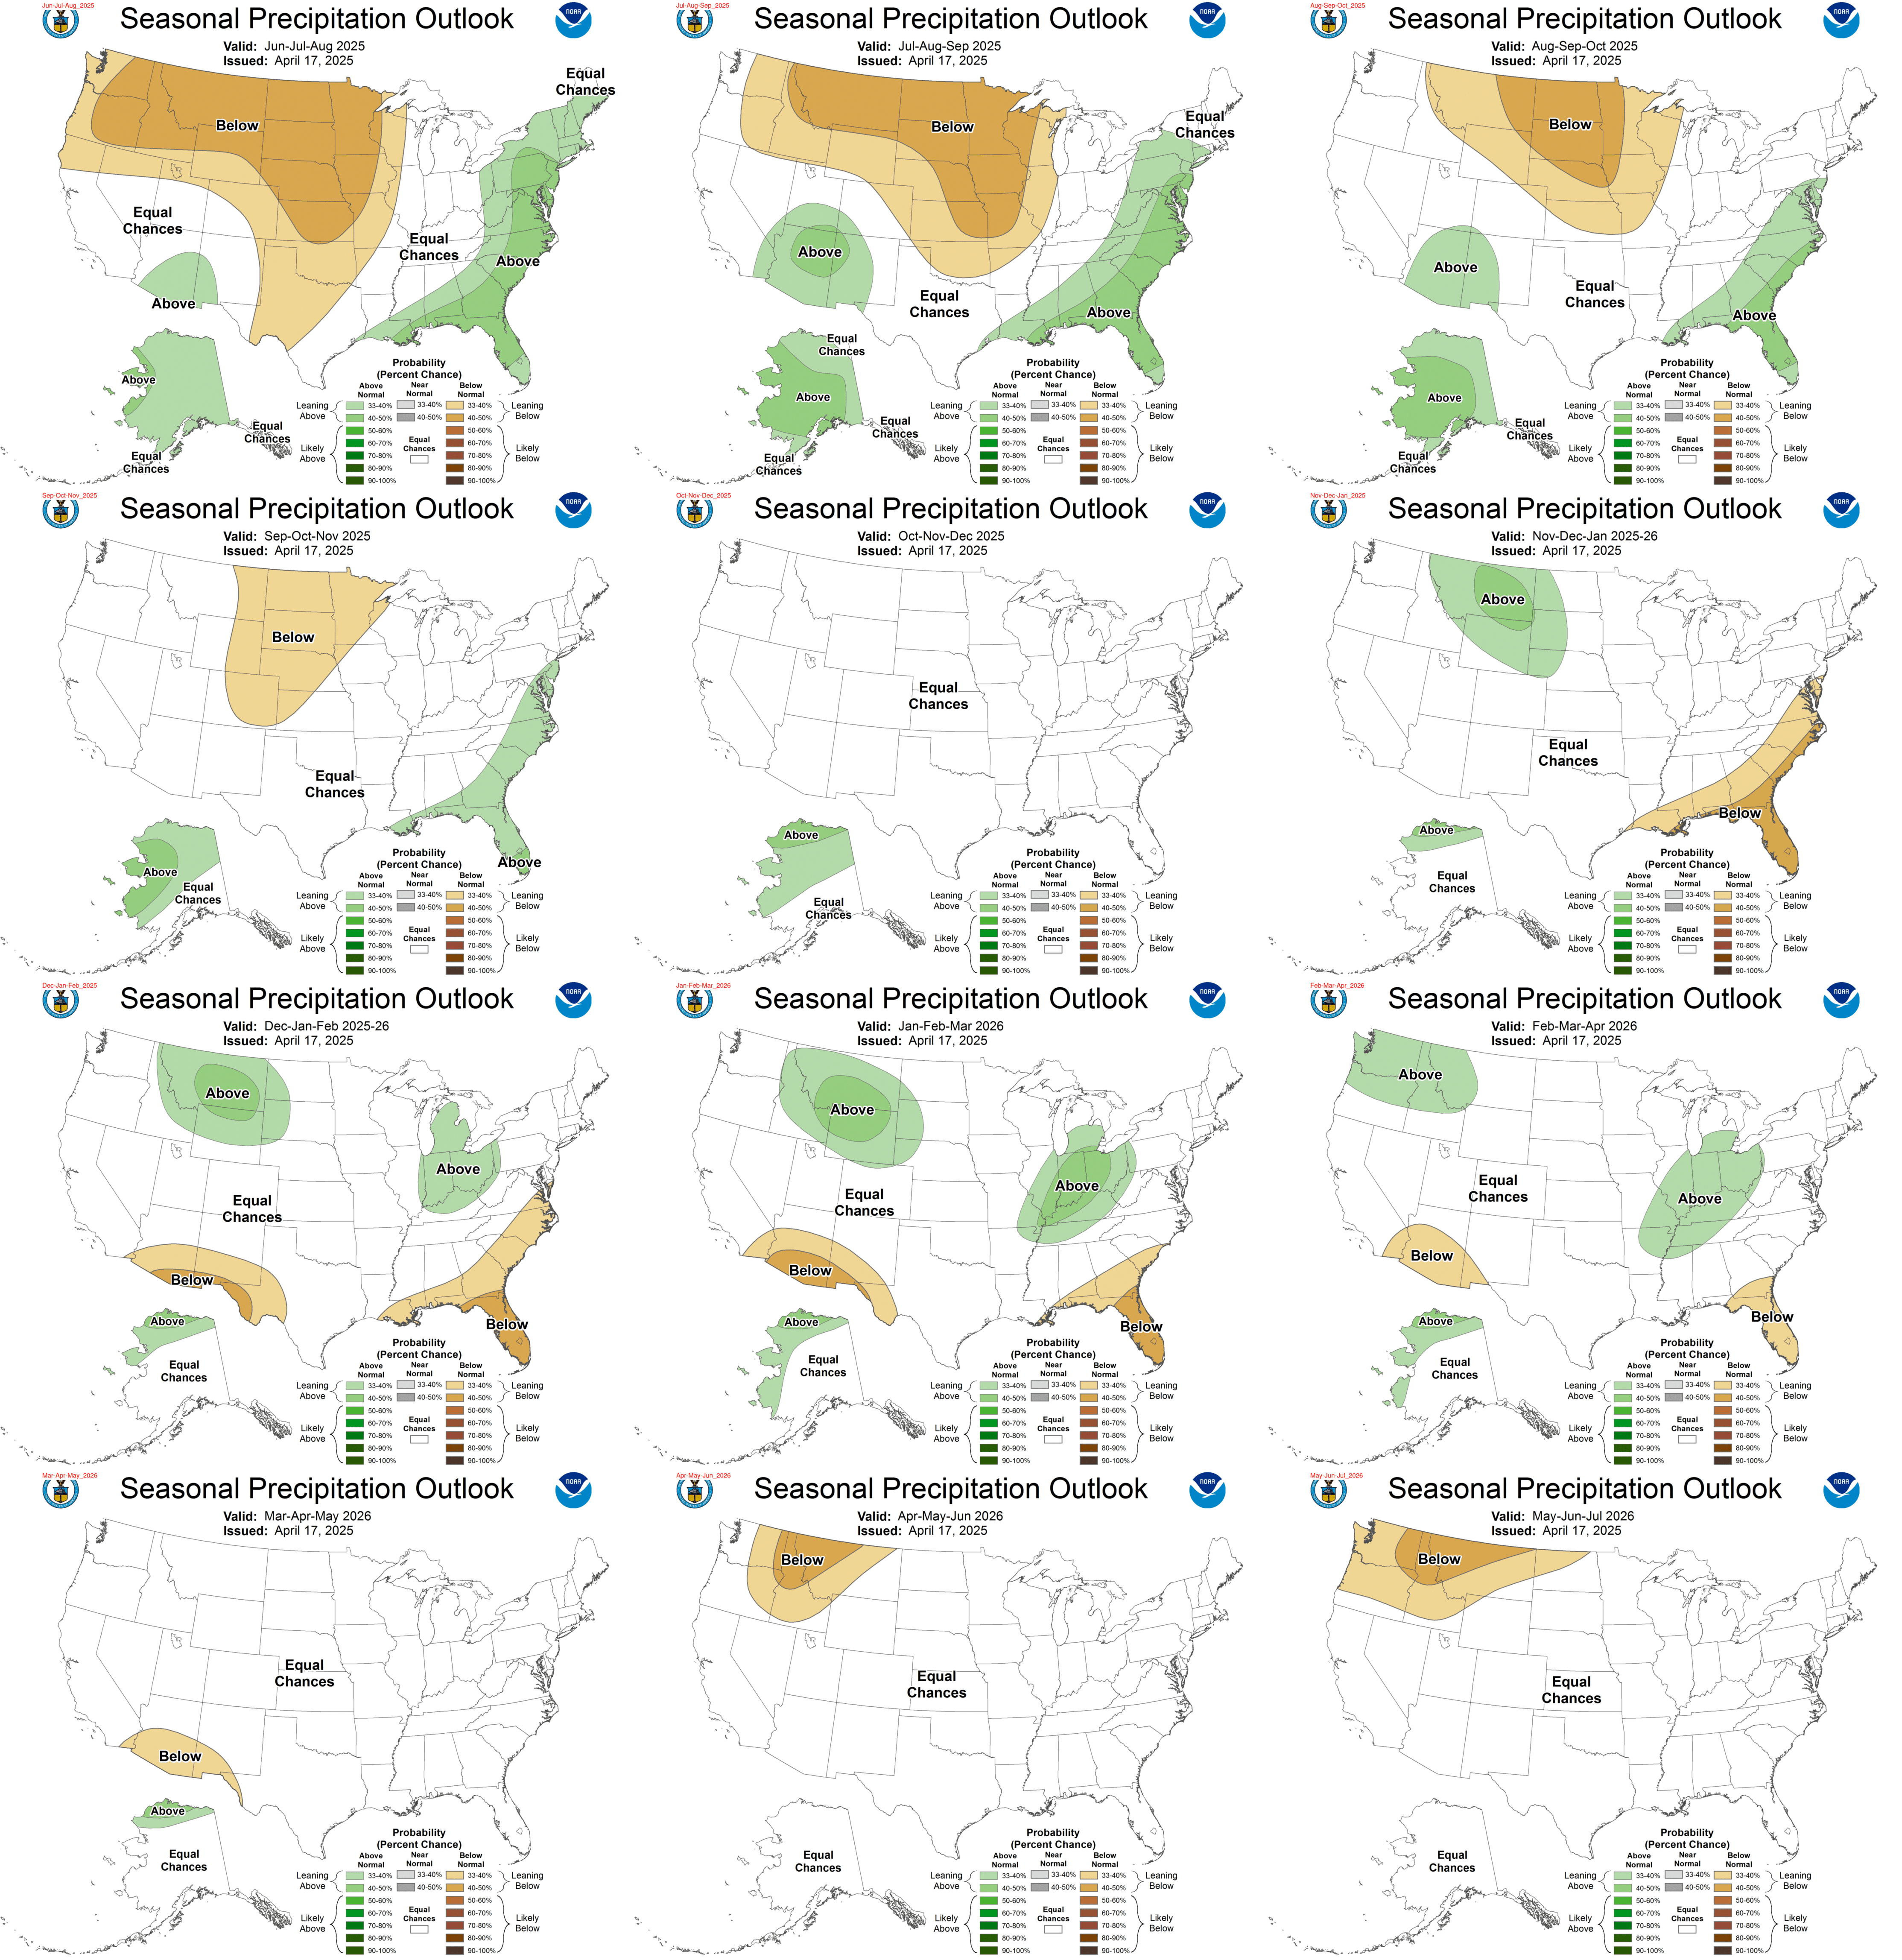
This section contains the 8-14 day, monthly, and 3-month temperature and precipitation outlooks. 8-14 Day Outlook:
Monthly Outlook: (These are updated on the third Thursday of each month)
3-Month (Seasonal)Outlook: (These are updated on the third Thursday of each month)
|
For updated temperature and precipitation probabilities consult the following Climate Prediction Center (CPC) Web Sites: 8 to 14 Day Outlook: http://www.cpc.ncep.noaa.gov/ Monthly Outlook: http://www.cpc.ncep.noaa.gov Seasonal Outlook: |
||||||||||||||||||||
|
Questions or Comments: |
|
If you have any questions or comments about this drought information please contact:
|