National Weather Service United States Department of Commerce


Tropical Depression Harvey
  August 30-31, 2017

 
Overview Tornadoes Rainfall Totals Surface/Upper Air/Outlooks Other Links
 

Overview

The National Hurricane Center begin issuing statements on a disturbance east of the Lesser Antilles on August 17th.  It quickly developed into Tropical Storm Harvey by that afternoon.  Harvey weakened back into a depression on Saturday, August 19th.  Harvey remained a depression while it crossed the Caribbean Sea and across the Yucatan Peninsula. Harvey regained Tropical Storm status on early Thursday, August 24th, over the southwest Gulf of Mexico.  Harvey begin to track northwest and quickly become a hurricane by that afternoon.  Harvey became a Category 3 hurricane on Friday, August 25th, and briefly reached Category 4 status before moving inland Friday night near Port Aransas, Texas.  Harvey moved inland and became stationary near the Texas Coast for several days, producing catastrophic flooding along the upper Texas coast with rainfall amounts of 30-50 inches. Harvey moved back over the water briefly before moving back inland over southwest Louisiana on Wednesday, August 30th

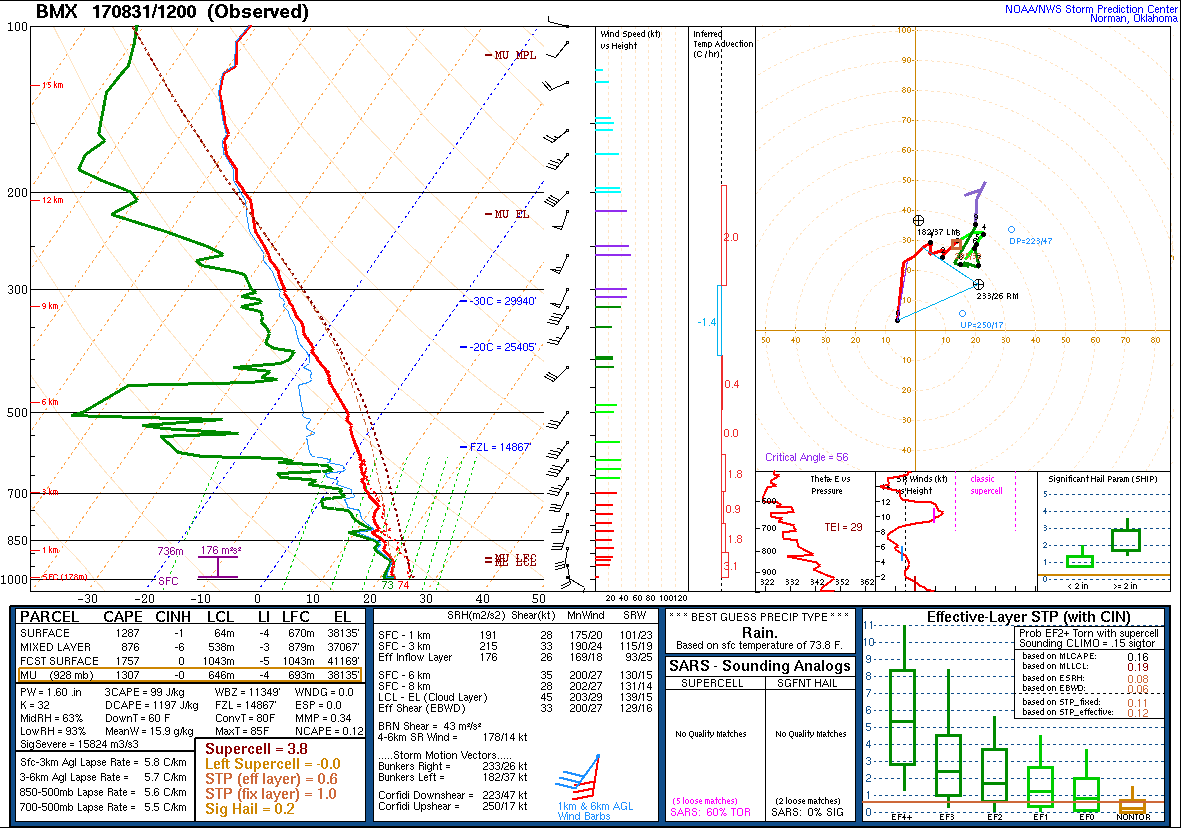
The remnants of Harvey tracked northeast along the Mississippi River over the next few days and produced a couple days of heavy rainfall over portions of Central Alabama, but thankfully, it only led to some minor flooding.   On Thursday, August 31st, several feeder bands on the east side of Harvey tracked northeast across west Central Alabama and produced four tornadoes. Additional tornadoes touched down across portions of Texas, Louisiana, Mississippi and Tennessee between August 26th and August 31st. Below are links to the write ups for the tornadoes and other additional data from Harvey.


Tornadoes

Location/Clickable Detailed Summary Link
Damage Rating/Estimated Maximum Wind Speeds
Injuries/Fatalities
Damage Path Length/Width
Starting Point/Time
Ending Point/Time
Reform/Fayette Tornado
(Pickens/Lamar/Fayette Counties)
EF-2
115 mph
6 Injuries
31.24 miles
600 yards

0.8 W Reform 33.3793/-88.0344
340 pm

6 ESE Bluff 33.7901/-87.8125
426 pm
Eoline Tornado
(Bibb County)
EF-1
90 mph
None
6.5 miles
100 yards

3 ENE Mertz
32.9173/-87.3345
657 pm

3 NE Marvel
32.9907/-87.2645
710 pm
Hopewell Church Road
(Bibb County)
EF-1
95 mph
None 0.56 miles
200 yards
4 WSW West Blocton
33.1008/-87.1718
728 pm
3 WSW West Blocton
33.1068/-87.1654
730 pm
Old Woodstock Road
(Bibb County)
EF-0
75 mph
None 0.30 miles
35 yards
2 ESE Woodstock
33.1960/-87.1277
742 pm
1 ESE West Blocton
33.1997/-87.1251
744 pm
 

Rainfall Totals

Rainfall Totals

August 30th

Rainfall Totals

August 31st

Surface/Upper Air/Outlooks

Surface Charts

Surface Chart

7 AM Aug 31st

Surface Chart

10 AM Aug 31st

Surface Chart

1 PM Aug 31st

Surface Analysis

4 PM Aug 31st

Surface Analysis

7 PM Aug 31st

Surface Chart

10 PM Aug 31st

KBMX Upper Air Soundings

KBMX Sounding

7 AM Aug 31st

KBMX Sounding

1 PM Aug 31st

KBMX Sounding

7 PM Aug 31st

Upper Air Charts

250mb Chart

250mb Chart at 7 AM Aug 31st

500mb Chart

500mb Chart at 7 AM Aug 31st

850mb Chart

850mb Chart at 7 AM Aug 31st

250mb Chart

250mb Chart at 7 PM Aug 31st

500mb Chart

500mb Chart at 7 Pm Aug 31st

850mb Chart

850mb Chart at 7 PM Aug 31st

Outlooks

Day 3 Outlook

Day 3 Outlook
Issued 230 AM on Aug 29th

Day 2 Outlook

Day 2 Outlook
Issued 1130 AM on Aug 30th

Day 1 Outlook

Day 1 Outlook
Issued 7 AM on Aug 31st

Tornado Outlook

Day 1 Tornado Probability
Issued 7 AM on Aug 31st

Wind Outlook

Day 1 Wind Probability
Issued 7 AM on Aug 31st

Hail Outlook

Day 1 Hail Probability
Issued 7 Am on Aug 31st


Other Links