A slow-moving storm system will continue to bring thunderstorms, heavy rain and flooding potential from Southeast Florida, into the Southern to Central Appalachians and the Mid-Atlantic regions today into Wednesday. Gusty winds and dry fuels will support widespread critical fire weather in the northern Plains into the Upper Midwest and the Southwest. Read More >
| Climate/Almanac Data - Mar Normals - Mar Records | |||||||||||||||||||||||||||||||||||||||||||||||||||||||||||||||||||||||||||
| MARCH | |||||||||||||||||||||||||||||||||||||||||||||||||||||||||||||||||||||||||||
|
|||||||||||||||||||||||||||||||||||||||||||||||||||||||||||||||||||||||||||
| The ranking is listed in parentheses (__) when within the "Top 10". | |||||||||||||||||||||||||||||||||||||||||||||||||||||||||||||||||||||||||||
| March 2020 was about 2 to 5 degrees above normal. | |||||||||||||||||||||||||||||||||||||||||||||||||||||||||||||||||||||||||||
| Precipitation totals for March 2020 were above normal. Except at Burlington which was slightly below normal. | |||||||||||||||||||||||||||||||||||||||||||||||||||||||||||||||||||||||||||
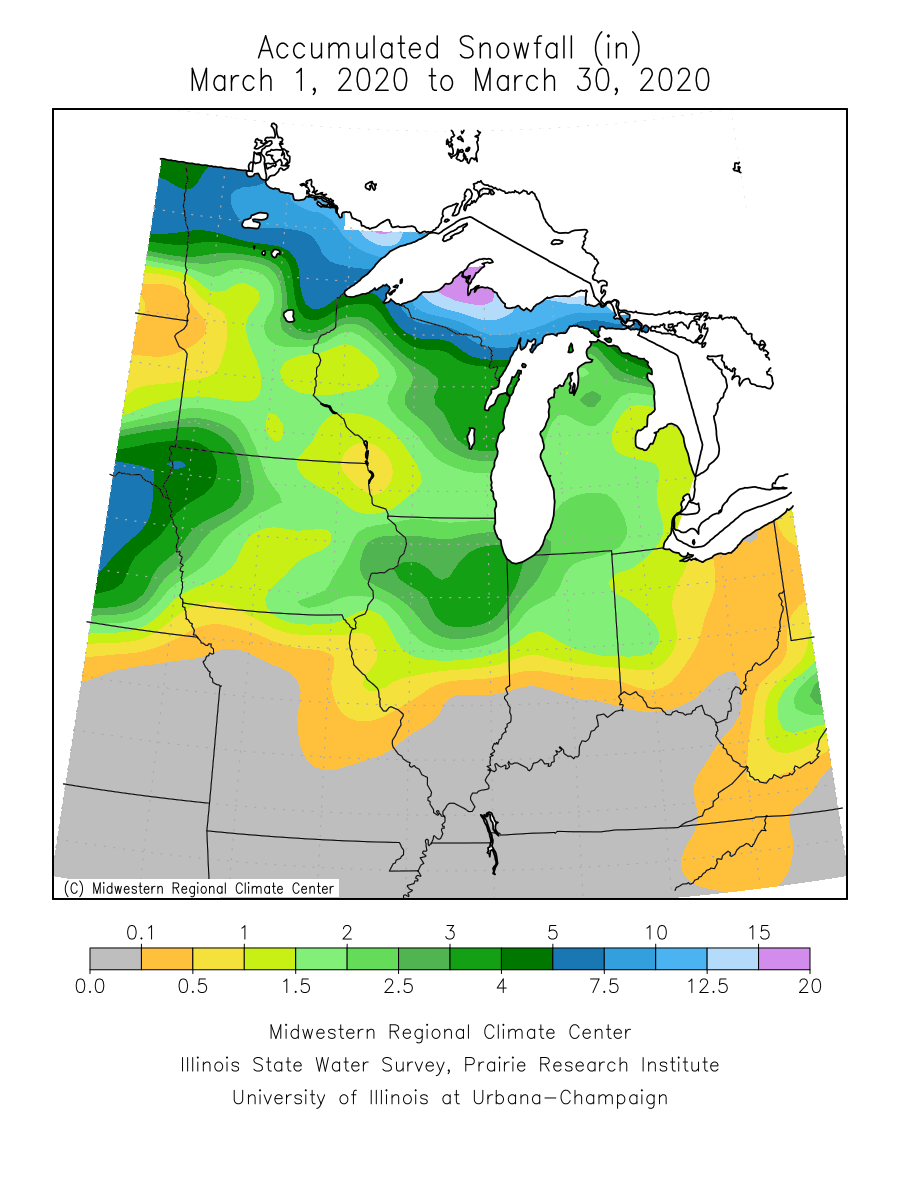
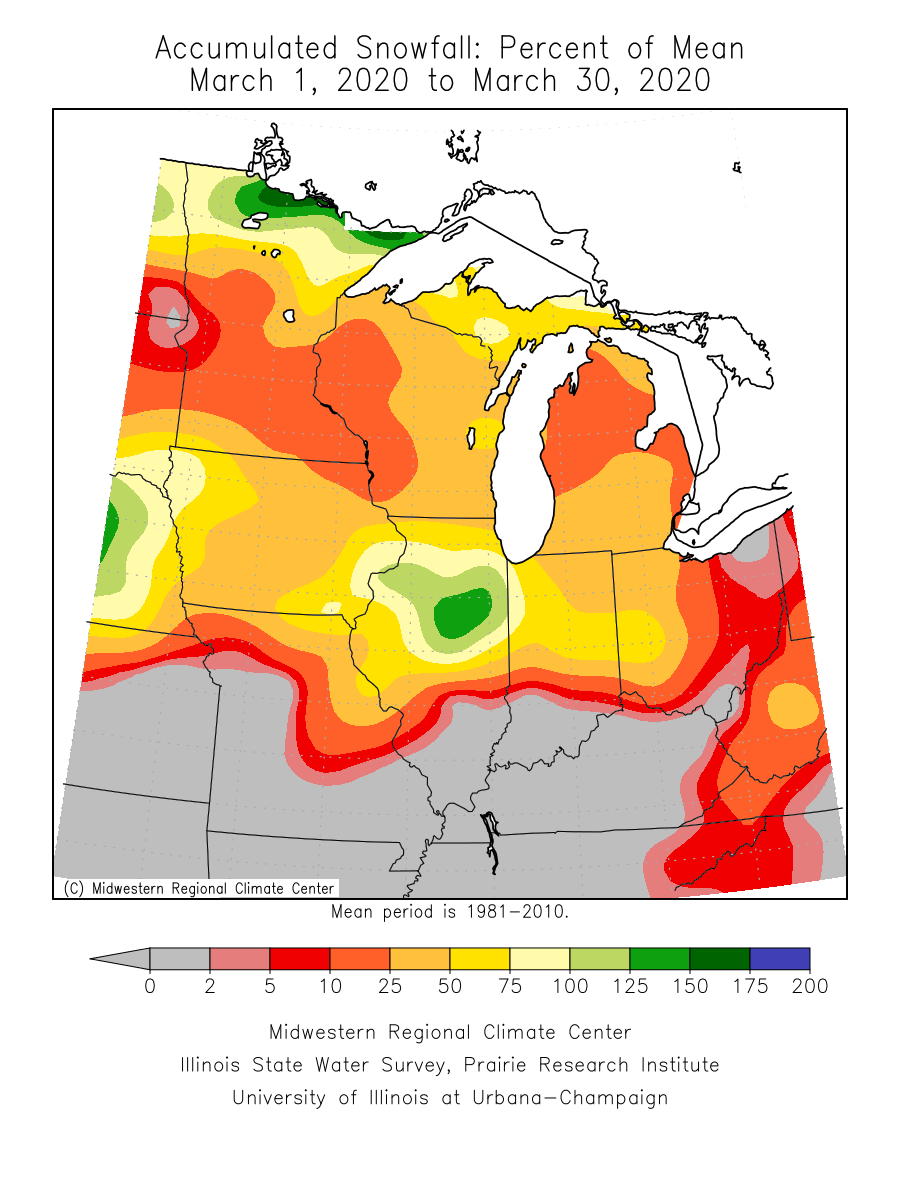
| Snowfall totals for March 2020 were near to 5 inches below normal. | |||||||||||||||||||||||||||||||||||||||||||||||||||||||||||||||||||||||||||
| Please see Mar Records for monthly record information. | |||||||||||||||||||||||||||||||||||||||||||||||||||||||||||||||||||||||||||
| The climate maps below are courtesy of the Midwest Regional Climate Center. | |||||||||||||||||||||||||||||||||||||||||||||||||||||||||||||||||||||||||||
| These maps become available around 10am on the first of the month. | |||||||||||||||||||||||||||||||||||||||||||||||||||||||||||||||||||||||||||
|
|||||||||||||||||||||||||||||||||||||||||||||||||||||||||||||||||||||||||||
| A LOOK AHEAD | |||||||||||||||||||||||||||||||||||||||||||||||||||||||||||||||||||||||||||
|
|||||||||||||||||||||||||||||||||||||||||||||||||||||||||||||||||||||||||||