| Climate/Almanac Data - May Normals - May Records |
| |
| May |
| |
|
Site
(Click site name for report)
|
Avg
Temp |
Normal
1991-2020 |
Dept
From
Norm |
Precip
Total |
Normal
​1991-2020 |
Dept
From
Norm |
| Burlington |
64.7° |
63.0° |
+1.7° |
2.97" |
4.93" |
-1.96" |
| Cedar Rapids |
63.4° |
60.3° |
+3.1° |
2.29" |
4.25" |
-1.96" |
| Davenport |
64.9° |
61.7° |
+3.2° |
2.42" |
4.82" |
-2.40" |
| Dubuque |
61.8° |
58.8° |
+3.0° |
2.19" |
4.30" |
-2.11" |
| Iowa City |
64.8° |
62.6° |
+2.2° |
2.57" |
4.48" |
-1.91" |
| Moline |
65.7° |
62.5° |
+3.2° |
1.38" |
4.67" |
-3.29" |
The ranking is listed in parentheses (__) when within the "Top 10".
|
| |
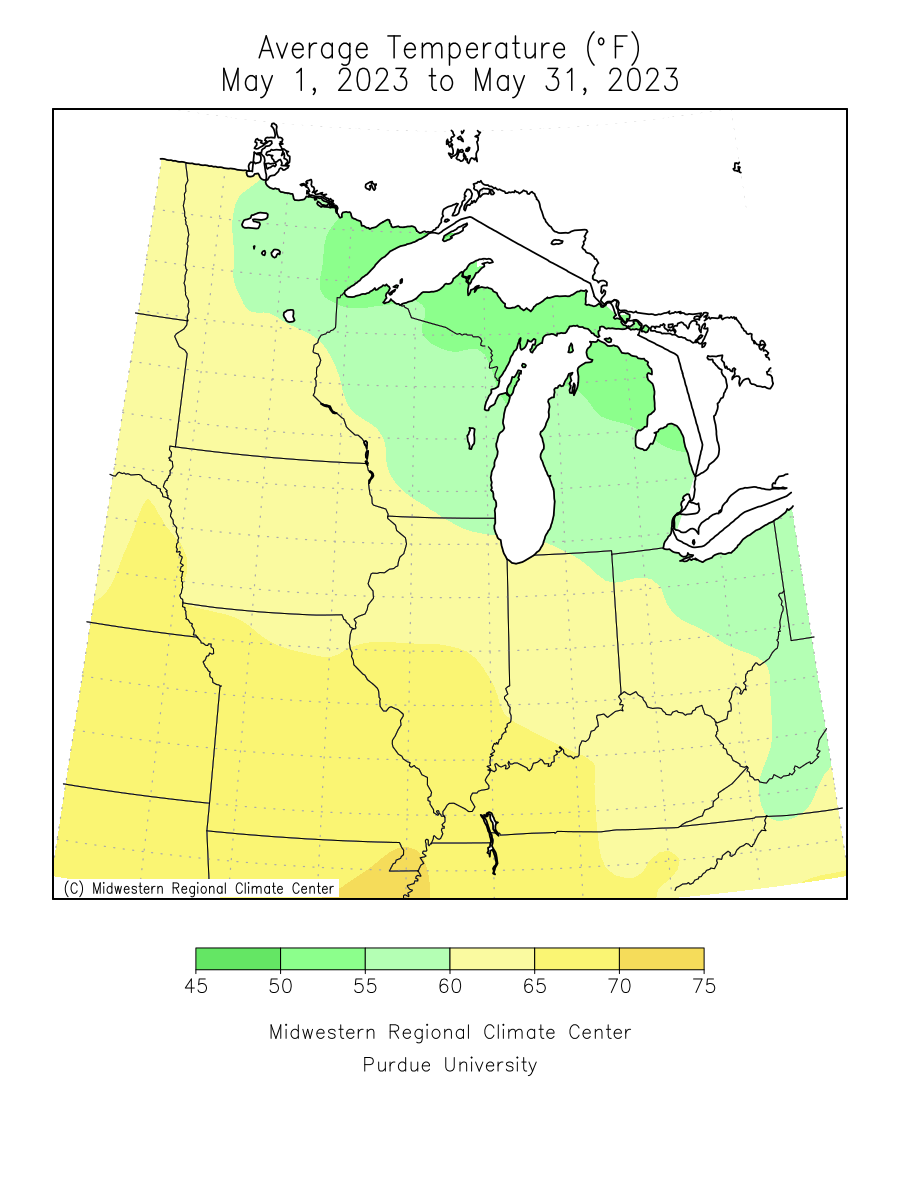
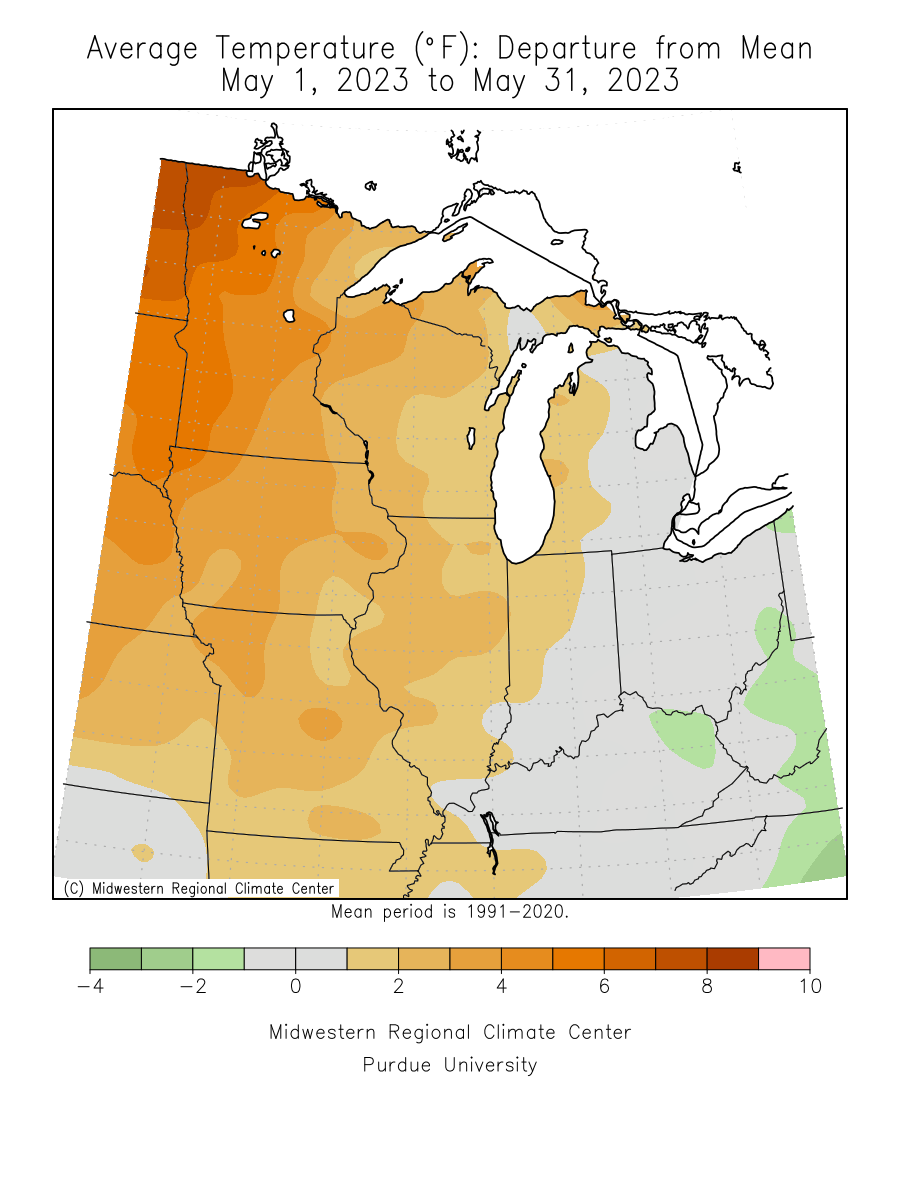
| May 2023 was about 2 to 3 degrees above normal. |
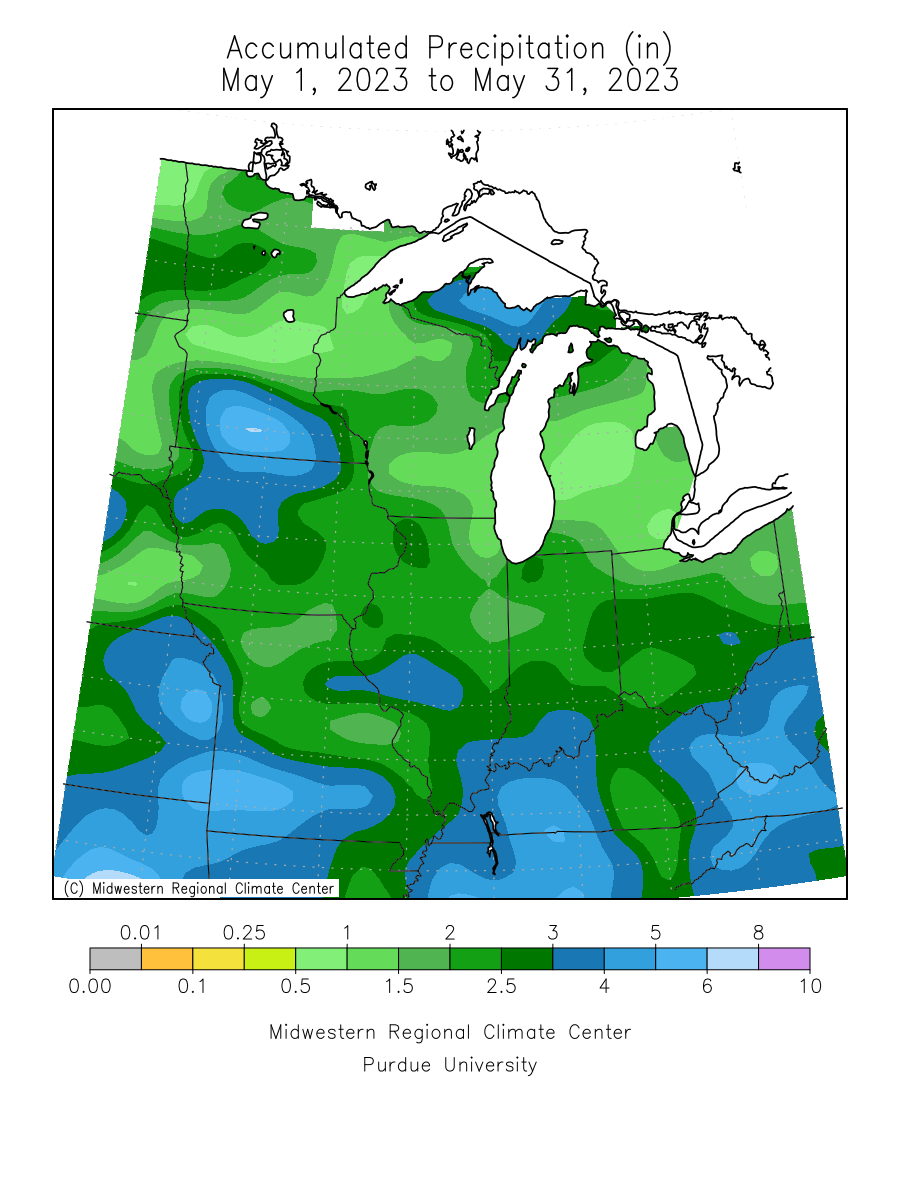
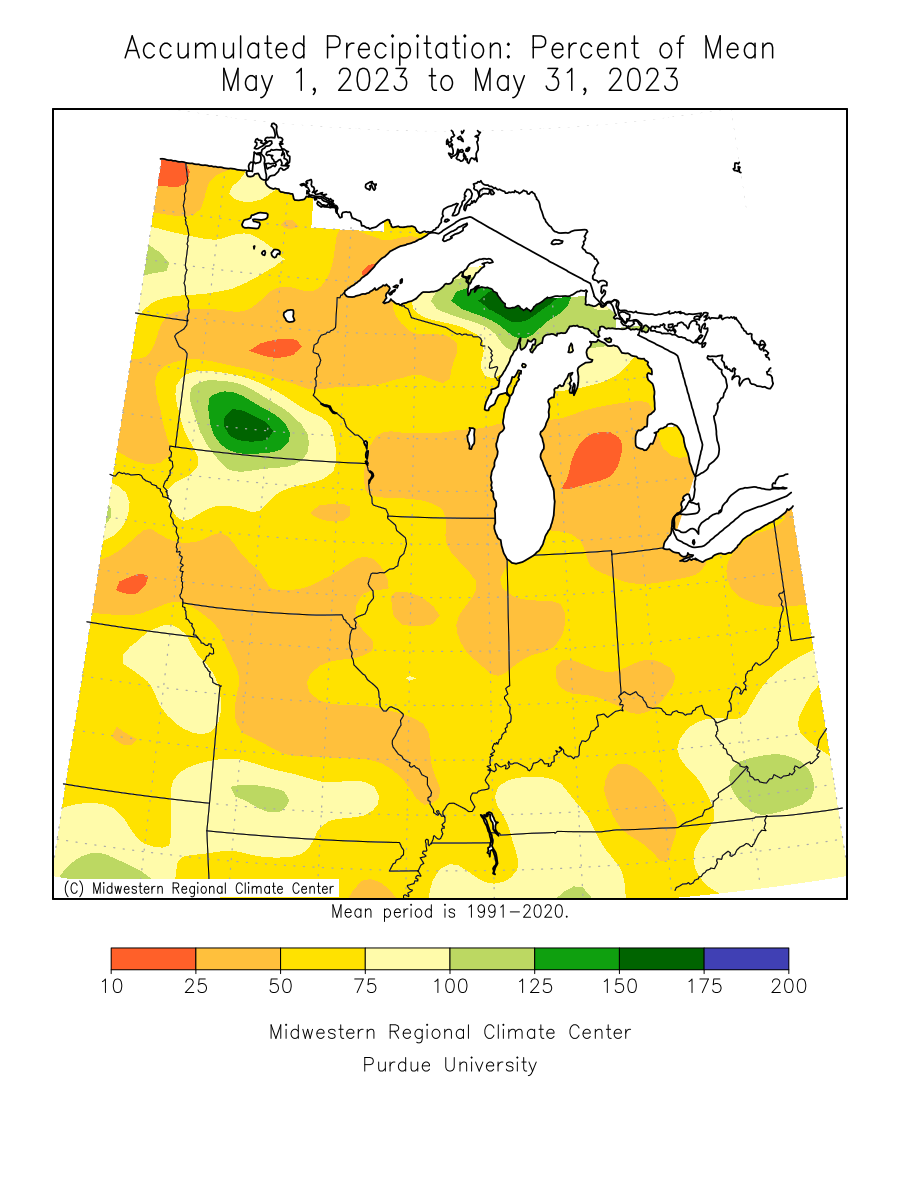
| Precipitation totals were about 2 to 3 inches below normal. |
| Please see May Records for monthly record information. |
| |
| |
| The climate maps below are courtesy of the Midwest Regional Climate Center. |
| Some of these maps become available during the afternoon on the first of the month. |
| |
Average
Temperature |
Average
Temperature
Departure from Mean |
Accumulated
Precipitation |
Accumulated
Precipitation
Percent of Mean |
 |
 |
 |
 |
|
| |
| |
| |
| |
| Climate/Almanac Data - Spring Normals - Spring Records |
| |
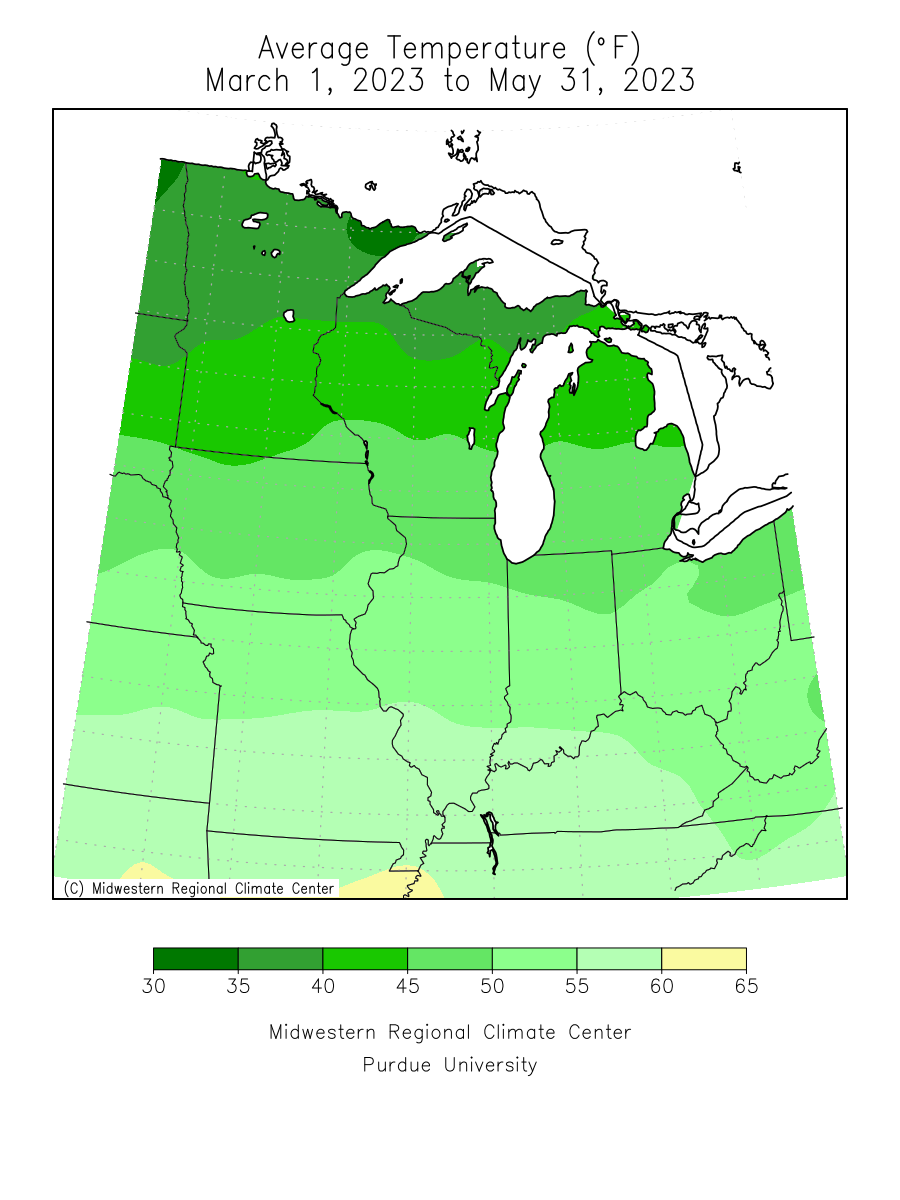
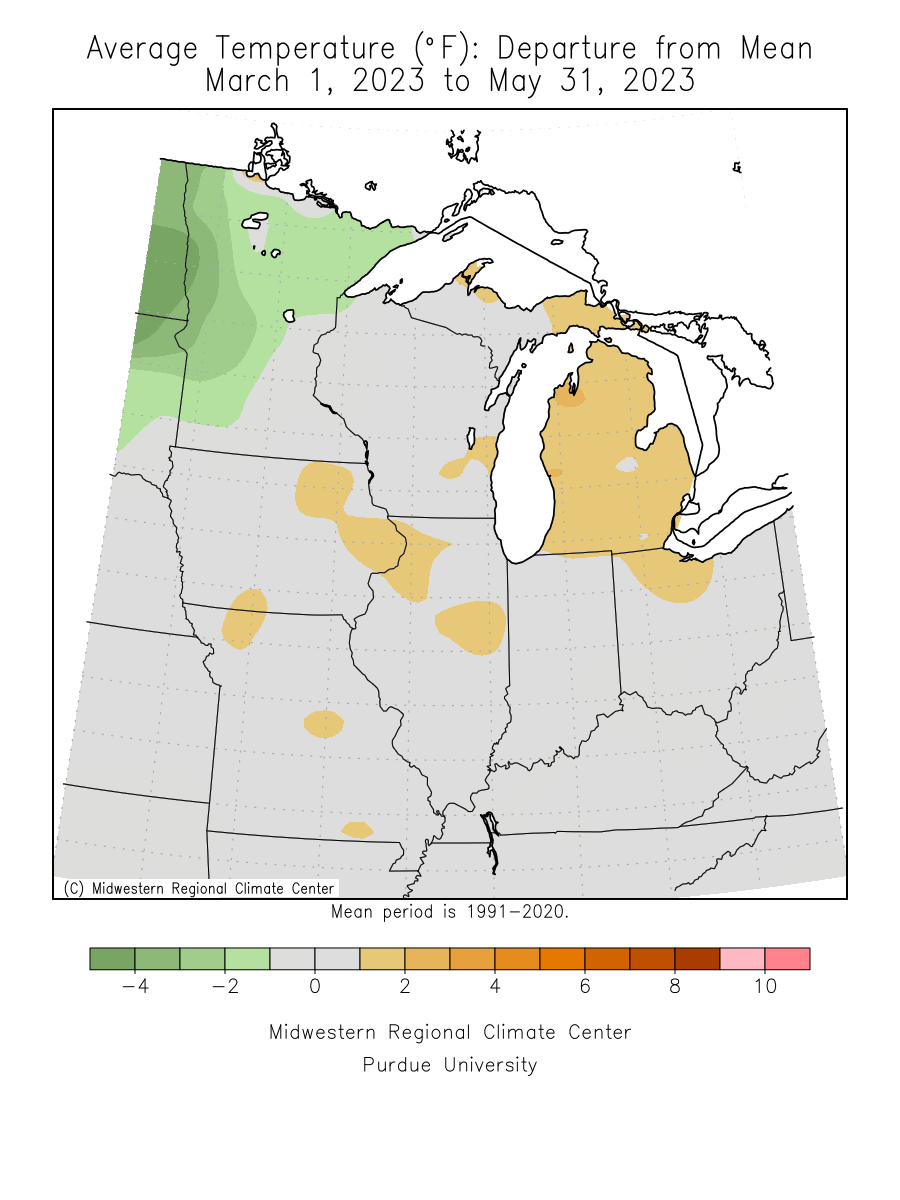
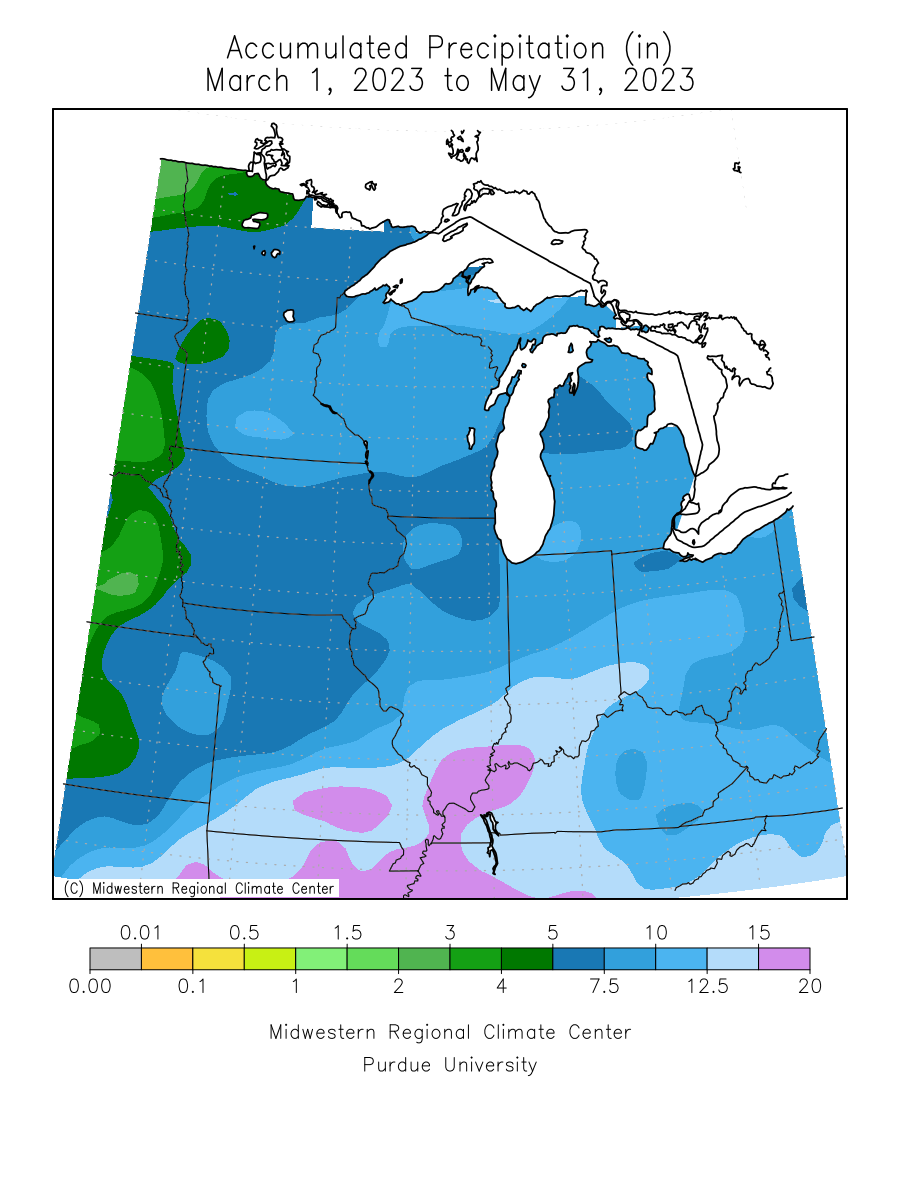
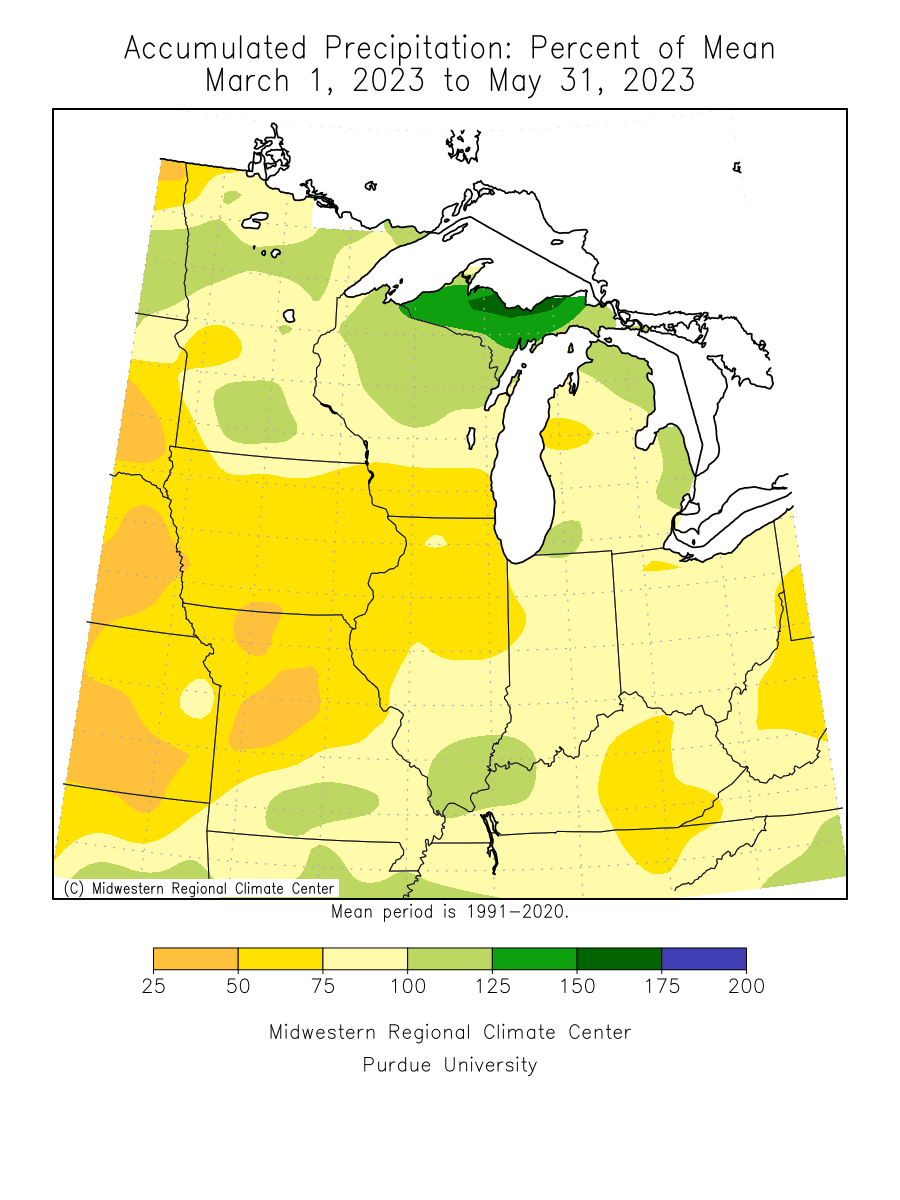
Spring
(Mar-May) |
| |
| |
| |
|
Site
(Click site name for report courtesy of the
Iowa Environmental Mesonet.)
|
Avg
Temp |
Normal
​1991-2020 |
Dept
From
Norm |
Precip
Total |
Normal
​1991-2020 |
Dept
From
Norm |
Snowfall
Total |
Normal
​1991-2020 |
Dept
From
Norm |
| Burlington |
52.2° |
52.0° |
+0.2° |
7.17" |
11.28" |
-4.11" |
NA |
NA |
NA |
| Cedar Rapids |
49.7° |
48.6° |
+1.1° |
4.32" |
9.80" |
-5.48" |
NA |
NA |
NA |
| Davenport |
51.5° |
50.2° |
+1.3° |
6.64" |
10.77" |
-4.13" |
13.8" |
NA |
NA |
| Dubuque |
48.2° |
47.2° |
+1.0° |
5.98" |
10.61" |
-4.63" |
15.0" |
7.6" |
+7.4" |
| Iowa City |
51.3° |
51.1° |
+0.2° |
5.63" |
10.45" |
-4.82" |
NA |
NA |
NA |
| Moline |
53.0° |
51.2° |
+1.8° |
5.22" |
11.10" |
-5.88" |
10.5" |
5.5" |
+5.0" |
|
|
The ranking is listed in parentheses (__) when within the "Top 10".
|
| |
| Spring 2023 was about normal to 2 degrees above normal. |
| Precipitation totals were about 4 to 6 inches below normal! |
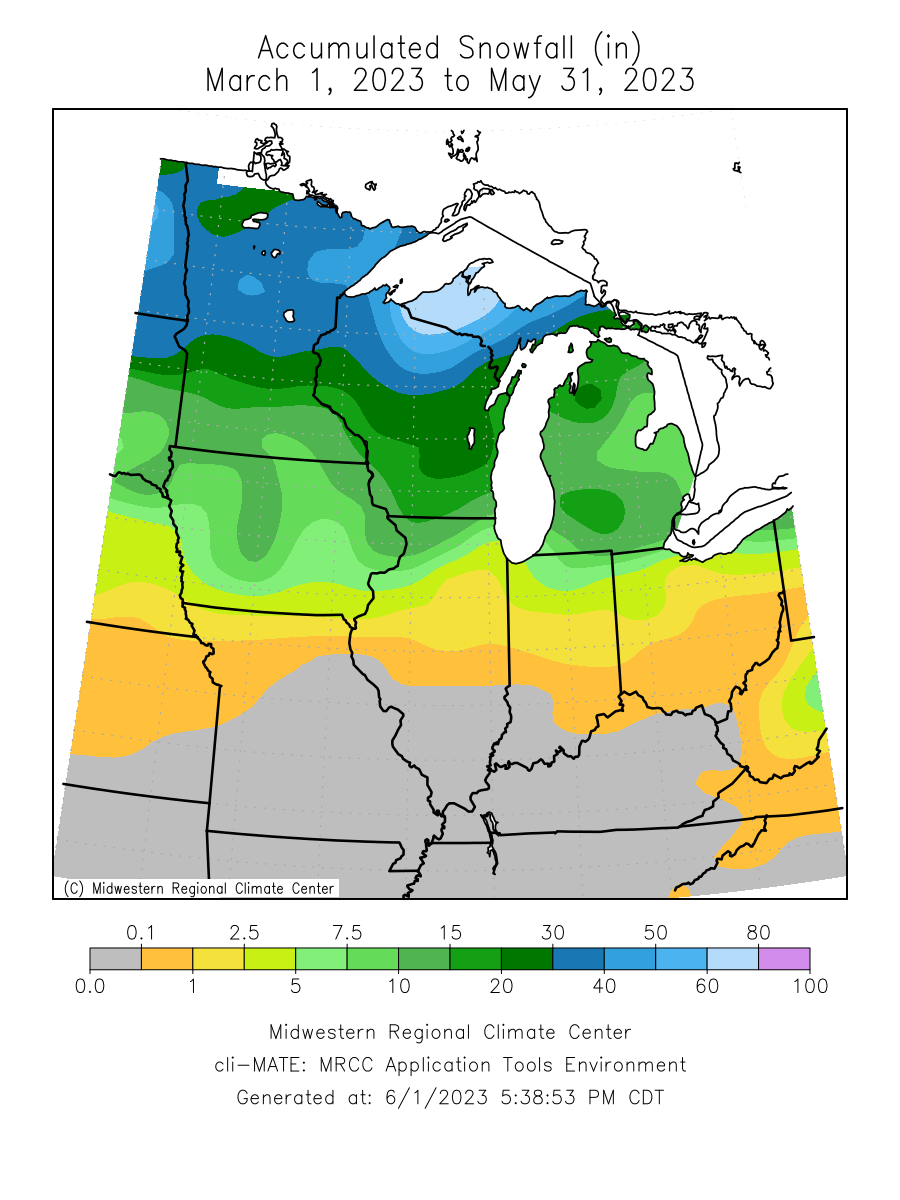
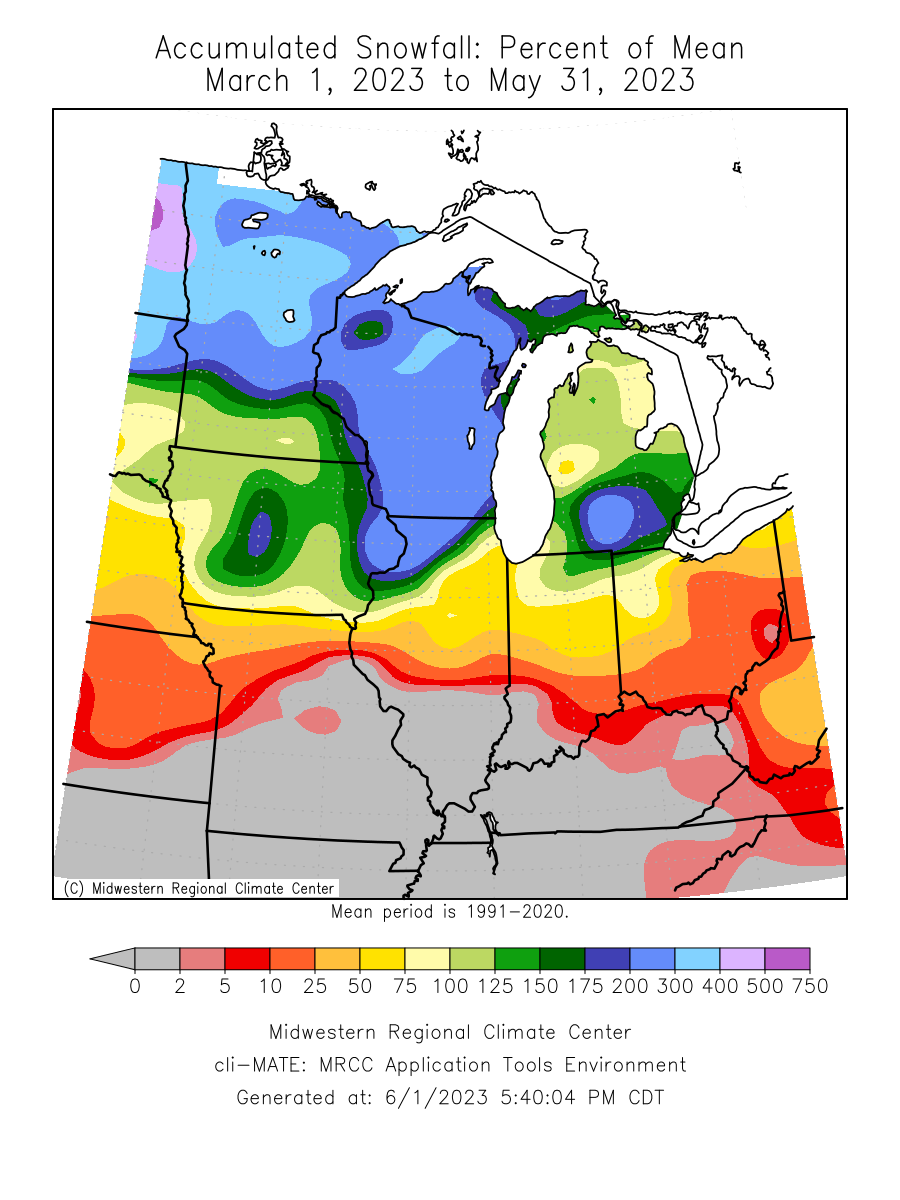
| Snowfall totals were about 5 to 7 inches above normal. |
| Please see Spring Records for seasonal record information. |
| |
| |
| The climate maps below are courtesy of the Midwest Regional Climate Center. |
| Some of these maps become available during the afternoon on the first of the month. |
| |
Average
Temperature |
Average
Temperature
Departure from Mean |
Accumulated
Precipitation |
Accumulated
Precipitation
Percent of Mean |
Accumulated
Snowfall |
Accumulated
Snowfall
Percent of Mean |
 |
 |
 |
 |
 |
 |
|
| |
| |
| |
| A LOOK AHEAD |
| |
| Climate Prediction Center |
| |
June
Temperature Outlook |
June
Precipitation Outlook |
June - August
Temperature Outlook |
June - August
Precipitation Outlook |
 |
 |
 |
 |
|
| |
| |
| |
| |
| |
|
|

