February 19-21, 2018
A slow-moving frontal boundary brought very heavy rainfall to central Illinois from Monday, February 19th through Tuesday, February 20th. Many locations east of I-55 and north of I-70 picked up 3 to 5 inches of rain...with locally higher amounts in excess of 6 inches. The heavy rain occurring on top of the frozen ground led to significant run-off and widespread flooding along area creeks and streams.
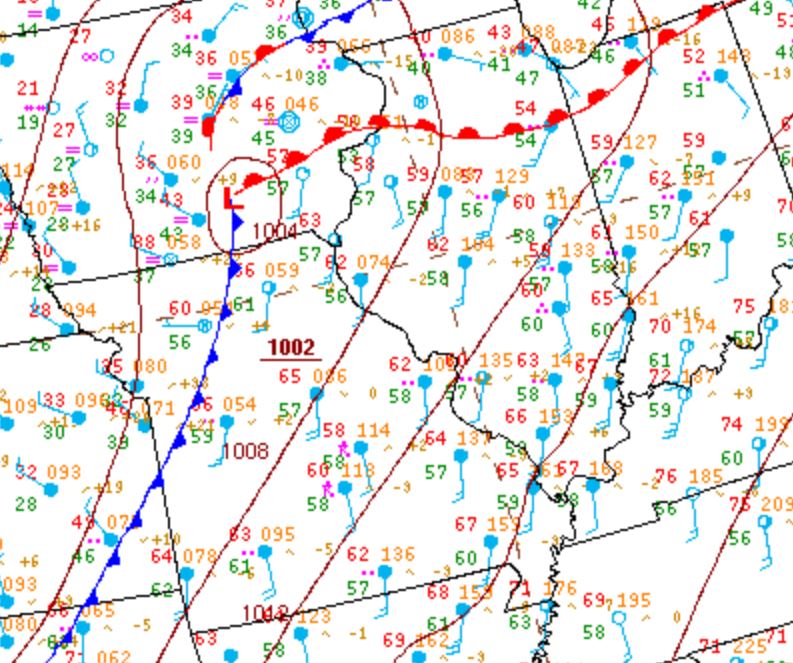
After a stretch of cold weather the prior week, the upper air pattern made a dramatic shift to a much more spring-like scenario by February 19th...with deep-layer southwesterly flow noted across the Midwest and Ohio River Valley. As upper heights rose, a warm front surged northward to the Illinois-Wisconsin border and unseasonably warm conditions flowed into central Illinois on brisk southerly winds. High temperatures climbed well into the 60s across the entire area on the 19th, then reached the 70s across parts of east-central and southeast Illinois on the 20th. In fact, the high temperature at the Lawrenceville Airport soared to an impressive 78 degrees on Tuesday, February 20th. The surface weather map from the afternoon of the 19th showed the warm front well to the north and a trailing cold front west of the Mississippi River...with central Illinois enjoying a preview of spring.
SURFACE WEATHER MAP 12PM MONDAY, FEB 19
As temperatures climbed, surface dewpoints did as well...with readings reaching the upper 50s and lower 60s by the afternoon of the 19th. Thanks to southwesterly flow at all levels of the atmosphere, copious amounts of moisture were transported into the region from the western Gulf of America. The upper air sounding conducted by National Weather Service Lincoln during the evening of February 19th revealed a near record precipitable water value for the date of 1.34. Precipitable water is a measure of the total moisture content within the entire atmospheric column and is one of the key indicators forecasters use to assess heavy rainfall potential. Note how the temperature trace(red) and dewpoint trace(green) in the image below are very close to one another. This shows us that the atmosphere is nearly saturated from the surface up to about an altitude of 12km.
NWS LINCOLN UPPER AIR SOUNDING 6PM MONDAY, FEB 19
.jpg)
With the atmosphere loaded with moisture and a slow-moving cold front approaching from the west, the Weather Prediction Center (WPC) issued an Excessive Rainfall Outlook during the early morning hours of February 20th that included a Moderate Risk for exceeding flash flood guidance across east-central and northeast Illinois.
WPC EXCESSIVE RAINFALL GRAPHIC ISSUED 2:26 AM TUESDAY, FEBRUARY 20
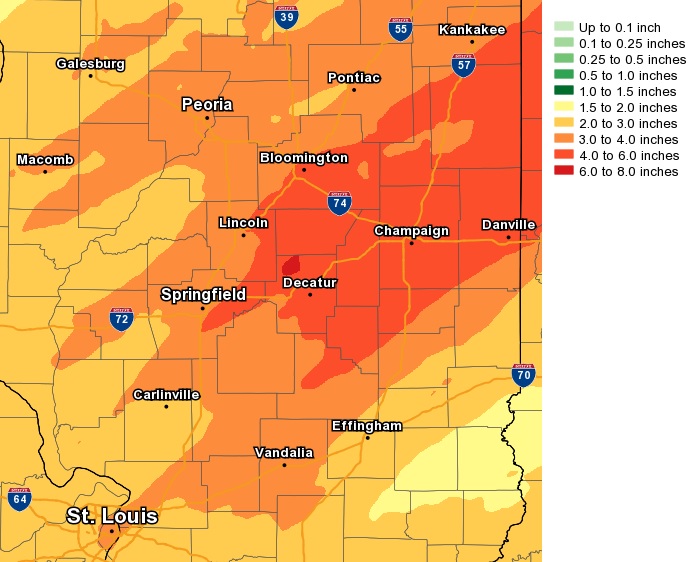
As the cold front slowly pushed eastward, several waves of showers and thunderstorms developed...with efficient precipitation processes leading to excessive rainfall rates. With the heavy rain falling on frozen ground, ample run-off quickly led to ponding of water and flash flooding in some locations. Due to Doppler radar rainfall estimates, reports from SWOP observers and local emergency managers, and the expectation of continued rains...NWS Lincoln issued a Flash Flood Warning for a large portion of east-central Illinois along and northeast of a Clinton to Tuscola line at 7:16PM February 20th. Numerous creeks and streams exceeded their banks and several roads had water flowing across them in this area. The rain eventually shifted further south and east and tapered off during the afternoon of Wednesday, February 21st. The map below shows rainfall totals across central Illinois from Sunday, February 18th through Wednesday, February 21st. Nearly the entire area received in excess of 2 inches of rain...with the heaviest amounts of 3-5 inches occurring along and northeast of a Lincoln...to Decatur...to Shelbyville line. The highest total observed within the SWOP network was a whopping 6.76 in Ogden in Champaign County.
FEBRUARY 18-21, 2018 RAINFALL MAP
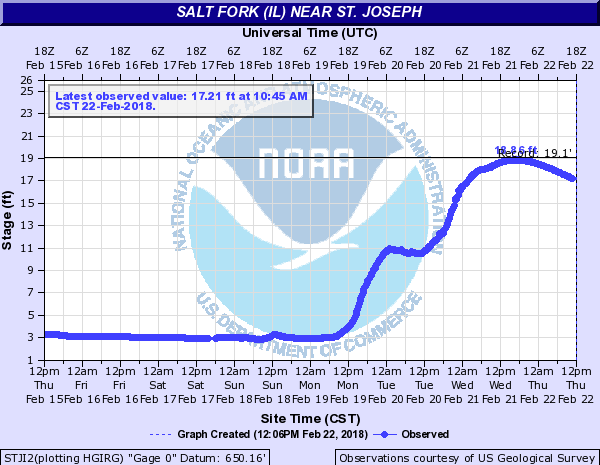
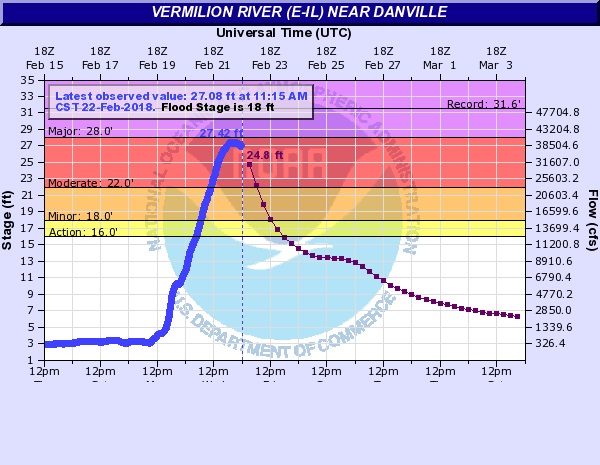
Continued run-off from the heavy rainfall resulted in impressive rises on many area creeks and streams. A river gauge along Salt Fork near St. Jospeh in Champaign County rose from 2.97ft on the morning of the 19th to 18.86ft by the evening of the 21st. Similarly the gauge along the Vermilion River near Danville rocketed up 24ft from a stage of 3.08ft on the morning of the 19th to 27.42ft by the morning of the 22nd. These stages represent the 3rd highest crest on record for both sites. Below are hydrographs showing the river rises at St. Joseph and Danville respectively.
RIVER CRESTS
 |
 |

