February 24th - 25th 2016
Snowstorm |
A vigorous disturbance embedded with the subtropical branch of the jet stream lifted out of Texas early on the 23rd and phased with a northern stream disturbance crossing the northern plains. This system intensified rapidly, eventually closing off across southern Indiana on the 24th. A pronounced deep moisture surge out of the Gulf of Mexico combined with just enough cold air in place at the surface, resulted in a signficant winter storm for portions of the Great Lakes. While heavy snow fell over eastern Illinois northeastward across northern Indiana and much of lower Michgan, enough warm air wrapped into the intensifying cyclone to change the precipitation over to rain across east central Indiana and western Ohio.
As the system lifted out into southeast Canada the night of the 24th, residual moisture combined with renewed cold air crossing Lake Michigan resulted in considerable lake enhanced snowfall over northern Indiana and southwest Michigan. Most locations here received between 6" and 12" of snow with pockets of heavier snow noted over northern La Porte, Porter and Lake counties with 17.8" measured at the La Porte COOP station.
Below is a map of general snowfall reports across the area.
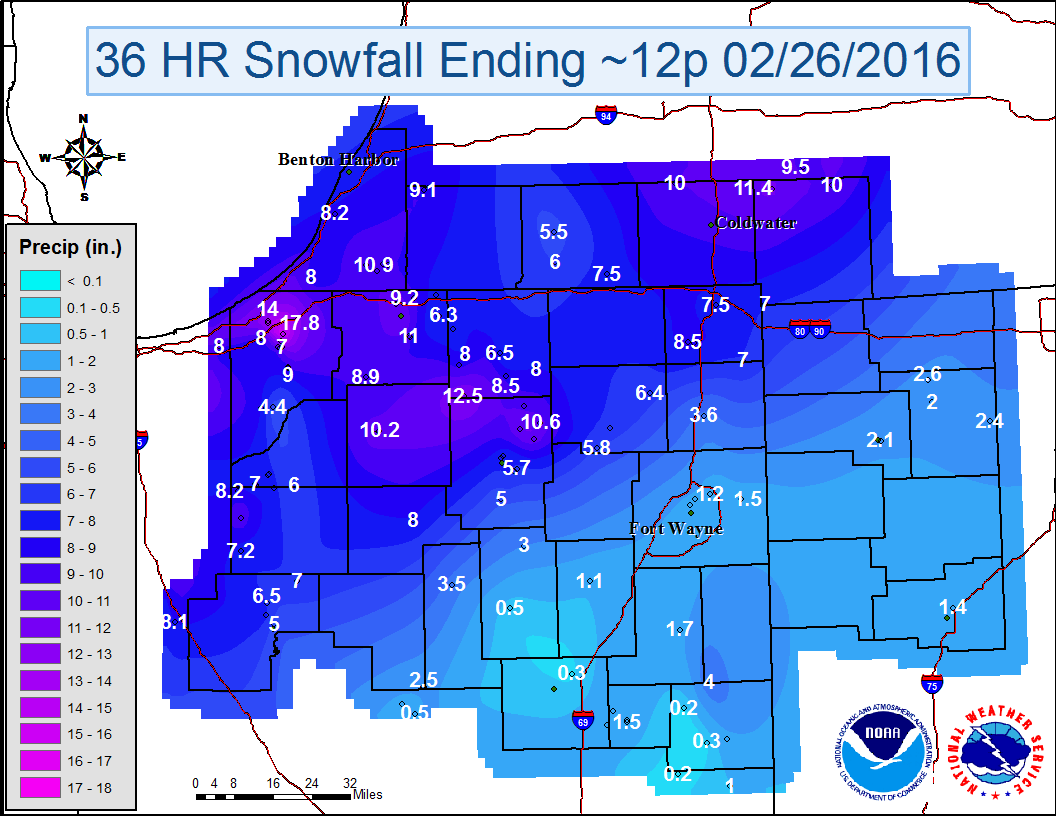
Click here for Snowfall Reports
LOCATION                                STORM TOTAL
                                        SNOWFALL
                                        /INCHES/

1 WNW La Porte                          17.8
2 N Laporte                             17.0
(N9ROM)Trail Creek 4.5 ESE              15.0
Lakes Of The Four Seasons 1.5 NNE       15.0
Trail Creek 4.5 ESE                     14.0
Portage 2.8 E                           14.0
Valparaiso 5.7 WSW                      13.0
Valparaiso 1.8 NW                       12.8
1 WSW Nappanee                          12.5
Valparaiso 2.0 WSW                      12.0
Valparaiso 0.6 SE                       11.5
1 NW Tippecanoe Lake                    11.5
Leesburg 6.7 ESE                        11.4
Litchfield 0.3 ENE                      11.4
South Bend 4.5 SE                       11.0
Jackson 3.2 W                           11.0
South Bend Airport                      10.9
Plymouth 2.5 WSW                        10.8
North Webster 2.3 N                     10.6
Rensselaer 1.9 SSW                      10.5
Hebron 3.7 NE                           10.5
Medaryville                             10.4
1 WSW Plymouth                          10.2
De Motte 0.8 NNW                        10.0
De Motte 1.2 SSW                        10.0
Buchanan 1.3 WNW                        10.0
Plymouth 5.4 W                          10.0
3 ENE Buchanan                          10.0
Union City                              10.0
Moscow                                  10.0
Dorr 0.4 E                               9.8
Ann Arbor 2.1 WNW                        9.8
Syracuse 0.9 SW                          9.5
Hanover 3.8 W                            9.5
Granger 2.9 W                            9.2
Goshen 3 W                               9.1
Goshen 3.0 WSW                           9.1
Hopkins 2.0 N                            9.1
Buchanan 1.4 ESE                         9.1
Dowagiaac 5.3 NNW                        9.1
1 NW Kingsbury                           9.0
(KA9WNQ)La Porte 1.7 SW                  9.0
La Porte 1.6 SW                          9.0
Kingsbury 0.3 WNW                        9.0
Niles 2.7 W                              9.0
Walkerton 5.7 ENE                        8.9
Rives Junction 4.0 NW                    8.8
Wanatah 4.4 ESE                          8.6
Golden Lake 1 SW                         8.5
Warsaw 2.9 SE                            8.5
South Bend 4.6 SE                        8.5
Hudson 4.1 NNW                           8.5
New Paris                                8.5
1 WSW Indiana Beach                      8.5
Wakarusa 0.3 WSW                         8.3
Medaryville 5 N                          8.2
Stevensville 1.7 SSE                     8.2
Remington 0.3 N                          8.1
Rochester                                8.0
Millersburg 0.5 SW                       8.0
Wakarusa 2.4 NNE                         8.0
Portage 0.9 ESE                          8.0
Chesterton 4.2 E                         8.0
Three Oaks                               8.0
Metz                                     8.0
North Judson 0.7 SSW                     7.5
Granger 1.8 ENE                          7.5
Angola 4.1 N                             7.5
(KE9ML)North Judson 0.7 SSW              7.5
Allendale 1.3 SSW                        7.5
Sturgis                                  7.5
Warsaw 1.1 NNW                           7.4
North Judson 3 S                         7.3
Elkhart 4.8 SW                           7.3
Francesville                             7.2
North Judson 3.9 SW                      7.0
(W9OPR)Wheatfield 1.4 ENE                7.0
(WA9RON)La Porte 1.3 SSW                 7.0
Hamilton 1.7 E                           7.0
(KB9GPW)North Judson 3.9 SW              7.0
Burnettsville 9.9 NNW                    7.0
Paw Paw 3.6 NNE                          7.0
Fremont 3 SW                             7.0
Albion 3.7 S                             6.8
Warsaw 1.4 N                             6.7
Ann Arbor 3.1 SE                         6.7
Goshen 1.2 SW                            6.5
Monticello 5.5 NNW                       6.5
Chelsea 2.4 WNW                          6.5
De Motte 4.1 SW                          6.4
Kendalville                              6.4
Mishawaka 3.9 ENE                        6.3
North Judson 5.7 ESE                     6.0
Lafayette 2.2 NE                         6.0
Constantine 1.9 E                        6.0
Columbia City 8.4 N                      5.8
Winona Lake 1.1 E                        5.7
Three Rivers 1 S                         5.5
Lafayette 2.2 S                          5.2
(N9VZS)Kokomo 2.5 S                      5.0
Claypool 1.2 E                           5.0
Monticello 1.0 NNE                       5.0
Perrysburg 1.6 WSW                       5.0
West Lafayette 5.1 WSW                   4.5
Hanna 1.1 E                              4.4
Adrian 5.2 NE                            4.2
Waterville 2.4 NNE                       4.0
Young America                            4.0
Toledo 2.2 WSW                           3.7
Auburn 0.8 NE                            3.6
Denver 1.3 NE                            3.5
Holland 4.3 NNW                          3.5
North Manchester WWTP                    3.0
Napoleon 4.5 NNW                         2.6
(WA9TTB)Galveston 1.0 ESE                2.5
Atlanta 4.4 W                            2.5
(K9WKK)Tipton 1.3 NW                     2.5
Fremont 2.2 ENE                          2.5
Bowling Green 2.7 NW                     2.5
Galveston 1.0 ESE                        2.5
McClure 3.4 SSE                          2.4
Newport 3.1 SE                           2.3
Port Clinton 2.5 W                       2.3
Fort Wayne 4.1 NE                        2.1
Frankfort 4.9 NNE                        2.1
Defiance 0.9 E                           2.1
Anderson 2.2 NNE                         2.0
(KC9ZPE) Modoc 0.1 NNW                   2.0
Napoleon 0.6 WSW                         2.0
(KC9QCJ) Shamrock Lakes 3.0 NNW          1.9
Hartford City 4.8 NW                     1.8
Anderson 2.0 S                           1.8
Portland 2.3 S                           1.7
Bluffton 0.9 SE                          1.7
Bradford 2.3 NW                          1.6
Woodburn 2.8 WSW                         1.5
Fort Wayne 2.6 NE                        1.5
(KA9VIS) Hartford City 0.7 N             1.5
Hartford City 0.2 NNW (WB9HLA)           1.5
Kokomo 7.2 WNW                           1.5
Kokomo 4.3 SW                            1.5
Arlington 0.4 SW                         1.5
Raymond 3.5 NW                           1.5
Fort Wayne Airport                       1.4
Lima 2.7 NE                              1.4
Fort Wayne 7.0 NE                        1.2
Huntington 0.3 W                         1.1
Pitsburg 1.4 ENE                         1.1
(WB9USA) Yorktown 1.1 NNE                1.0
(KC9DHF)Kokomo 4.4 E                     1.0
(K9UZZ) Saratoga 3.4 WNW                 1.0
(KC9FXU) Winchester 2.2 WSW              1.0
Put-In-Bay 1.1 SSW                       1.0
Fort Loramie 0.8 NNW                     0.9
Potsdam 2.6 WSW                          0.8
Houston 1.3 NNE                          0.8
Galloway 3.1 N                           0.7
Harrisburg 3.7 WNW                       0.6
Muncie 1.2 SE                            0.5
(KC9TLC) Muncie 0.6 W                    0.5
(KC9IYD)Kokomo 4.0 WNW                   0.5
(K9EKP) Parker City 0.3 NE               0.5
Wabash 0.3 NNW                           0.5
Versailles 1.6 WSW                       0.5
Marion 4.2 SSE                           0.5
Marion 5.6 NE                            0.3
(KC9LQY) Portland 5.4 SW                 0.3
Pennville 0.2 NW                         0.2
(KB9ZZG) Albany 2.9 E                    0.2
(NQ8E) Muncie 0.6 NE                     0.0
(KC9ZUA) Muncie 2.5 W                    0.0

OBSERVATIONS ARE COLLECTED FROM A VARIETY OF SOURCES WITH VARYING
EQUIPMENT AND EXPOSURE. NOT ALL DATA LISTED ARE CONSIDERED OFFICIAL.
Click here for Peak Wind Gusts
NOUS43 KIWX 252016
PNSIWX
INZ003>009-012>018-020-022>027-032>034-MIZ077>081-OHZ001-002-004-005-015-
016-024-025-260816-
PUBLIC INFORMATION STATEMENT
NATIONAL WEATHER SERVICE NORTHERN INDIANA
316 PM EST THU FEB 25 2016
...MAXIMUM WIND REPORTS PAST 36 HOURS...
LOCATION SPEED TIME/DATE LAT/LON
...MARINE REPORTING STATIONS...
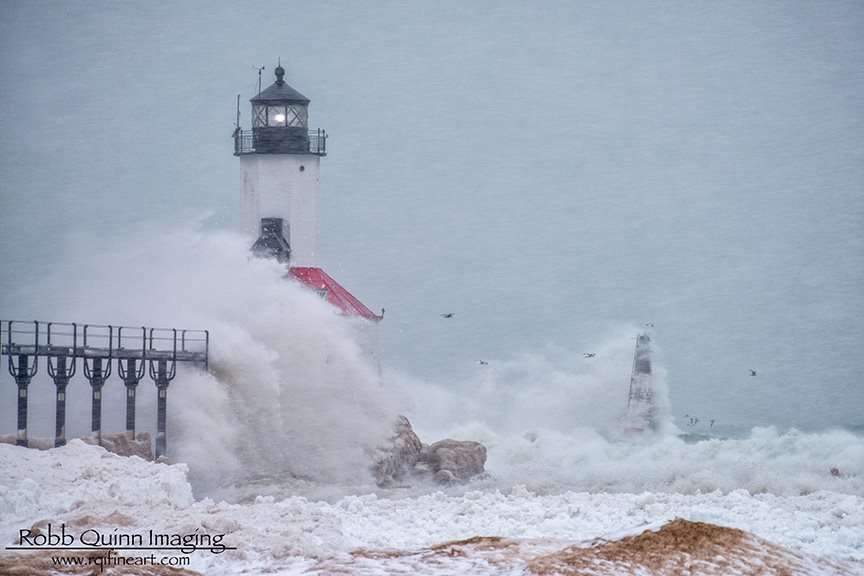
2 WNW MICHIGAN CITY 58 MPH 0506 PM 02/24 41.73N/86.91W
...INDIANA...
...DE KALB COUNTY...
3 E SAINT JOHNS 35 MPH 1255 PM 02/25 41.31N/85.06W
...ELKHART COUNTY...
GOSHEN MUNICIPAL AIRPORT 38 MPH 0151 PM 02/25 41.53N/85.79W
ELKHART MUNICIPAL AIRPORT 37 MPH 0150 PM 02/25 41.72N/86.00W
...HUNTINGTON COUNTY...
3 SSW HUNTINGTON 35 MPH 0229 PM 02/25 40.83N/85.53W
...LA PORTE COUNTY...
LA PORTE 44 MPH 0315 PM 02/24 41.57N/86.73W
...MIAMI COUNTY...
1 SSW GRISSOM AFB 37 MPH 1144 PM 02/24 40.65N/86.15W
...ST. JOSEPH COUNTY...
SOUTH BEND INTERNATIONAL AIR 40 MPH 0723 AM 02/25 41.71N/86.32W
...STARKE COUNTY...
2 ESE BREMS 39 MPH 0535 PM 02/24 41.33N/86.66W
...WHITE COUNTY...
WHITE CNTY AP 35 MPH 0115 AM 02/25 40.71N/86.77W
...MICHIGAN...
...ST. JOSEPH COUNTY...
STURGIS 36 MPH 0815 PM 02/24 41.81N/85.44W
...BERRIEN COUNTY...
SAINT JOSEPH 43 MPH 0600 PM 02/24 42.10N/86.49W
COLOMA 40 MPH 1200 AM 02/25 42.20N/86.31W
SOUTHWEST MICHIGAN REGIONAL 37 MPH 0546 PM 02/24 42.13N/86.43W
COLOMA 40 MPH 1200 AM 02/25 42.20N/86.31W
...CASS COUNTY...
1 WSW DIAMOND LAKE 38 MPH 1100 AM 02/25 41.90N/86.00W
OBSERVATIONS ARE COLLECTED FROM A VARIETY OF SOURCES WITH VARYING
EQUIPMENT AND EXPOSURE. NOT ALL DATA LISTED ARE CONSIDERED OFFICIAL.
$$
NWS NORTHERN INDIANA
IRIS SYSTEM
| Surface Analysis Loop from 7 pm Tuesday through 1 am Thursday |
 |
| This loop shows the track of the surface cyclone from northeast LA on the evening of Feb 23th to western NY by early morning Thursday. |
| Radar Loop from 330 am Wednesday through 927 am Thursday |
 |
| This loop shows how persistent the strong radar echoes (dark blues - moderate precipitation, purples - heavy precipitation) were across northwest and north central Indiana for a several hour period on Wednesday, from early morning well into the evening. Additional lake enhancement developed Wednesday night and continue through mid morning Thursday dropping several inches of additional snow. |
Regional Radar Loop and 700mb Frontogenesis
from 330 AM CST Wednesday through 1130 PM CST Wednesday |
 |
| A regional view of the radar evolution for a similar time period on Wednesday shows how this event evolved around a deepening low pressure center. This analysis shows what the low pressure system looked like approximately 9000' above the surface, which was an area of the atmosphere where there was strong support for snow production during this event. The purple contours on the north and west side of the low center align along the west edge of the persistent radar echoes. This is not surprising considering these purple contours show where forcing for upward motion and snowfall development was strongest at this level of the atmosphere. Within the axis of strongest forcing, the upward motion will be most favored toward the warmer side, which in this case was the eastern side of the contours. Courtesy WFO LOT |
Water Vapor Satellite Loop
from 615 PM CST Monday 2/22 through 945 AM CST Thursday 2/25 |
 |
| Here is an even wider view showing a multi-day evolution of this strong low pressure system across the eastern United States from the perspective of the GOES-East Satellite Water Vapor channel. In addition to bringing heavy snowfall and dangerous blizzard conditions to the Great Lakes, this very large storm system also was responsible for a significant severe weather outbreak on Tuesday along the Gulf Coast and on Wednesday along the Atlantic Coast. Courtesty WFO LOT |
Updated 2/27/2016 5:30 AM EST


 Follow us on YouTube