National Weather Service United States Department of Commerce
4th of July Weather for Northern Illinois:   Statistics for Chicago and Rockford


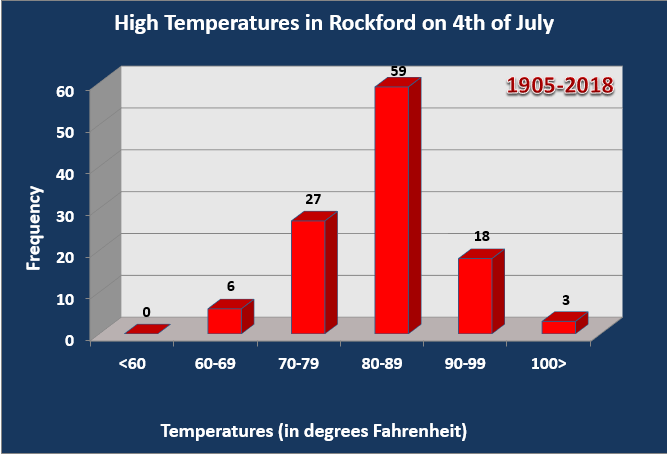
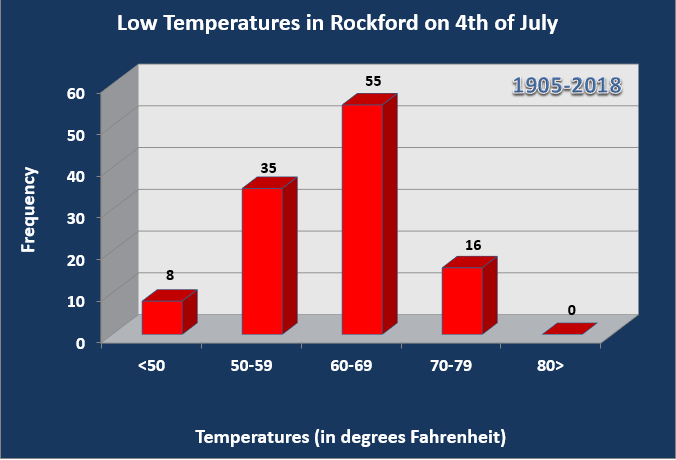
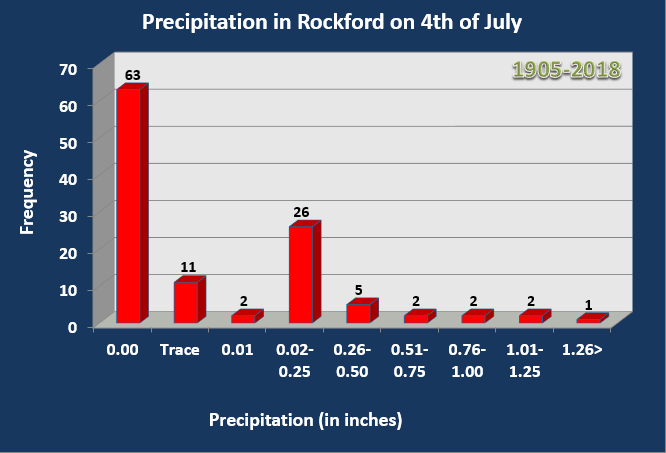
Rockford: 

The following statistics comprises 112 years of data. Data collection for Rockford was at the Greater Rockford Airport.


To see the daily climate data for Rockford for July 4th's from 1905 to present, click here.


High temperatures on July 4th at Rockford
Frequency distribution of high temperatures for Rockford. This dataset shows that the most frequent range of high temperatures on the 4th of July is in between 80 and 89 degrees, which is the warmest of all the holidays. The normal high for the 4th is 85 degrees, which falls in the range of the most frequent highs. The record high is 102 degrees set way back in 2012. This is one of three times that the high temperature got above 100 in on the 4th of July in Rockford’s history. The coldest high temperature on the 4th is 62 degrees which occurred in 1967. In 2016, the high temperature was 79 degrees.


Low temperatures on July 4th at Rockford
Frequency distribution of low temperatures for Rockford. This dataset shows that the most frequent range of low temperatures on the 4th of July is in between 60 and 69 degrees, which is the warmest of all the holidays. The normal low for the 4th is 63 degrees, which falls in the range of the most frequent lows. The record low is 46 which occurred in 1924 and 1967. The highest low temperature for the 4th was 77 degrees in 1977. In 2016, the low temperature was 64 degrees.


Precipitation on July 4th at Rockford
Frequency distribution of precipitation for Rockford. This dataset shows that the most frequent amount of precipitation recorded on the 4th of July is 0.00”, which accounts for 55% of the days in the dataset. The next most frequent range is the 0.02” to 0.25” of precipitation. The record amount of rainfall on the 4th of July occurred in 1973 when 1.36” of rain fell. There have been 3 instances dating back to 1905 where over an inch of rain fell on the 4th of July. In 2016, no rain fell.


ADDITIONAL 4th OF JULY CLIMATE DATA      ( * MEANS LAST OCCURRENCE)

MAX TEMP
WARMEST

MIN TEMP
WARMEST
PCPN
WETTEST
102
2012
77
1977
1.36
1973
101
1911
76
1999
1.25
1935
100
1921
75
2012
1.05
1925
96
1949
73
1993 *
0.93
1995
95
1990 *
72
1955 *
0.89
1994
94
1977 *
71
1966 *
0.68
1985
93
2002 *
70
2003 *
0.55
1932
92
1999 *
69
2004 *
0.49
1907
91
2003 *
68
2002 *
0.43
1961
90
2011 
67
2010 *
0.40
1942
 
MAX TEMP
COLDEST
MIN TEMP
COLDEST
PCPN
DRIEST
62
1967
46
1967 *
0.00
2016 *
66
1961 *
48
1940 *
T
1993 *
68
1972
49
1941 *
0.01
2010 * 
69
1997 *
50
1972 *
0.02
2000 *
70
2009 *
51
2008 *
0.03
1998 *
73
1920 *
52
2014 *
0.04
1937
74
1998 *
53
1916 *
0.05
2003
75
1956 *
54
1907
0.07
1939 *
76
1932
55
1997 *
0.08
1997
77
2005 *
56
2013 *
0.10
1991 *


Updated 6/24/2017