
A storm system will shift from eastern Texas into the lower Mississippi Valley Monday with additional threats of severe thunderstorms and heavy to excessive rainfall which may bring flooding. A Flood Watch remains in effect. In the northern U.S., a storm will bring heavy snow and gusty winds over parts of the northern Rockies, northern Plains, and Upper Midwest Monday into Wednesday. Read More >
| Drought Monitor |
| Local Drought Statement |
| Drought Impacts |
| Recent Precipitation & Temperatures |
| Precipitation Forecasts |
| Monthly & Seasonal Drought Outlooks |
| Acknowledgements & Additional Info |
Local Drought Statement
  |
Drought Monitor (Drought Severity)
|
|
||||
|
|||||
Drought Impacts
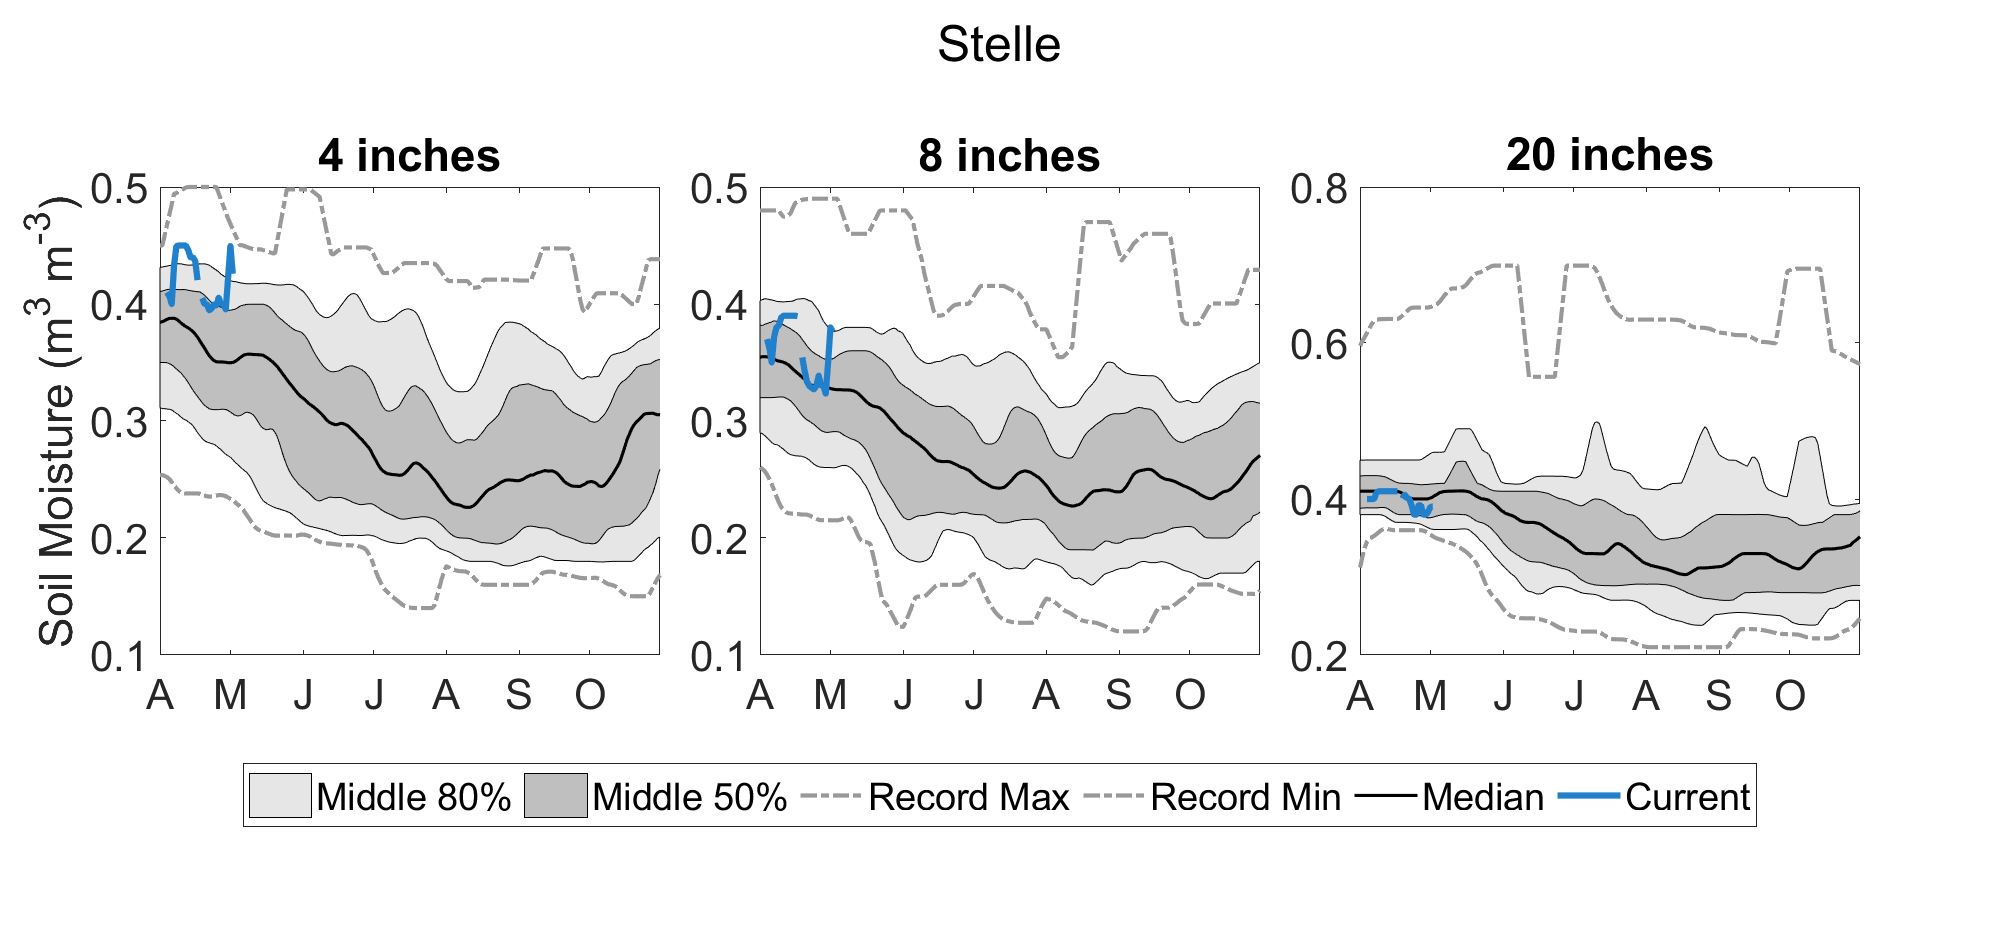
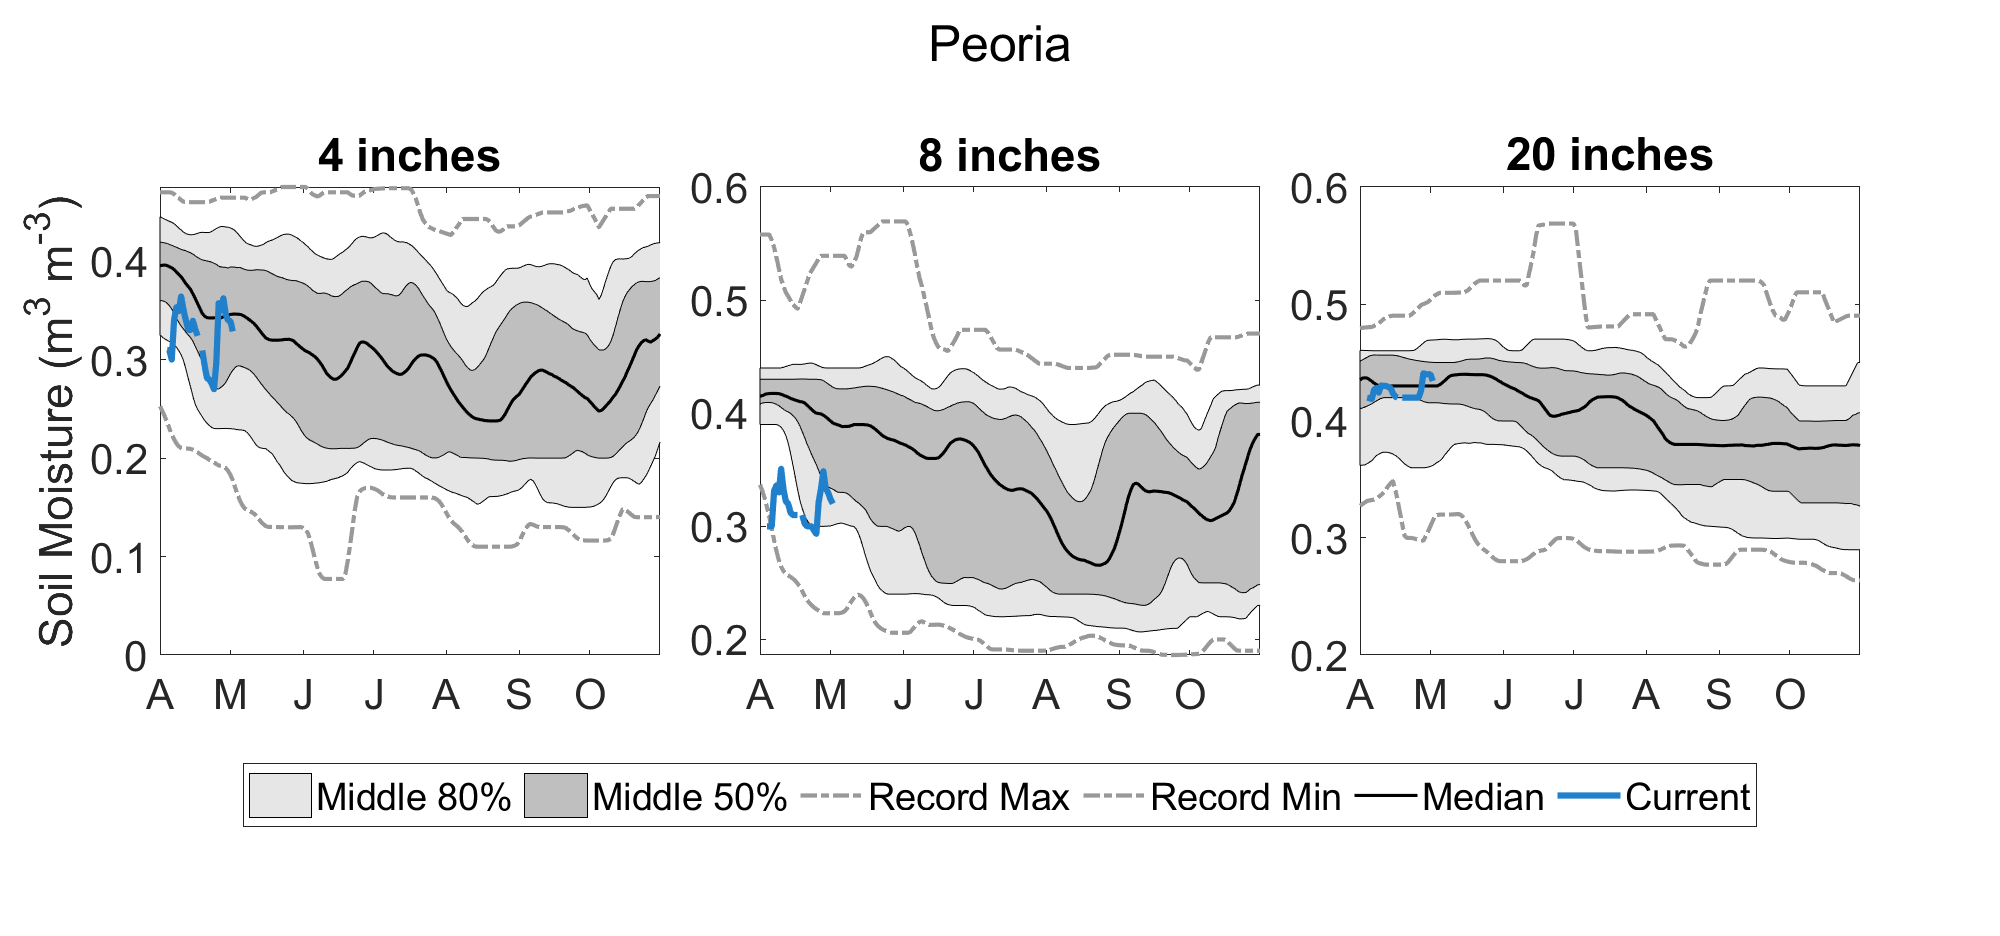
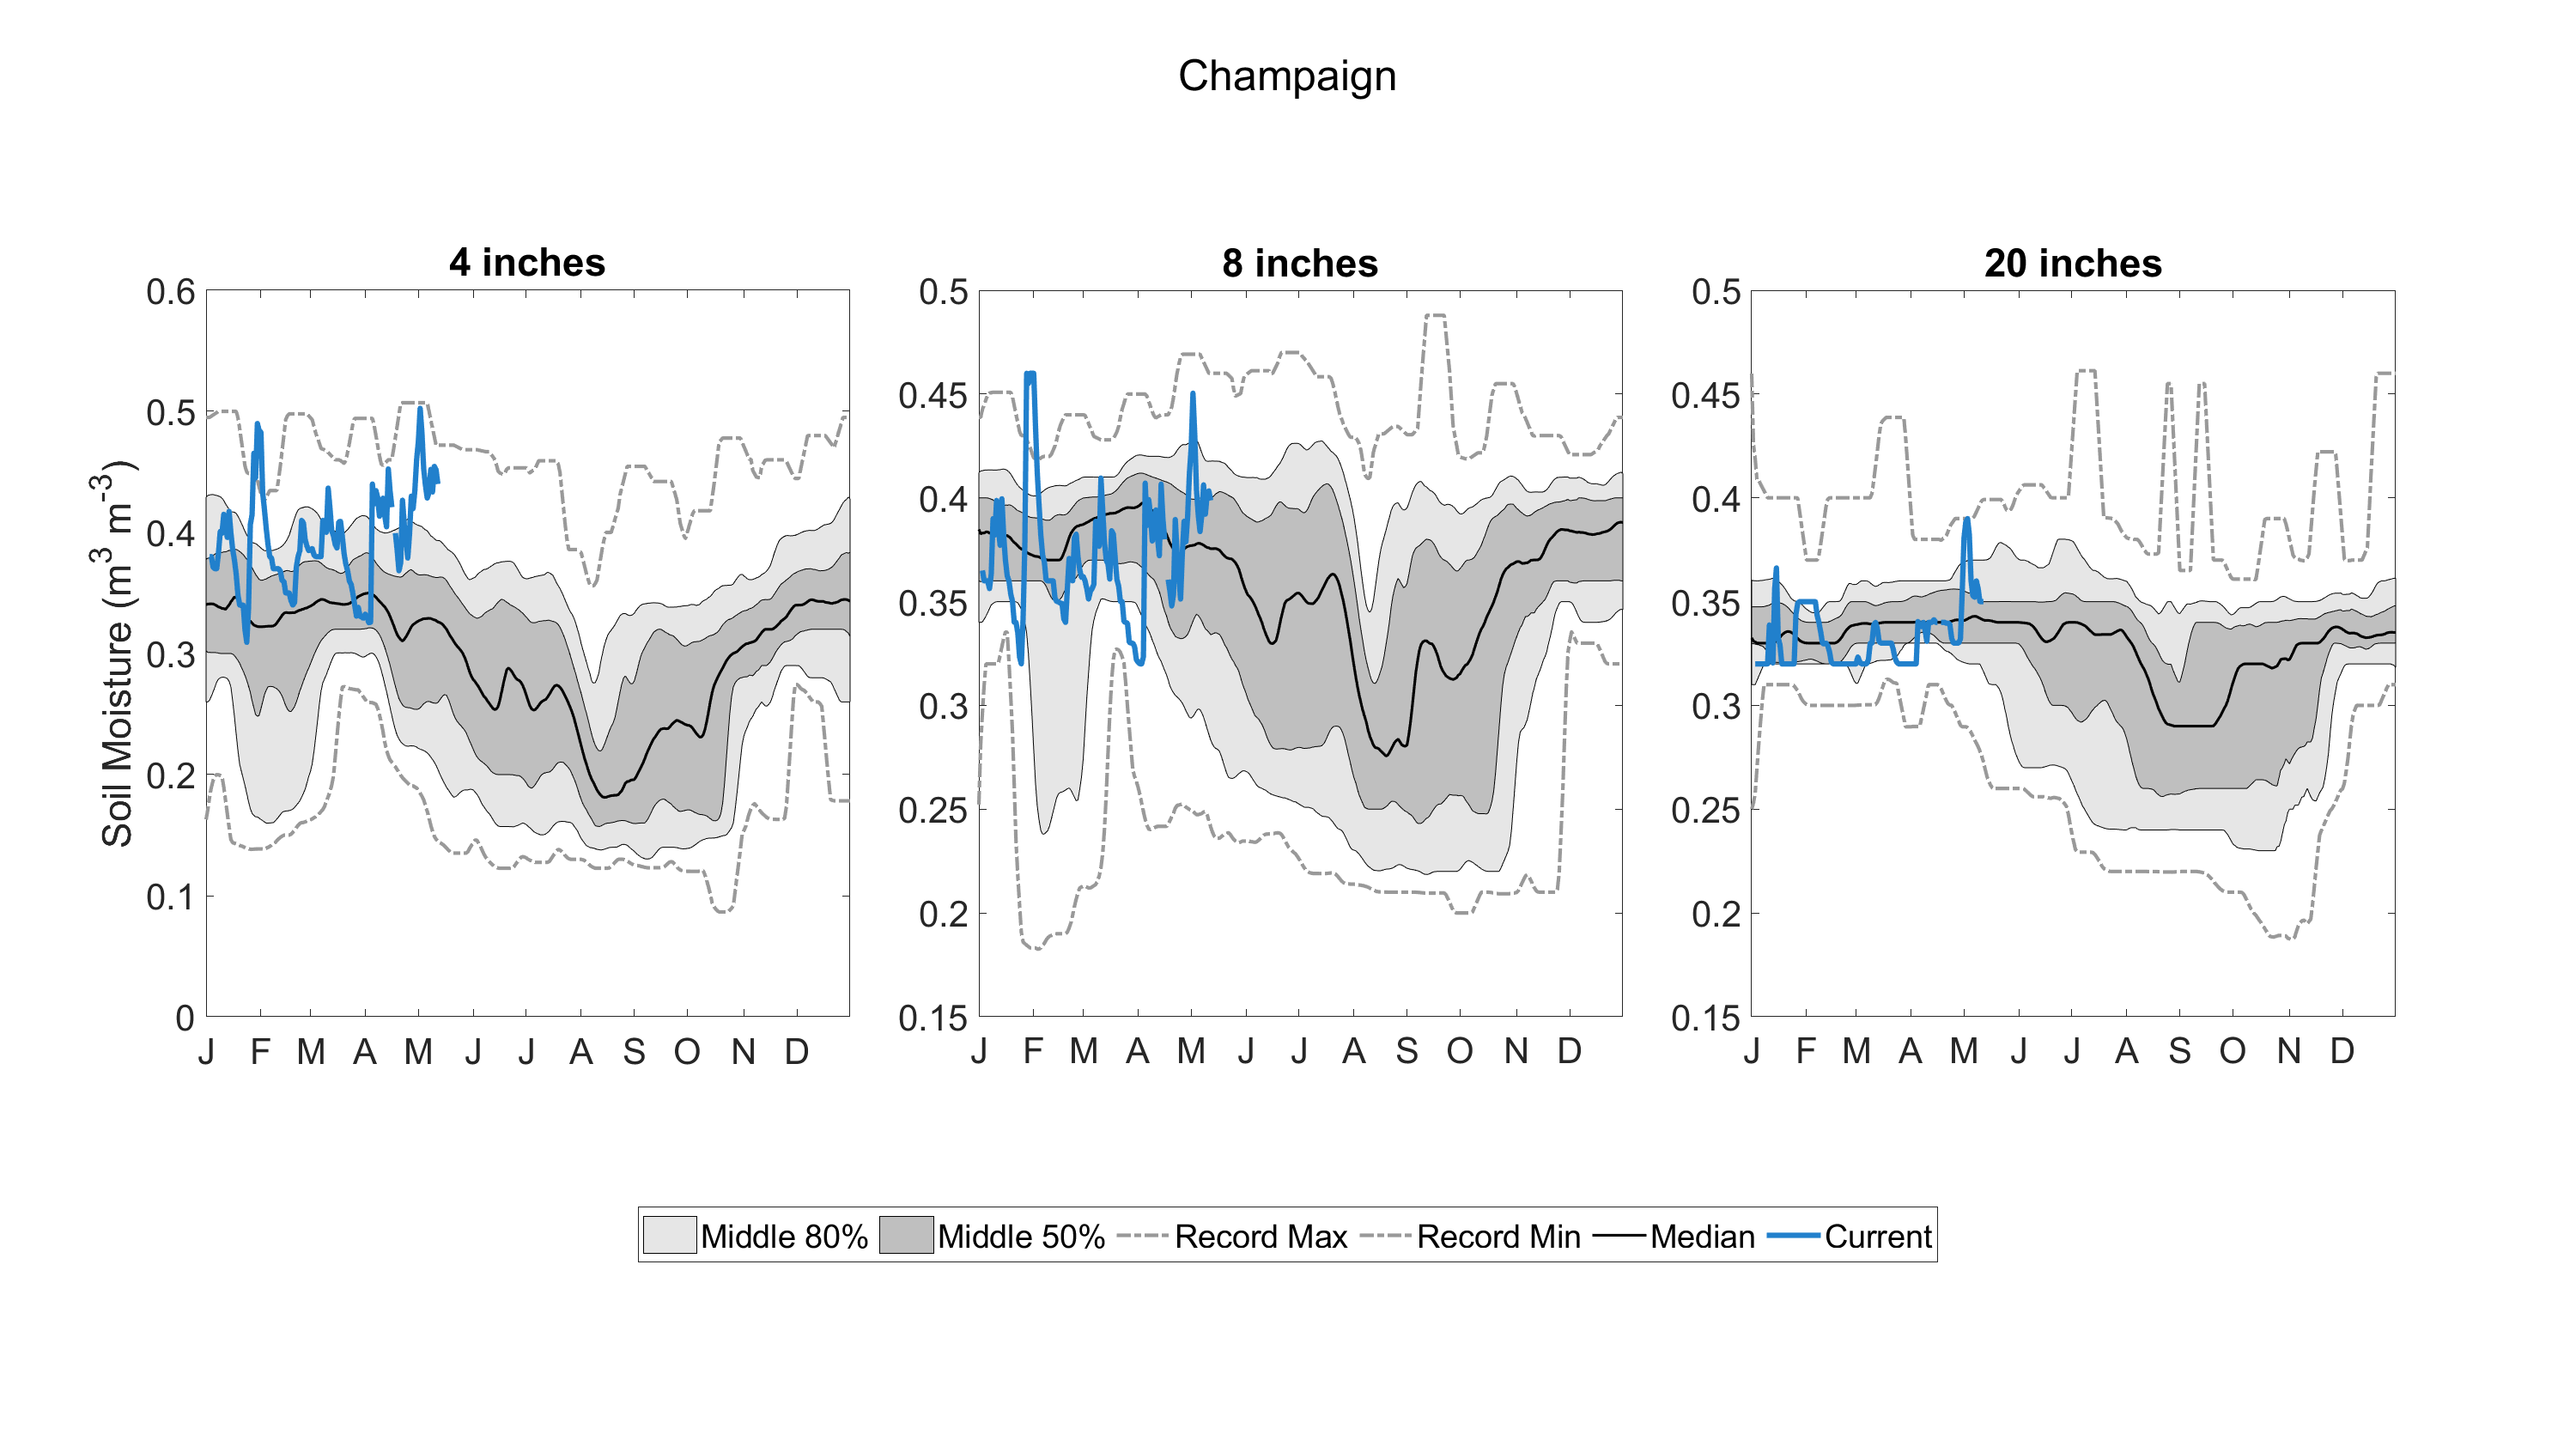
| Soil Moisture | |||||||||||||||||||||||||||
| Daily Soil Moisture Anomaly | Daily Soil Moisture Percentile | Monthly Soil Moisture Anomaly Change | |||||||||||||||||||||||||
 |
 |
||||||||||||||||||||||||||
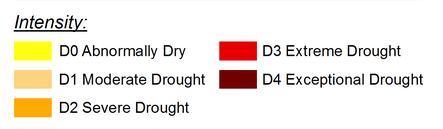
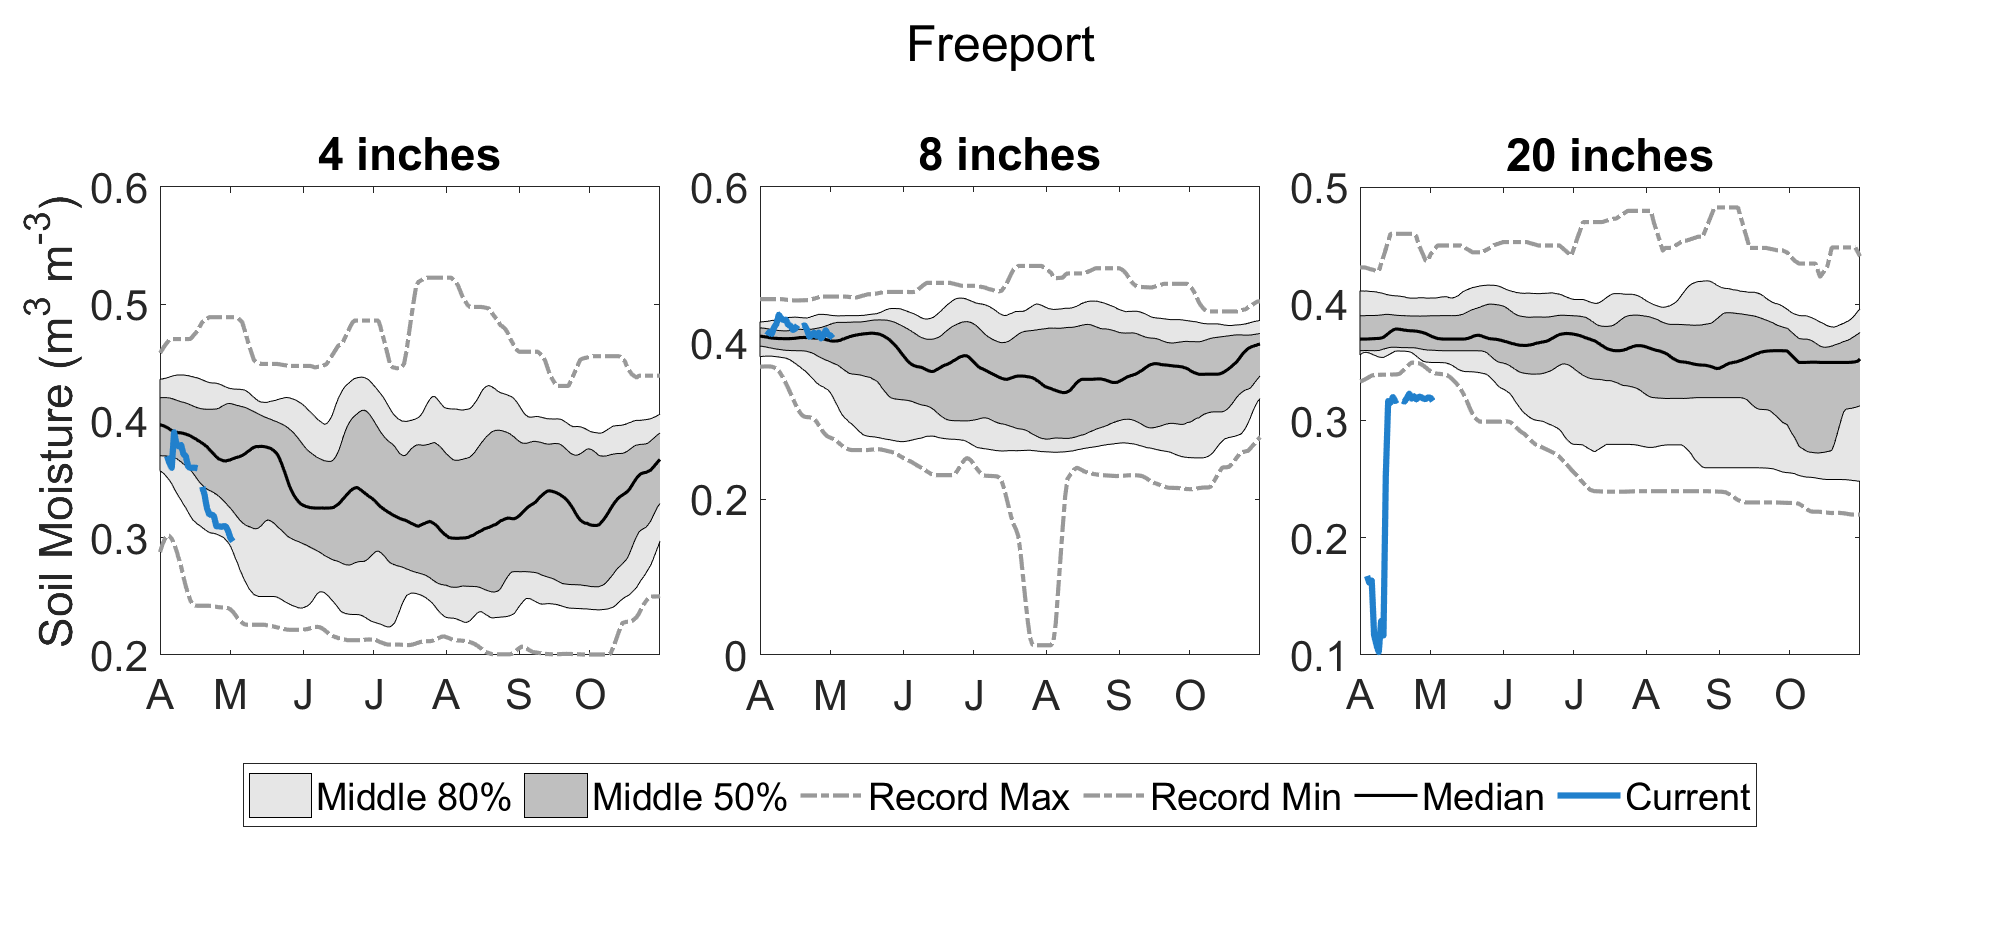
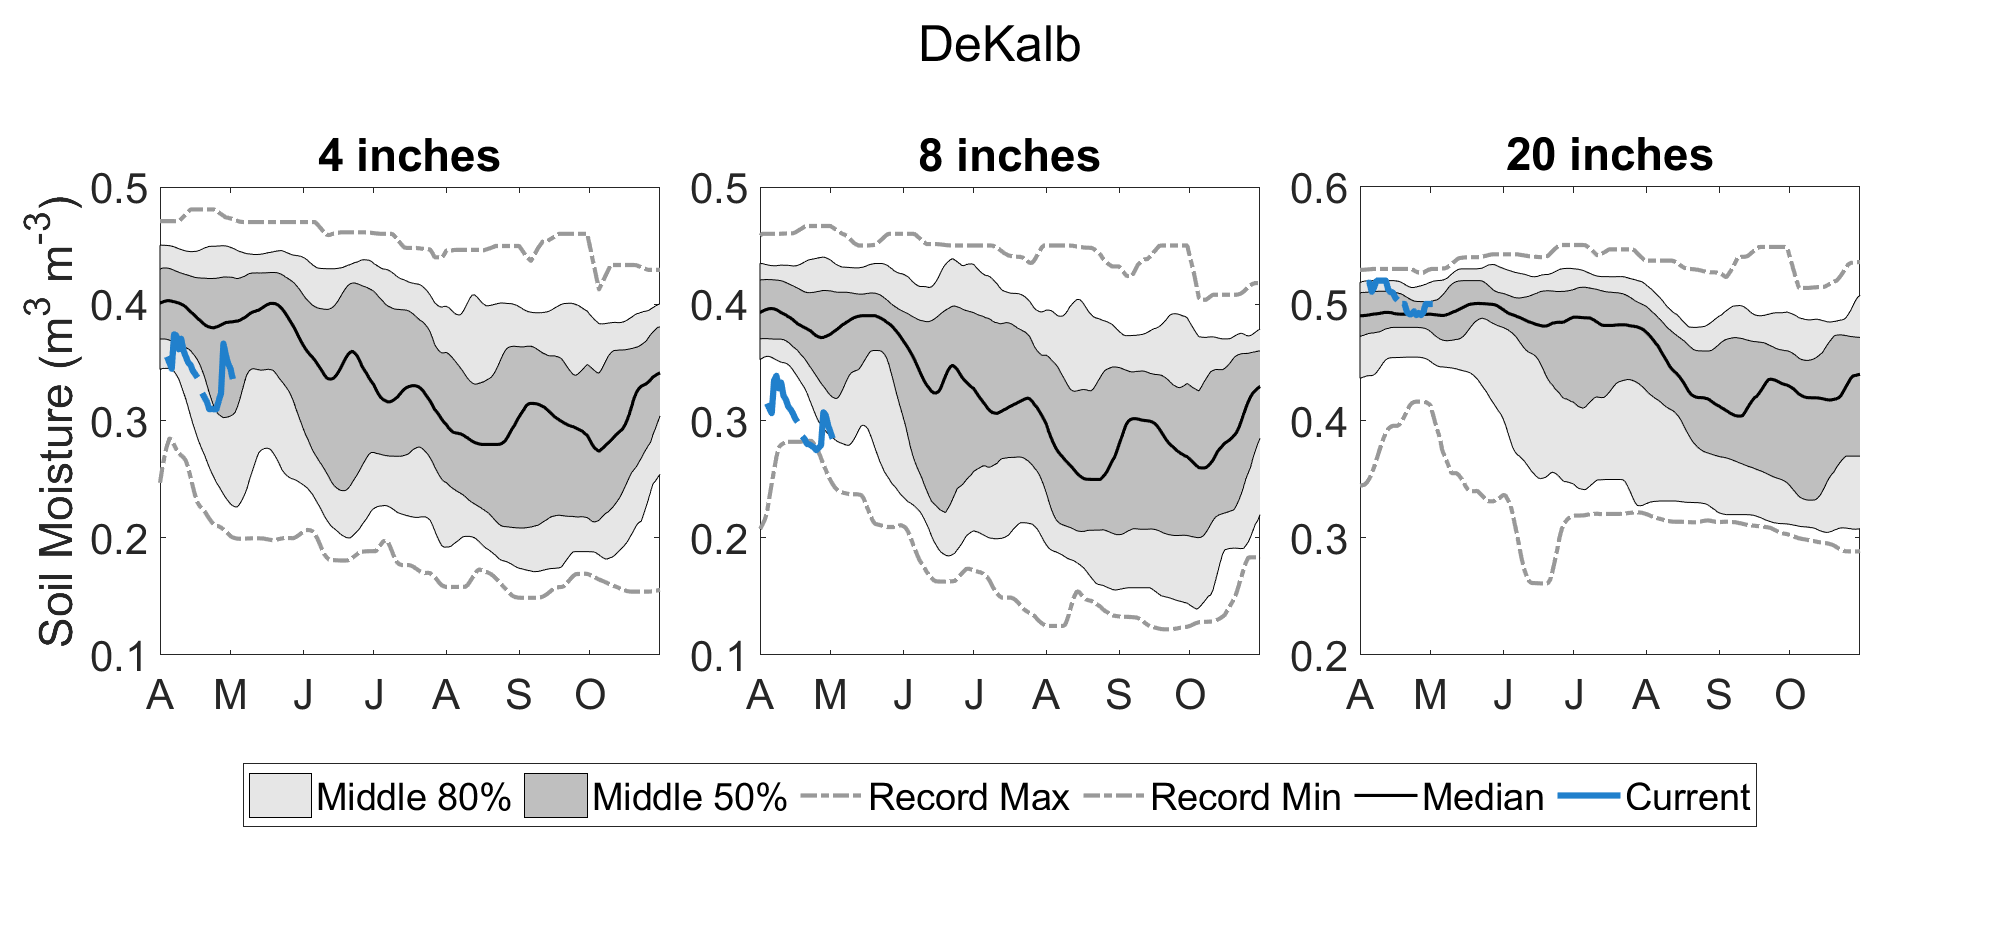
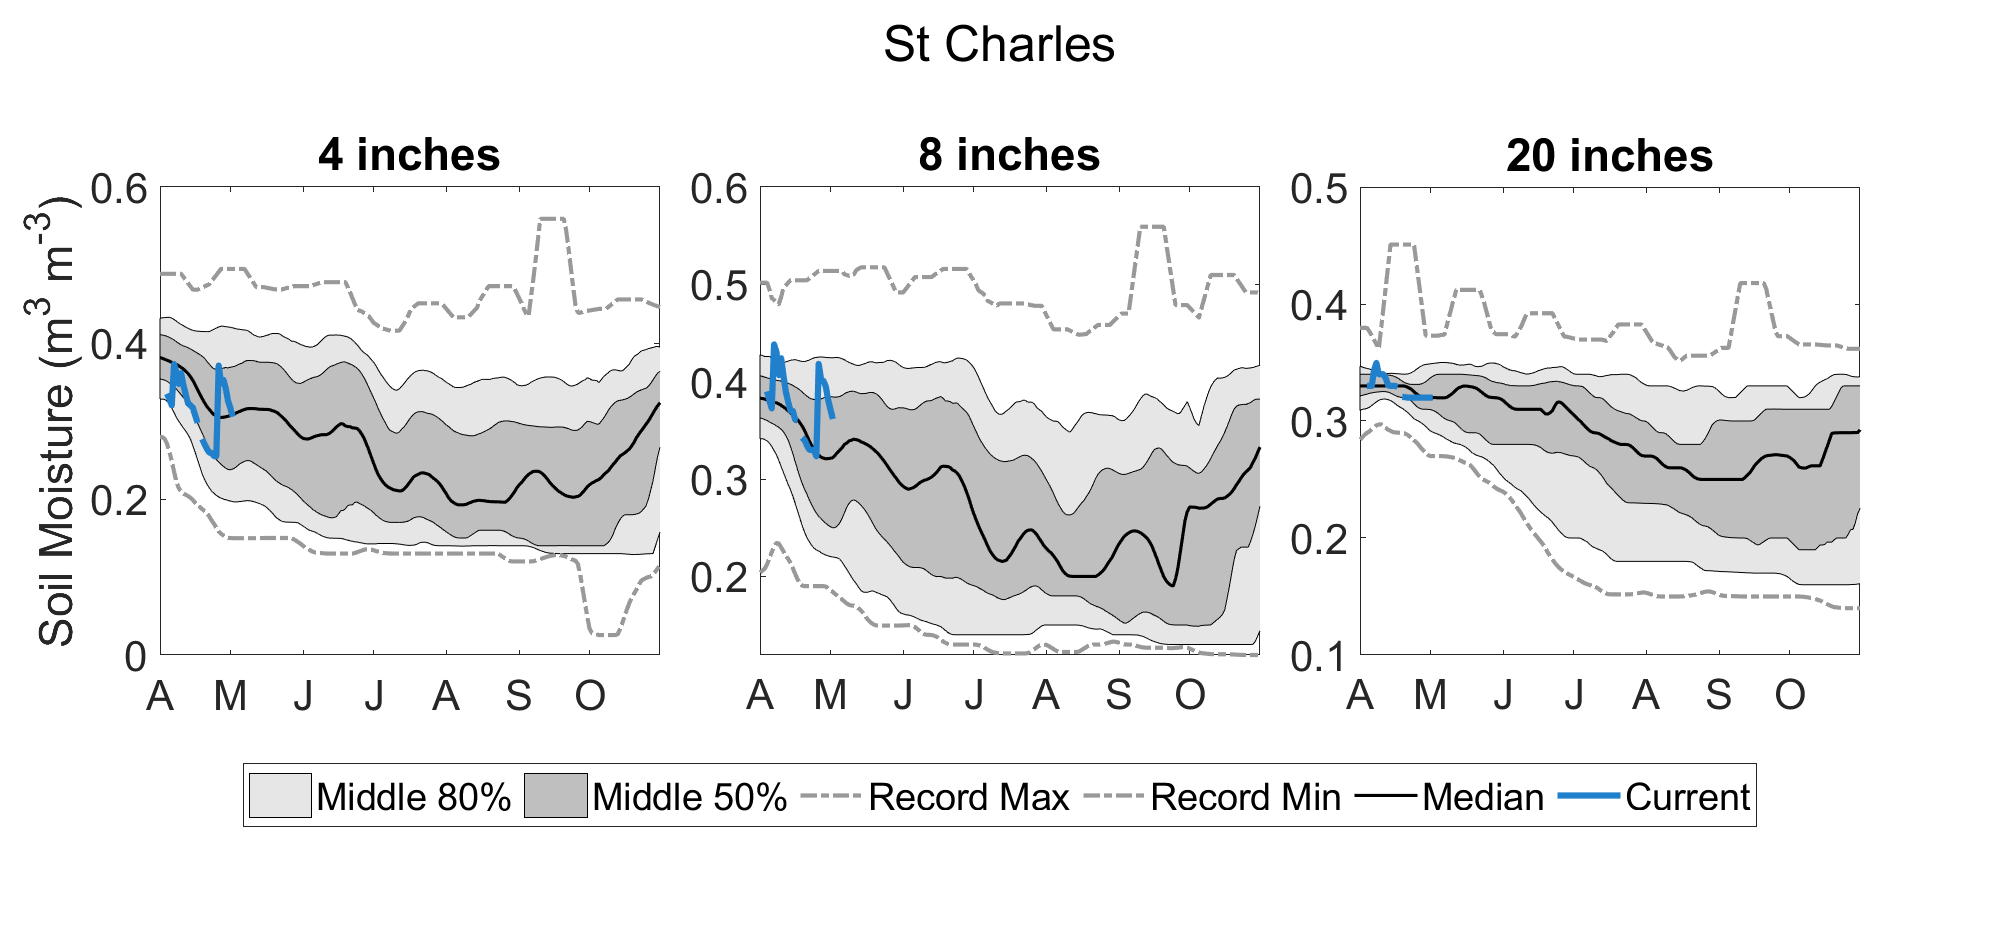
| Observed Soil Moisture: Freeport | Observed Soil Moisture: DeKalb | Observed Soil Moisture: St. Charles | |||||||||||||||||||||||||
 |
 |
 |
|||||||||||||||||||||||||
| Observed Soil Moisture: Stelle | Observed Soil Moisture: Peoria | Observed Soil Moisture: Champaign | |||||||||||||||||||||||||
 |
 |
 |
|||||||||||||||||||||||||
|
|||||||||||||||||||||||||||
|
Agriculture |
|||||||||||||||||||||||||||
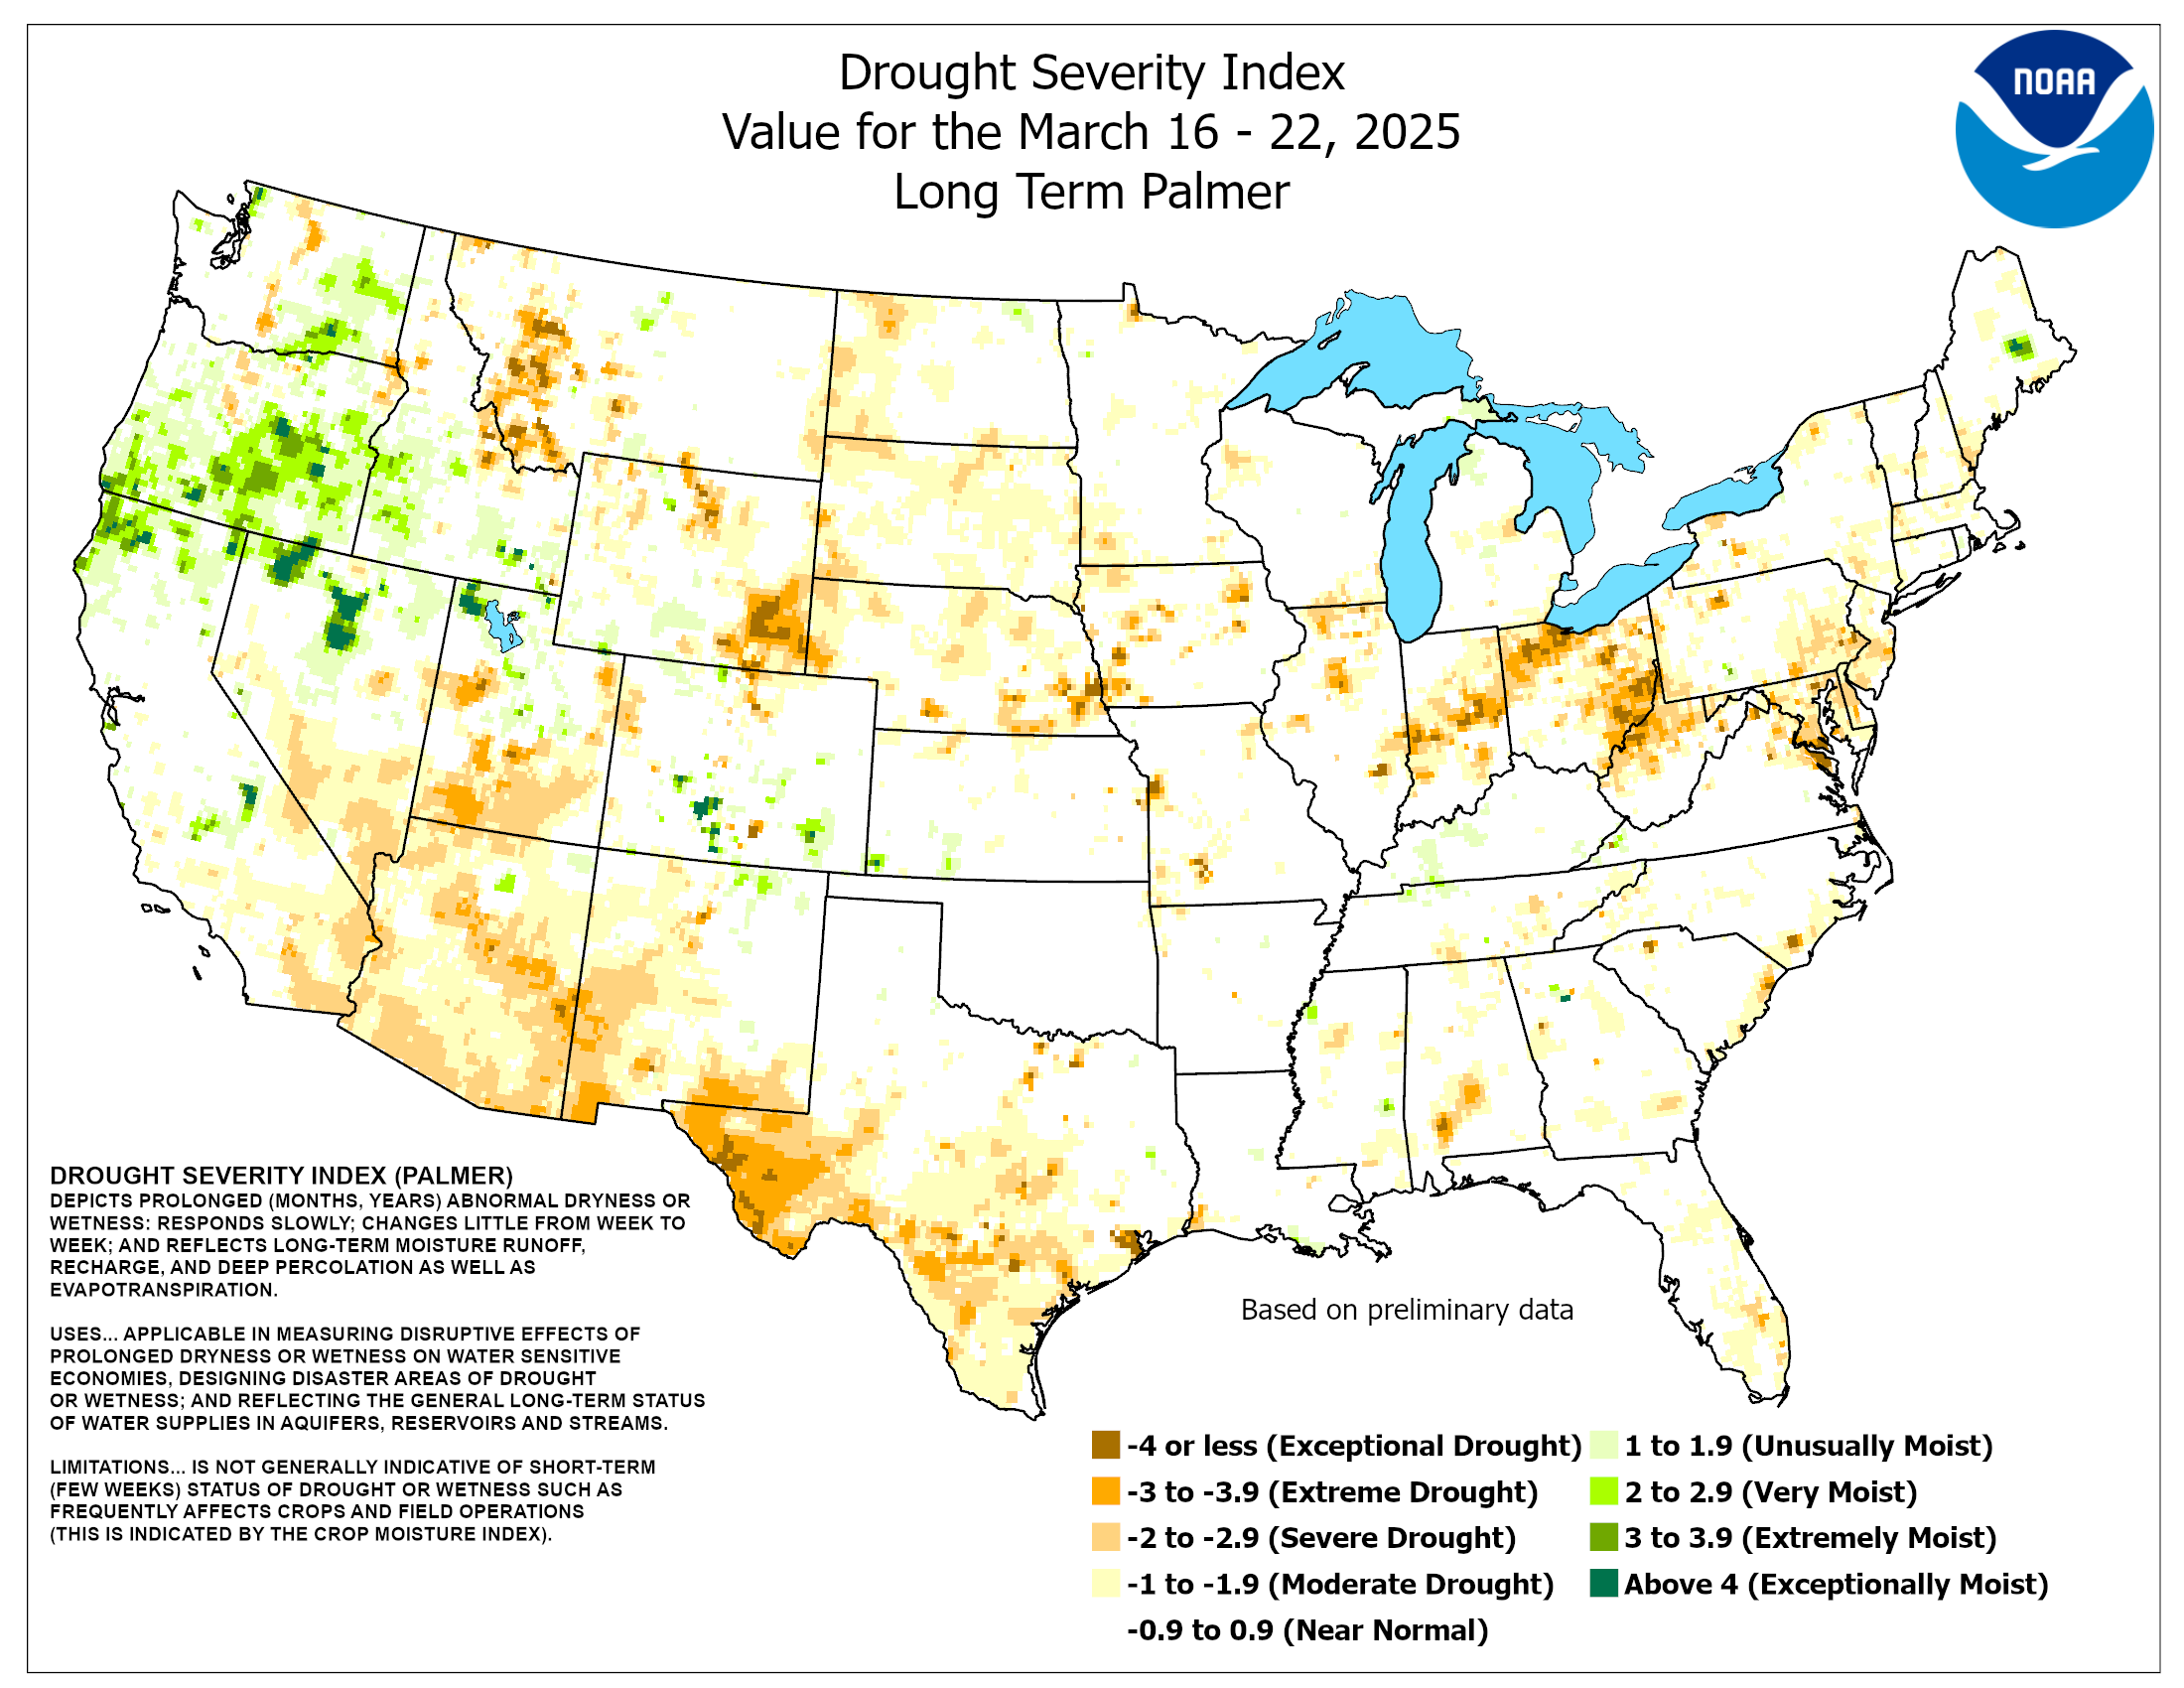
|
Palmer Drought Severity Index |
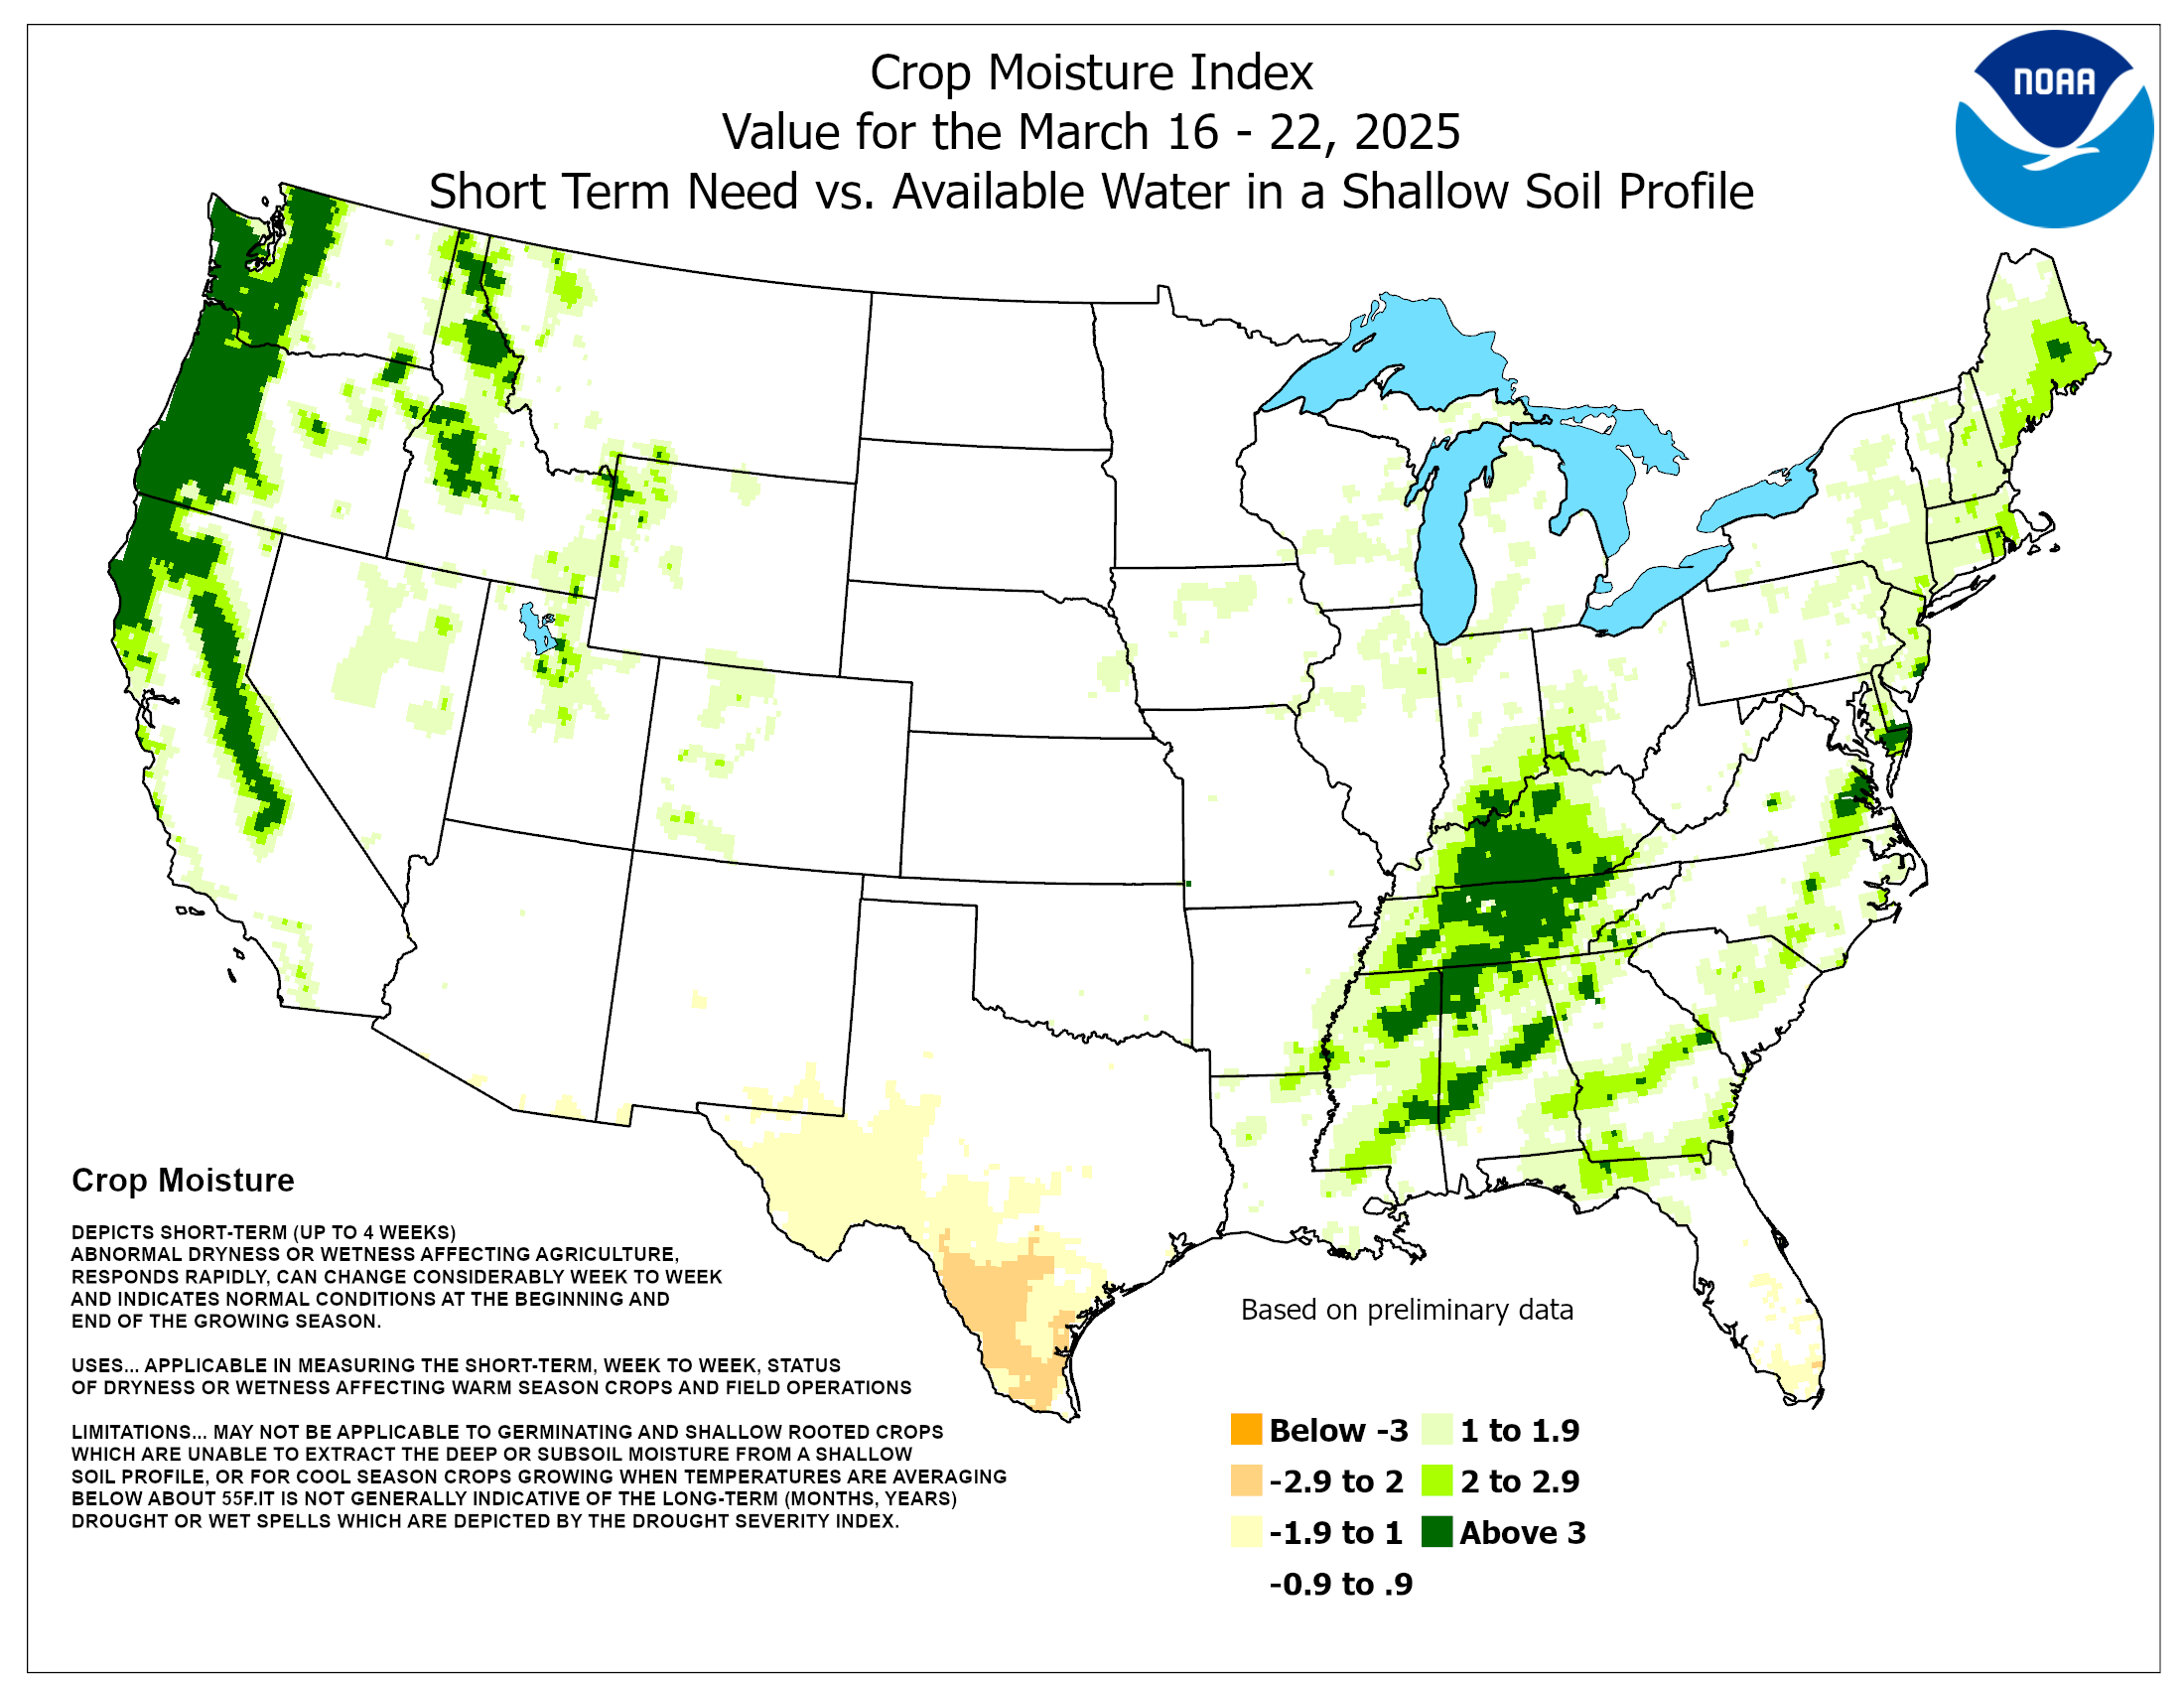
Crop Moisture Index |
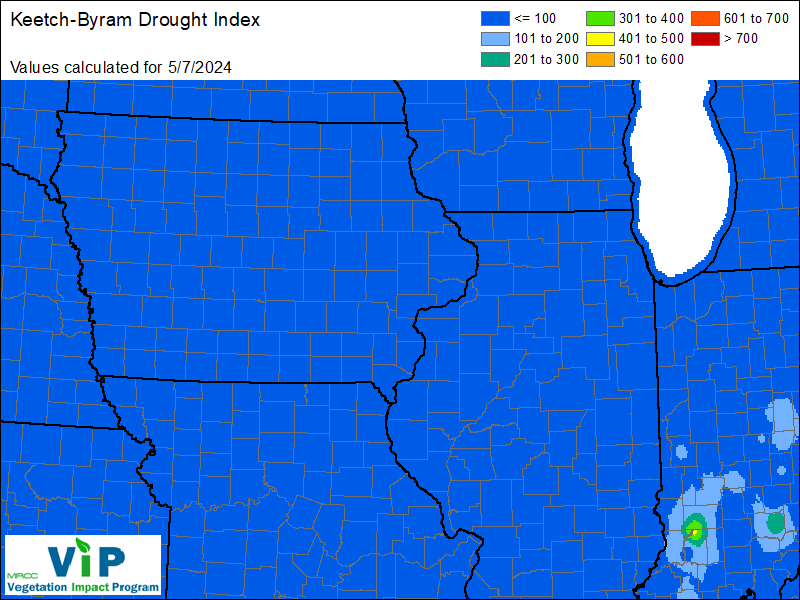
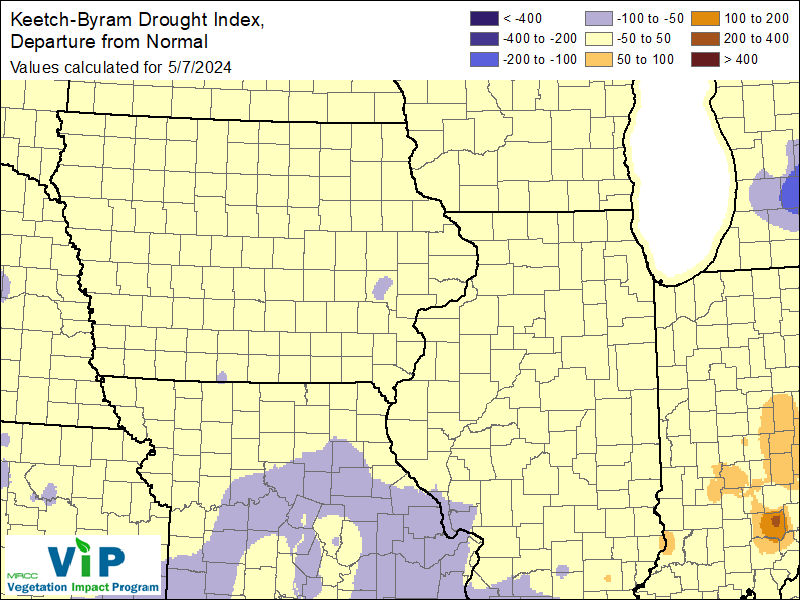
Keetch-Byram Drought Index (about) Keetch-Byram Departure from Normal |
|||||||||||||||||||||||||
 |
|
 |
|||||||||||||||||||||||||
|
|||||||||||||||||||||||||||
|
|
|||||||||||||||||||||||||||
| Rivers | |||||||||||||||||||||||||||
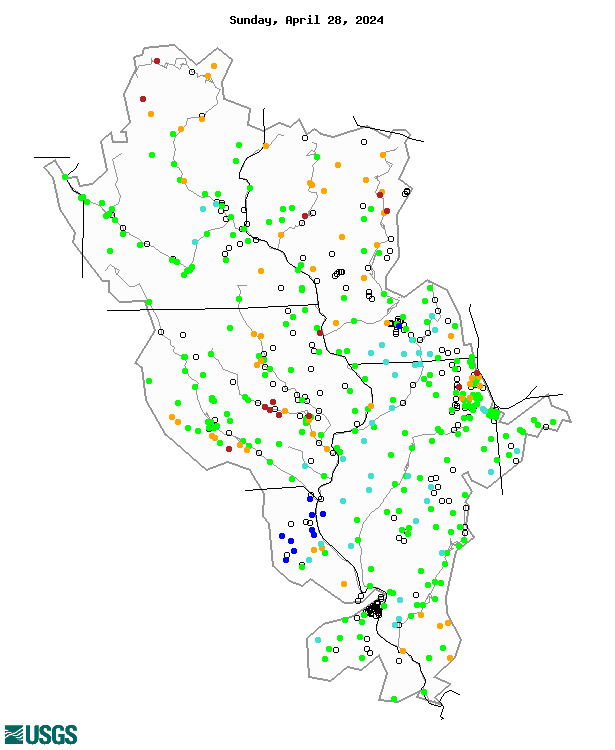
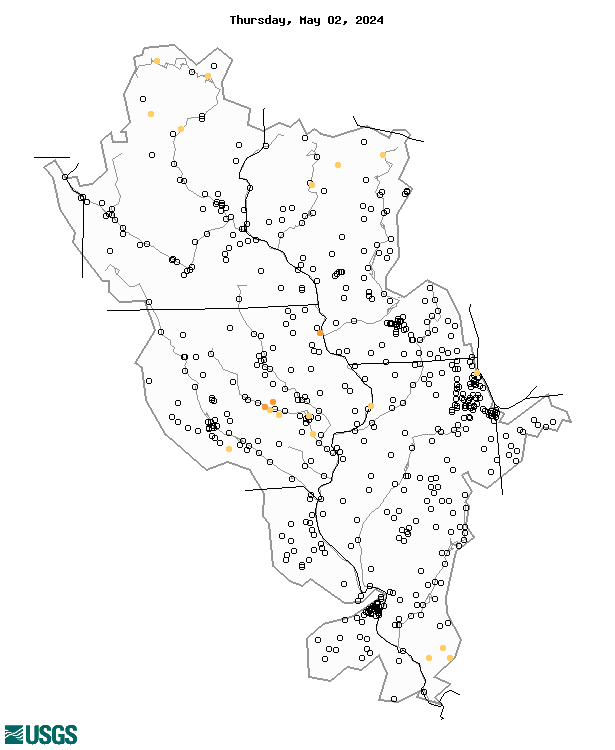
| USGS 7-Day Average Streamflow: Upper Mississippi River Basin | USGS 7-Day Average Streamflow: Hydrologic Drought | ||||||||||||||||||||||||||
 |
|
||||||||||||||||||||||||||
 |
More information on current river conditions: More information on drought impacts to rivers: |
||||||||||||||||||||||||||
|
|
|||||||||||||||||||||||||||
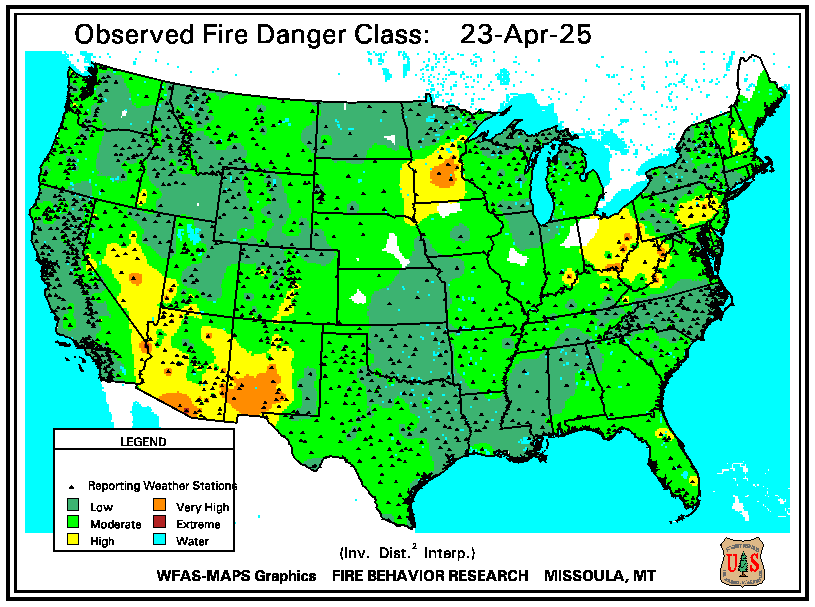
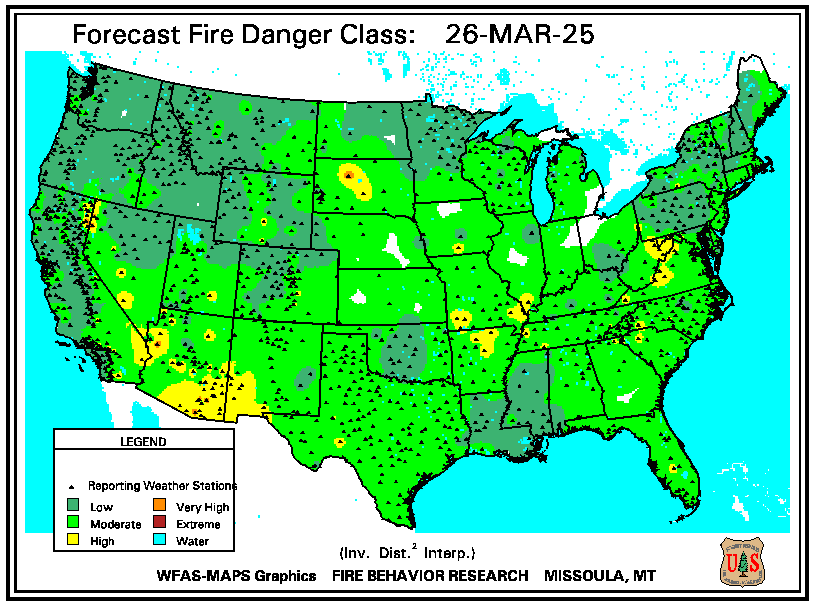
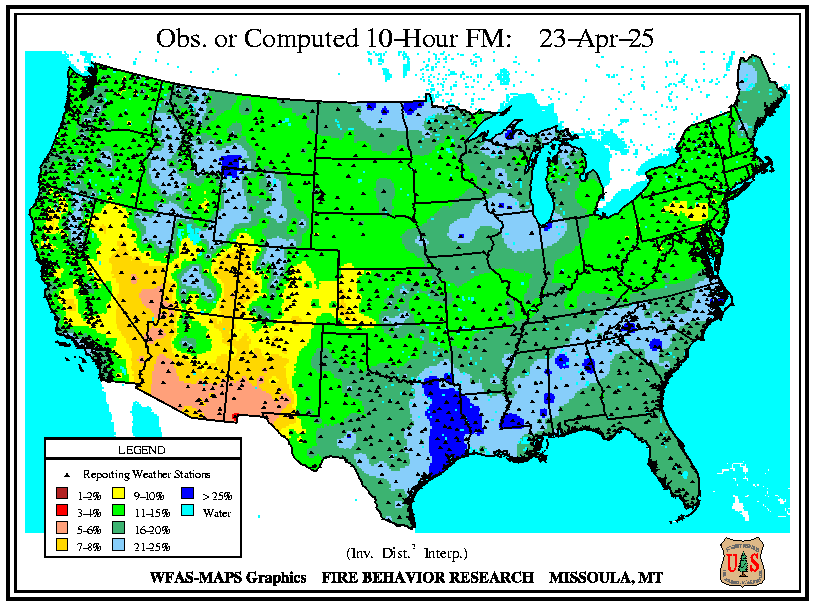
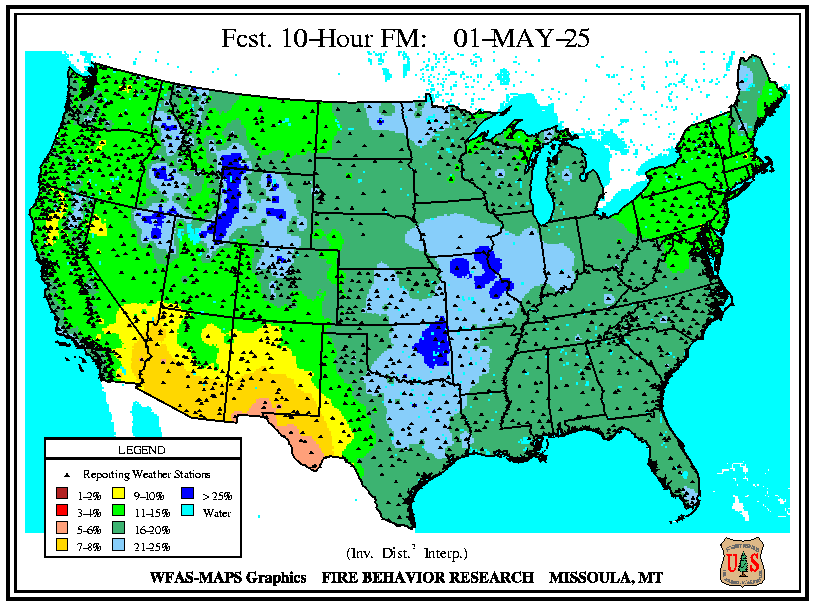
| Fire | |||||||||||||||||||||||||||
|
|||||||||||||||||||||||||||
| Other Impacts | |||||||||||||||||||||||||||
|
National Drought Mitigation Center |
CoCoRaHS |
Farm Week Now |
|||||||||||||||||||||||||
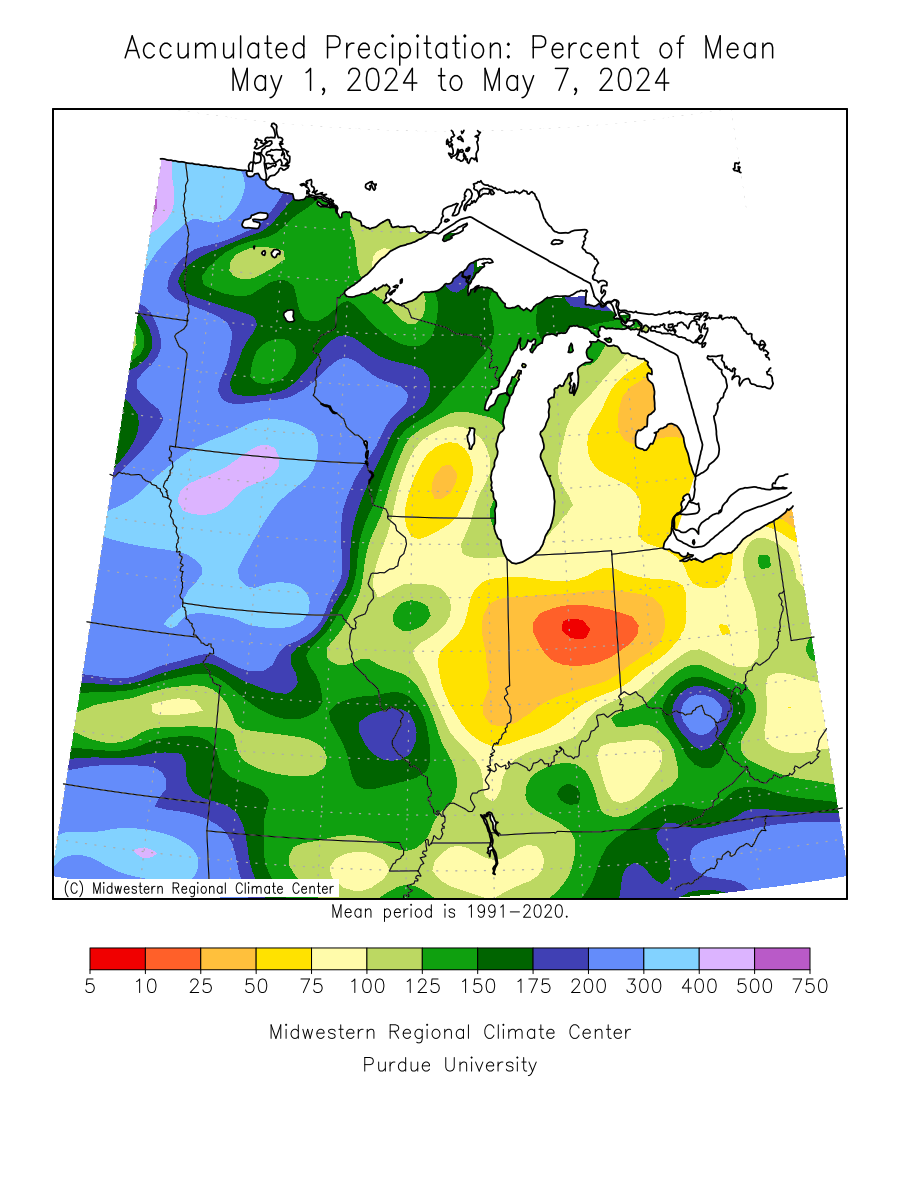
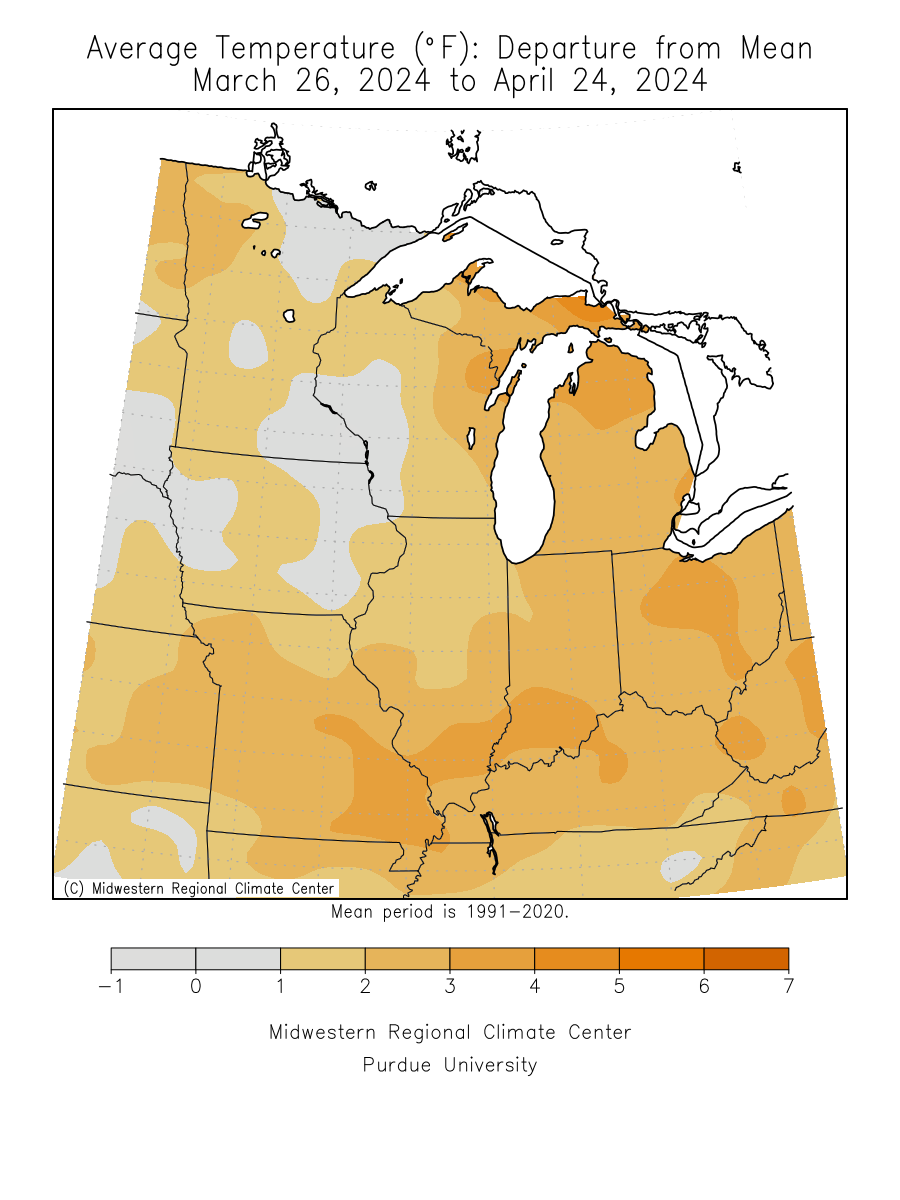
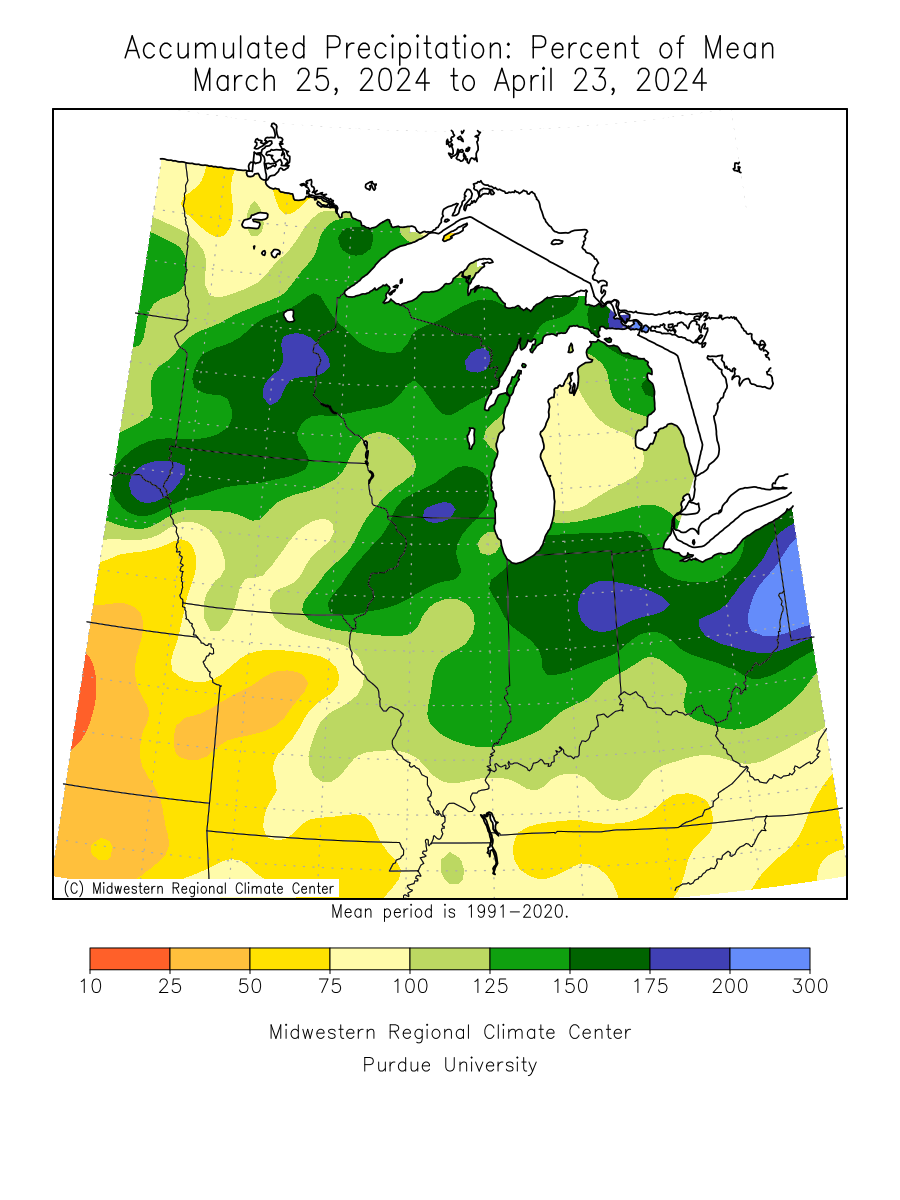
Recent Precipitation & Temperatures
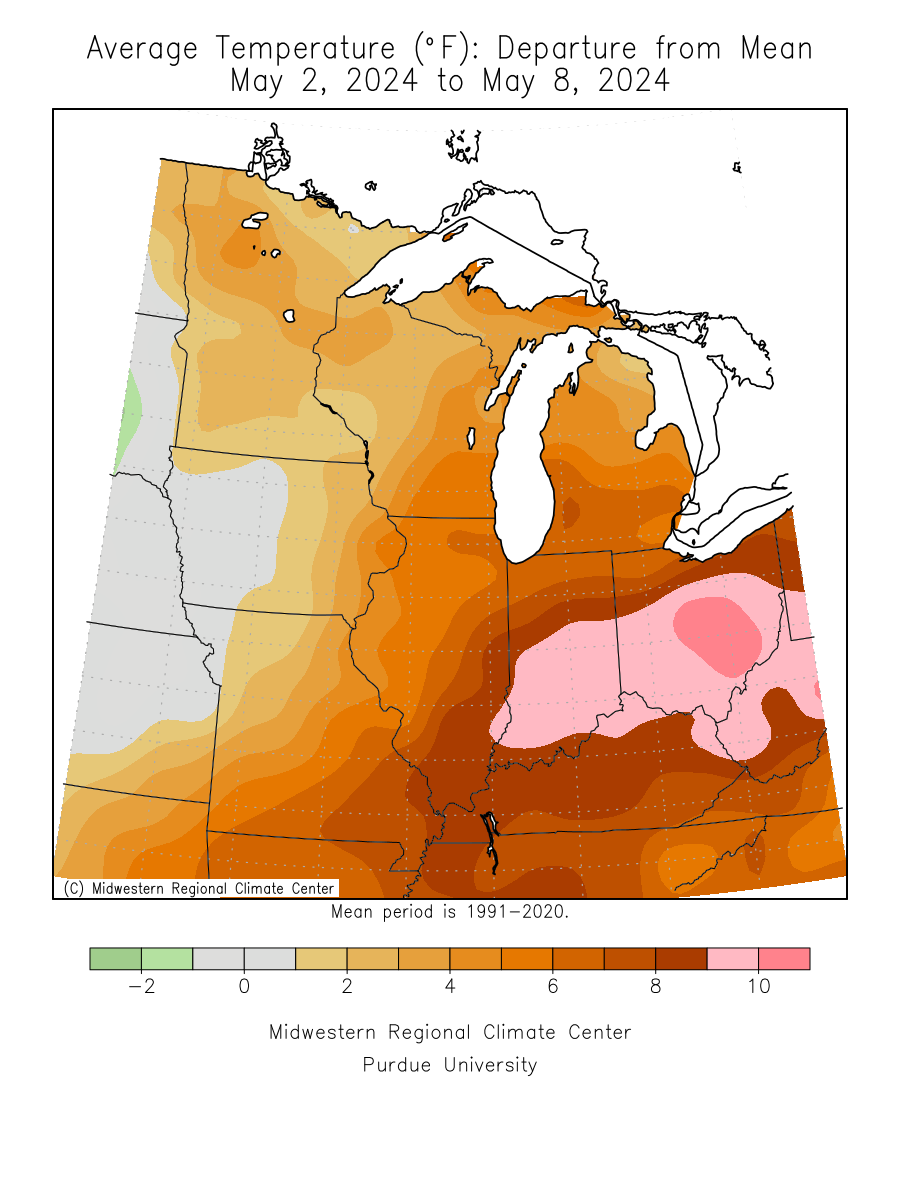
Maps Courtesy of the Midwestern Regional Climate Center
| 7-Day Running Averages/Totals & Departures | ||
7-Day Avg. Temperature Departure |
7-Day Precipitation Total |
7-Day Precipitation Total Percent of Mean |
 |
 |
 |
|
|
||
| Last 30 Day Maps | ||
Last 30 Day Avg. Temperature Departure |
Last 30 Day Precipitation Total |
Last 30 day Precipitation Total Percent of Mean |
 |
 |
 |
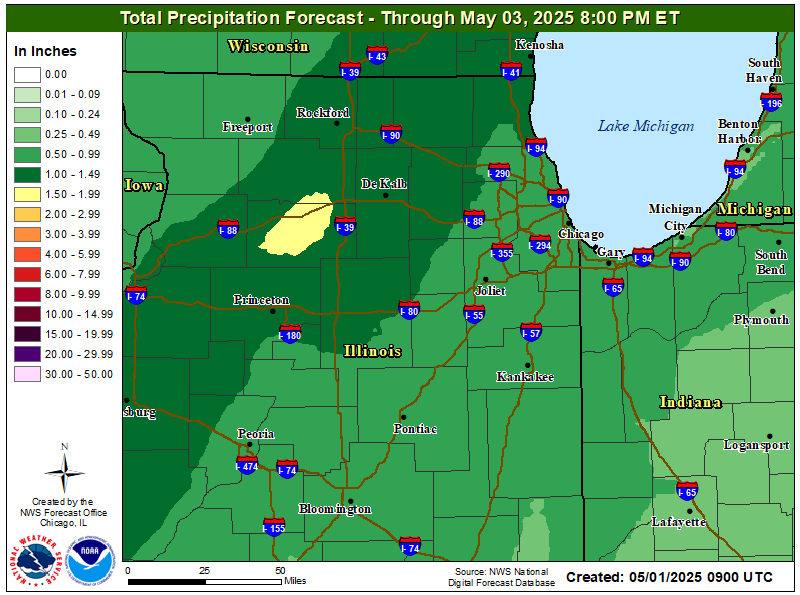
Precipitation Forecasts
Local Precipitation Forecasts (NWS - LOT)
National Precipitation Forecasts (WPC)
| 3-Day Total Rainfall Amount Forecast |
5-Day Total Rainfall Amount Forecast |
7-Day Total Rainfall Amount Forecast |
 |
 |
 |
|
For probabilistic temperature and precipitation outlooks for week 2 and beyond, |
|||||
|
|||||
| 6-10 Day Temperature Outlook | 6-10 Day Precipitation Outlook | ||||
 |
 |
||||
|
|||||
Acknowledgements & Additional Information
| The drought monitor is a multi-agency effort involving NOAA's National Weather Service (NWS) and National Centers for Environmental Information (NCEI), the USDA, State and Regional Center Climatologists, and the National Drought Mitigation Center. Information for the drought statements has been gathered from NWS, FAA, and CoCoRaHS observation sites, Iowa State and Illinois Cooperative Extension Services, the USDA, the U.S. Army Corps of Engineers, and the USGS. |
|
||||
|
||||


