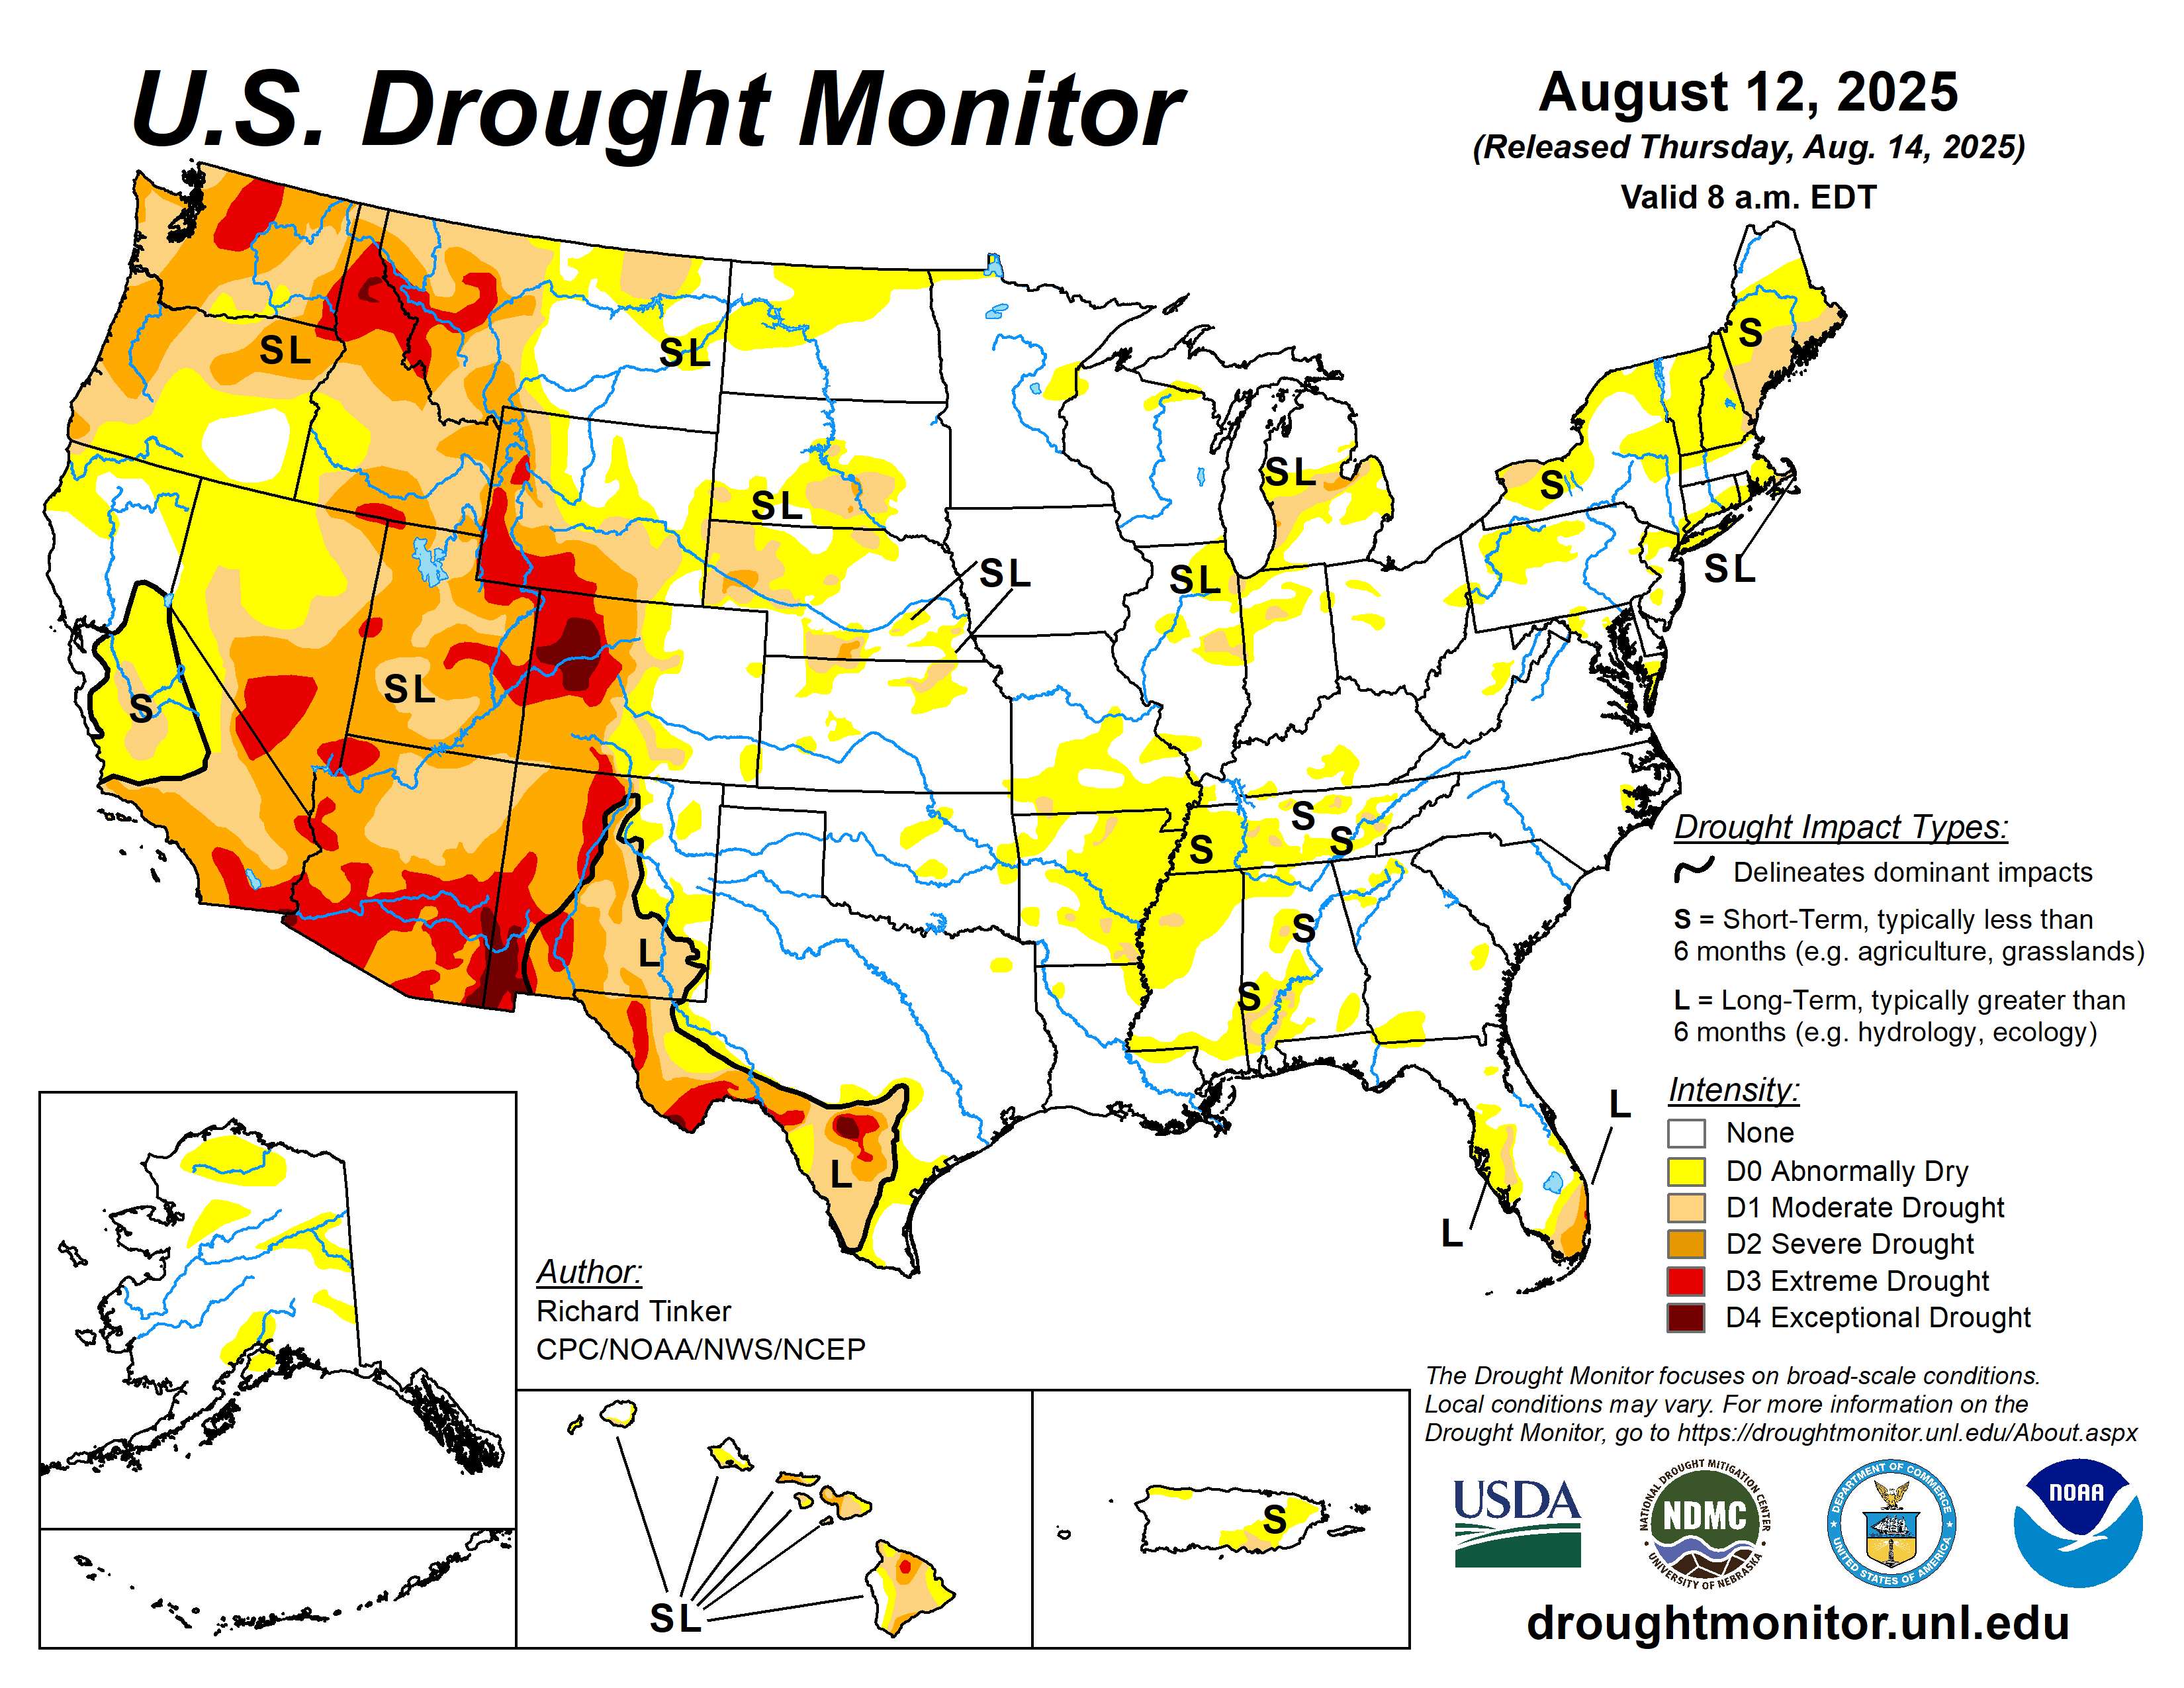
National Weather Service United States Department of Commerce

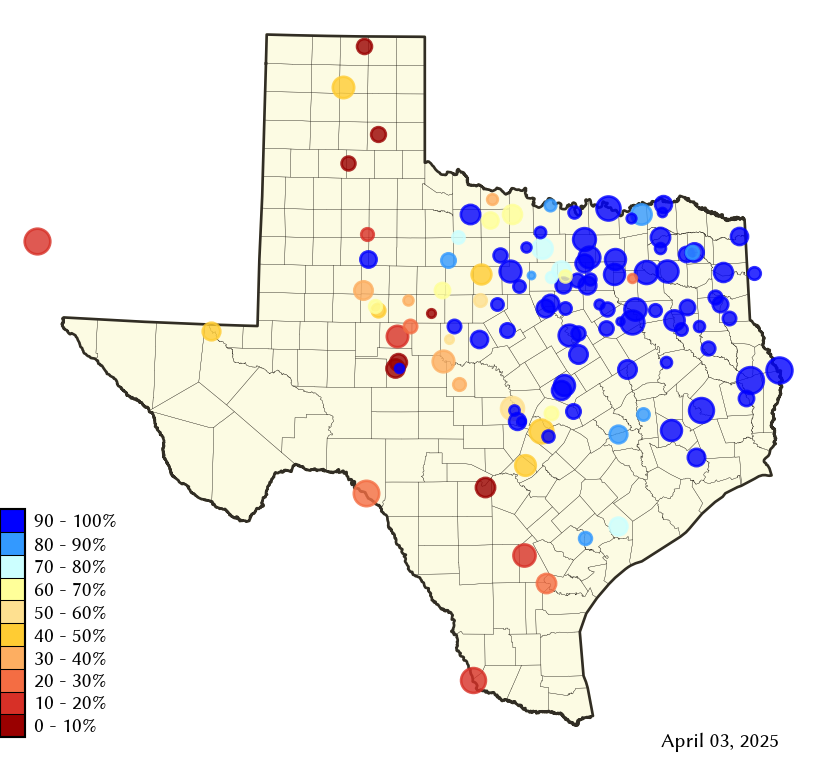
Texas and Oklahoma Panhandle Drought Center


Summary (from September 19, 2023):

The latest Drought Information Statement is available here.

Please note the above link is to an experimental new Drought Information Statement format. For more information and a link to a survey about the new format, please see this page.
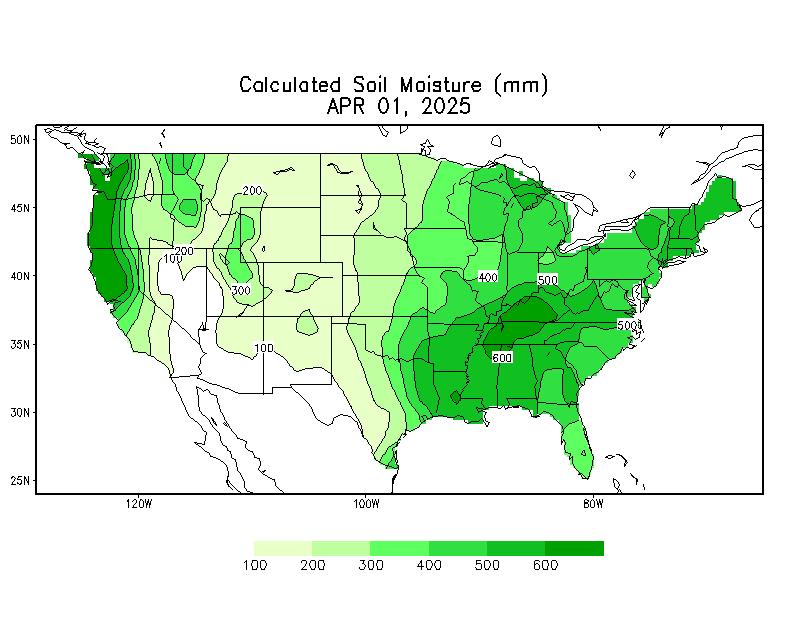


Drought Monitor Two Month Drought Change
 Current Drought Conditions  2-Month Drought Change


Monthly Drought Outlook Seasonal Drought Outlook


Parlmer Drought Severity Index
Palmer Drought Severity Index


Precipitation

30-day Precipitation

30-day Precipitation Departure from Normal

30-day Precipitation Percent of Normal

Precipitation Past 30 Days 30-Day Departure From Normal  30-Day % of Normal


60-day Precipitation
 

60-day Precipitation Departure from Normal

60-day Precipitation Percent of Normal
 

Precipitation Past 60 Days 60-Day Departure From Normal 60-Day % of Normal


90-day Precipitation
 

90-day Precipitation Departure from Normal

90-day Precipitation Percent of Normal

Precipitation Past 90 Days 90-Day Departure From Normal 90-Day % of Normal


6-month Precipitation
6-month Precipitation Departure from Normal 6-month Precipitation Percent of Normal
 
Precipitation Past 6 Months 6-Month Departure From Normal 6-Month % of Normal


1-year Precipitation
 

1-year Precipitation Departure from Normal

1-year Precipitation Percent of Normal
 

Precipitation Past 1 Year 1-Year Departure From Normal 1-Year % of Normal


3-year Precipitation 3-year Precipitation Departure from Normal 3-year Precipitation Percent of Normal
Precipitation Past 3 Years 3-Year Departure From Normal 3-Year % of Normal


Agricultural Impacts

Reports/bulletins issued by the US Department of Agriculture:


Current Crop Moisture Index Current Soil Moisture Current Soil Moisture Anomalies


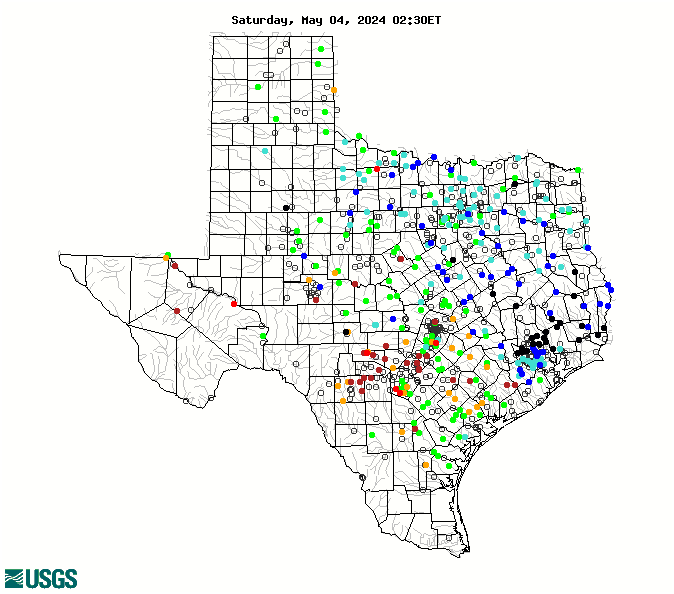
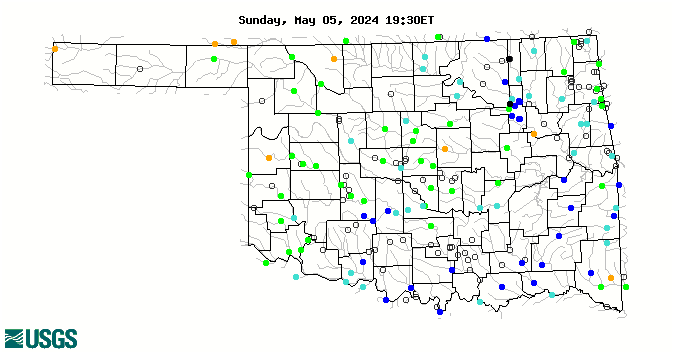
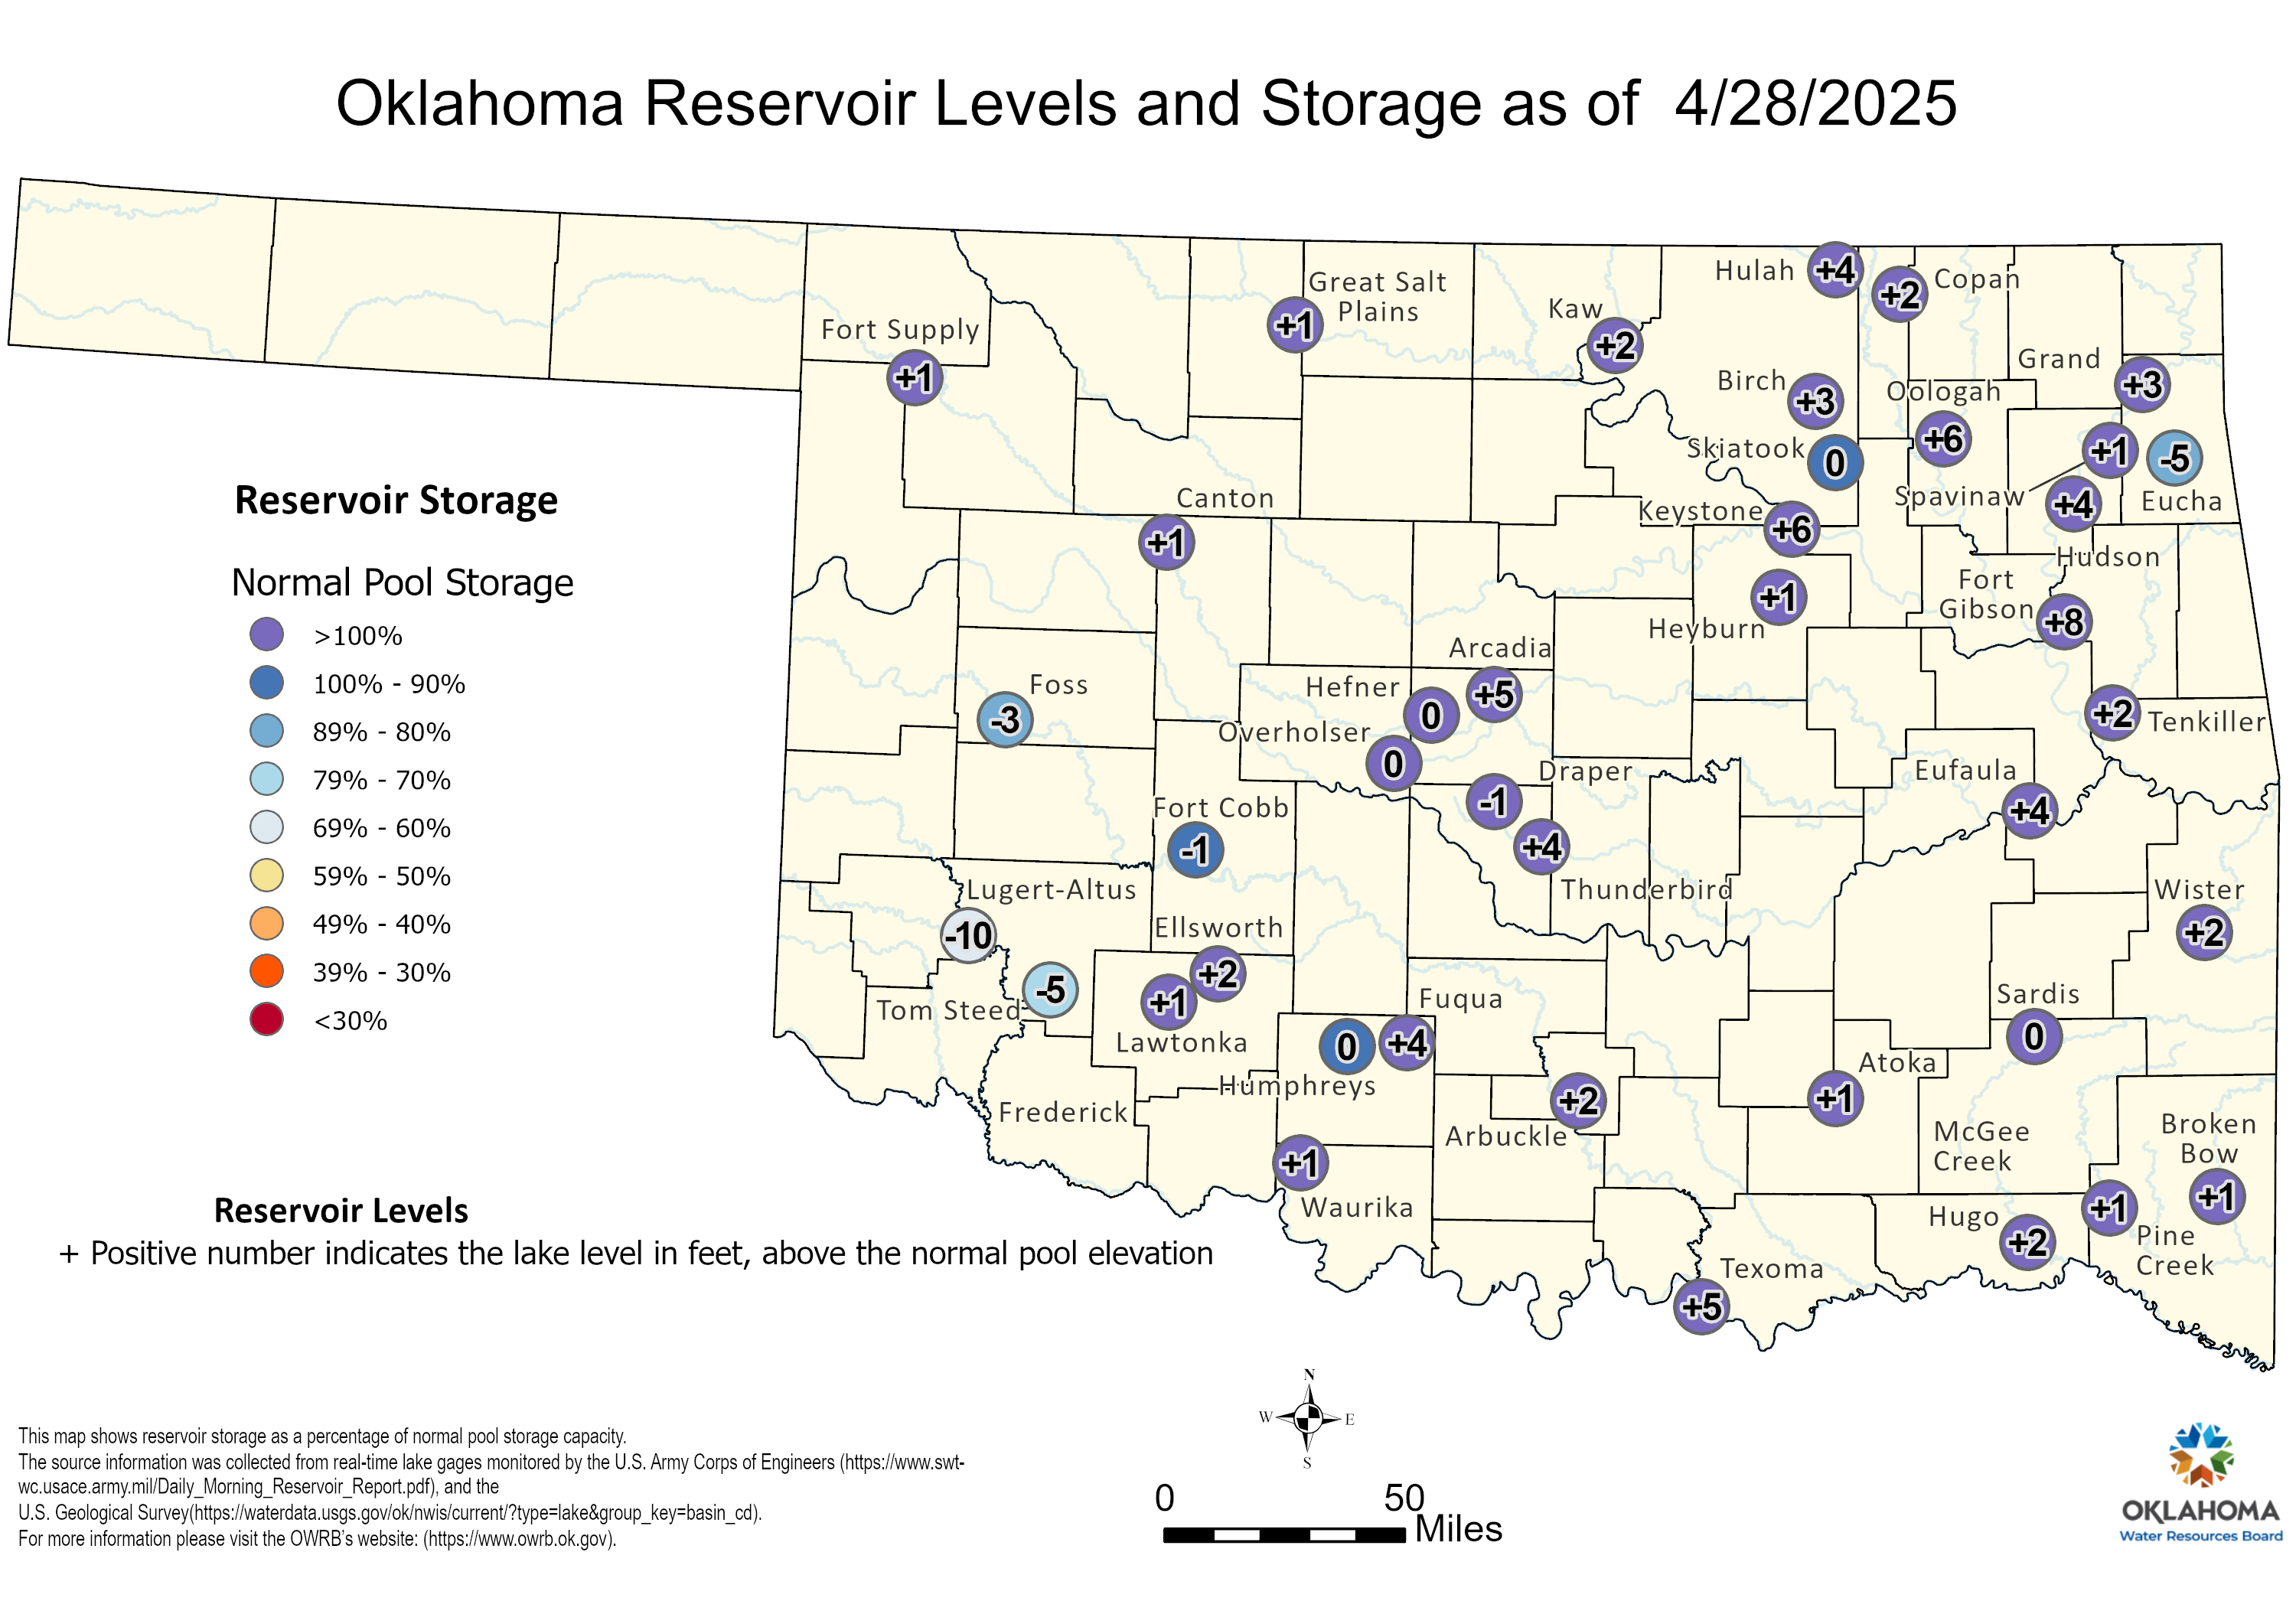
Hydrological Impacts

Texas Streamflow Compared to Normal Oklahoma Streamflow Compared to Normal
Texas Streamflow Oklahoma Streamflow
Texas real-time streamflow compared to normal. Green is near normal, blue above normal, and orange/red are below normal. Oklahoma real-time streamflow compared to normal. Green is near normal, blue above normal, and orange/red are below normal.


Texas Reservoir Levels Oklahoma Reservoir Levels
Texas Reservoirs Oklahoma Reservoirs


Long-Range Outlooks

The below long-range outlook images are courtesy of the Climate Prediction Center (CPC)


  Temperature Precipitation
6-10 Day Outlook
8-14 Day Outlook  
1-Month Outlook    
3-Month Outlook    


Useful Resources


  • To report effects of the drought in your area, please go to the Drought Impact Reporter HERE.
  • National Oceanic & Atmospheric Administration's (NOAA) official drought page can be found HERE.
  • United State Department of Agriculture (USDA) Drought Page, including drought/disaster assistance can be found HERE.
  • National Climatic Data Center's (NCDC) drought page can be found HERE.