Dangerous heat will expand from the Gulf Coast into the Southern Plains and Desert Southwest through week's end. Additional extreme heat impacting the Pacific Northwest will shift to the northern Plains by the weekend. Tropical Storm Bertha is expected to continue to impact portions of the northern Gulf Coast from the western Florida Panhandle to southeastern Louisiana through tonight. Read More >
|
||
|
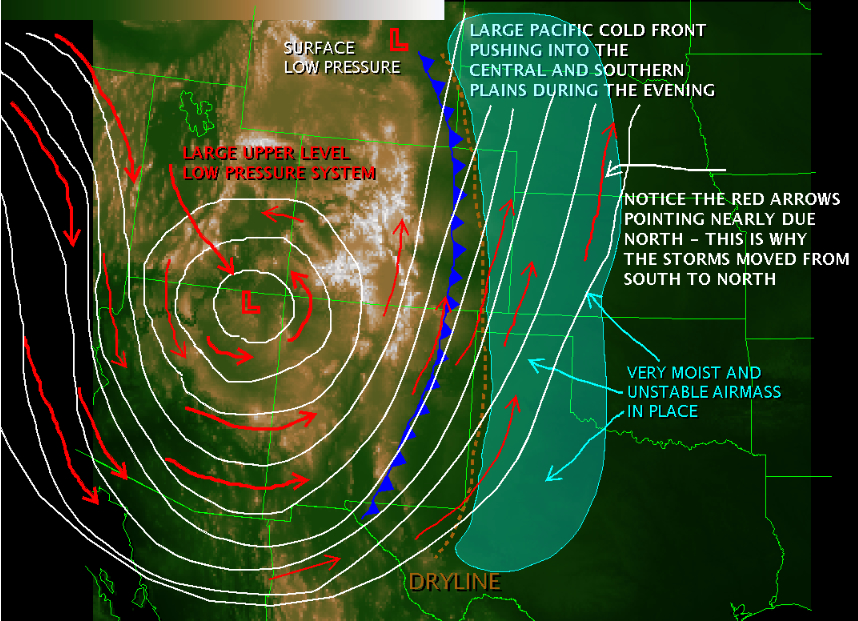
There were two dominant features in place on Wednesday, March 28 that led to the severe weather across the Texas and Oklahoma Panhandles. The first was a very large upper-level low pressure system that was positioned near the Four Corners region (Northeast Arizona). Since the center of the upper low was sitting in this location, the winds in the upper atmosphere were blowing from the south or southwest as they moved over the Panhandles. We refer to this situation as having "south or southwest flow aloft". During south or south west flow aloft regimes, two main things happen. The first is that the winds aloft actually begin to spread out in a horizontal fashion over the areas to the east of the center of the low. In other words, the air above the Panhandles was spreading out to the northwest and southeast. This results in something called diffluence, which causes lifting of air. Lift is simply the atmosphere's way of forcing the air near the ground into the upper atmosphere. The second thing that south or southwest flow regimes bring is something called "shortwave energy". If you think of very large ocean waves crashing onto the beach, a shortwave would be a smaller wave that rides along or in between two of the larger waves. This is a very important feature as short waves cause lift, but also add that extra bit of energy to an environment that can help generate severe storms. |
||
|
The image on the right shows the general synoptic pattern of the day. Notice the low pressure system over the Four Corners region and notice how the upper-level winds move from the south to the north as they reach the Panhandles. You can click on the image to enlarge. As you can see by the image, there was more than just an upper level system causing the severe weather. For every thunderstorm to form, you need three main ingredients: moisture, lift, and unstable air. |
|
|
| You can achieve lift by a number of things. One is a low pressure system in the upper atmosphere. Another form of lift is a cold front or warm front. And a third popular form of lift for the Panhandles is the dryline. On Wednesday, March 28th, all three of these ingredients were in place. If you are unfamiliar with the dryline, please click on the image to the right to see what it looks like. Essentially, the dryline is a boundary that separates very dry air from very moist air. In order to produce strong lift, the gradients between the dry and moist air must be very tight. | 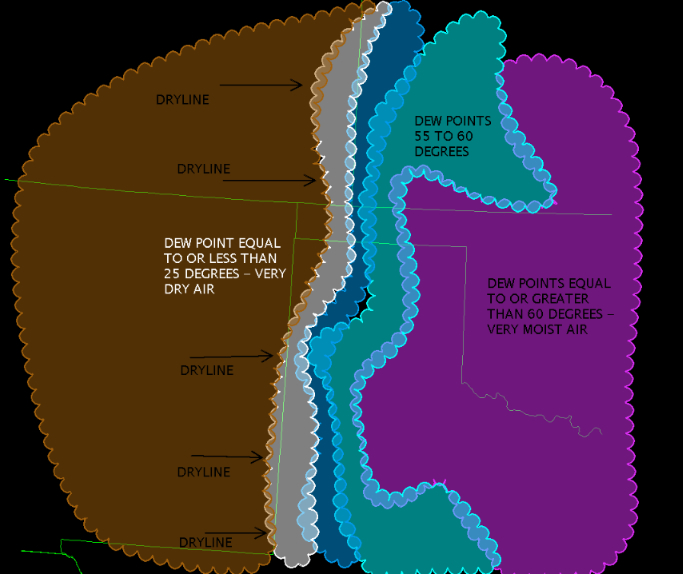 |
|
| The image on the right shows the 18Z (or 1:00 p.m. CDT) upper air sounding from the National Weather Service in Amarillo (graph courtesy of the Storm Prediction Center). You can click on this image to enlarge. From this graph, we can recognize just how much moisture is in the air. The green line shows the dew point temperature and the red line shows the air temperature as the weather balloon moves up through the atmosphere. The key in recognizing the amount of applicable moisture in the air is noticing the distance between the two lines. When the lines are close (as they are in this case) then it means the moisture content is high (you would find high relative humidities). Whereas lines that are spread far apart means that the atmosphere is very dry. |
|
|
|
A second feature that a trained eye might see in this graph is the fact that the winds are "sheared". The arrows, or wind barbs, on this graph indicate the direction the winds are coming from and their intensity. Notice that if you laid a compass on the graph, you could tell that the winds near the bottom of the graph are pointing from the southeast. And as you move up in the atmosphere, the winds start to veer (or turn) to the south, then to the southwest. This makes sense considering our upper level low pressure system that was pushing south or southwest winds into the Panhandles. Now, when you have winds near the surface blowing from southeast near the ground and winds blowing from the southwest aloft, this is known as wind shear. Wind shear is what produces rotating storms and eventually tornadoes. The last ingredient for thunderstorms is instability. This is basically the energy in the atmosphere. The graph above also measures instability or energy, something called "CAPE" (Convective Available Potential Energy). In this case, the CAPE values were extremely high, which means that the atmosphere was very unstable. Knowing all of these ingredients were in place (moisture, lift, instability, and wind shear), there was a high probability that severe storms were likely with some storms possibly producing tornadoes. In fact, since many of these ingredients were so plentiful, there was also good indication that a few of the tornadoes could become strong (EF-3 or higher. |
||