Showers and Thunderstorms from the Southern Plains into the Mid-Mississippi Valley; Record Warmth in the Plains and Midwest
Heavy rain and widely scattered severe storms capable of large hail, damaging winds, and possibly a tornado are expected over portions of the central and southern Plains into the Lower Missouri Valley. Unseasonable warmth will continue for a few more days across the Midwest and Southeast where several daily record highs could fall.
Read More >
These graphics are updated around 2AM CDT
They can be magnified (enlarged) by left clicking on them, and resized back to original size with a second click.
Please see county-specific tabs above for additional graphics.
What is Heat Index?
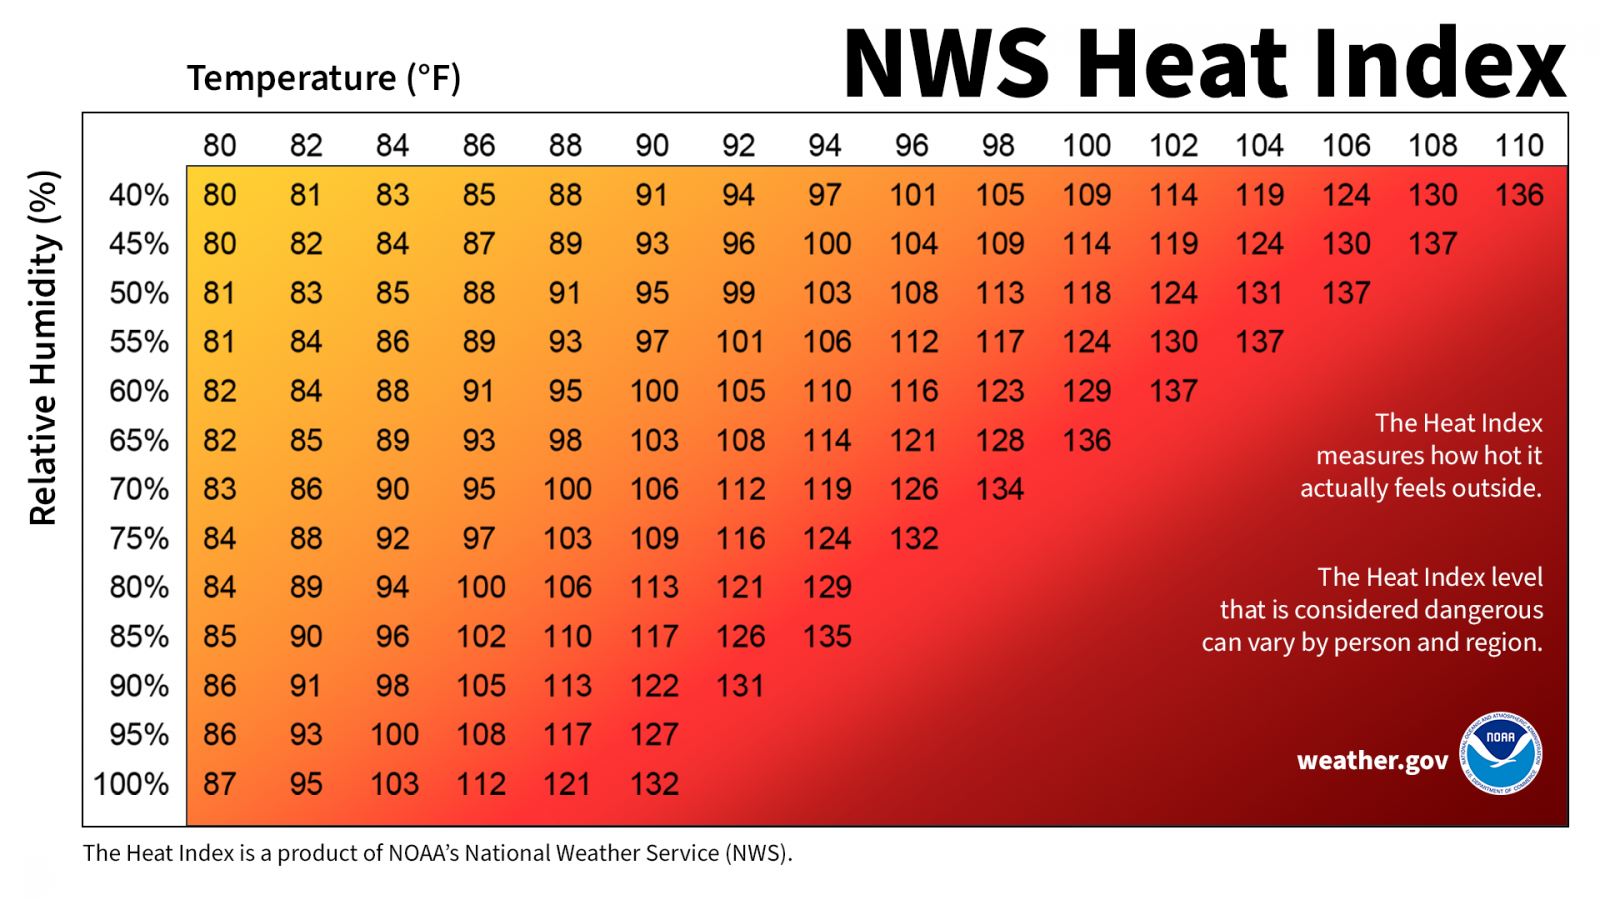
The Heat Index is a measure of how hot it really feels when relative humidity is factored in with the actual air temperature. To find the Heat Index temperature, look at the Heat Index Chart below or check our Heat Index Calculator. As an example, if the air temperature is 96°F and the relative humidity is 65%, the heat index--how hot it feels--is 121°F. The red area without numbers indicates extreme danger. The National Weather Service will initiate alert procedures when the Heat Index is expected to exceed 105°-110°F (depending on local climate) for at least 2 consecutive days.
NWS also offers a Heat Index chart for areas with high heat but low relative humidity. Since heat index values were devised for shady, light wind conditions, exposure to full sunshine can increase heat index values by up to 15°F. Wet Bulb Globe Temperature is generally a preferred heat metric for strenuous activities in direct sunlight.
What is Wet Globe Temperature?
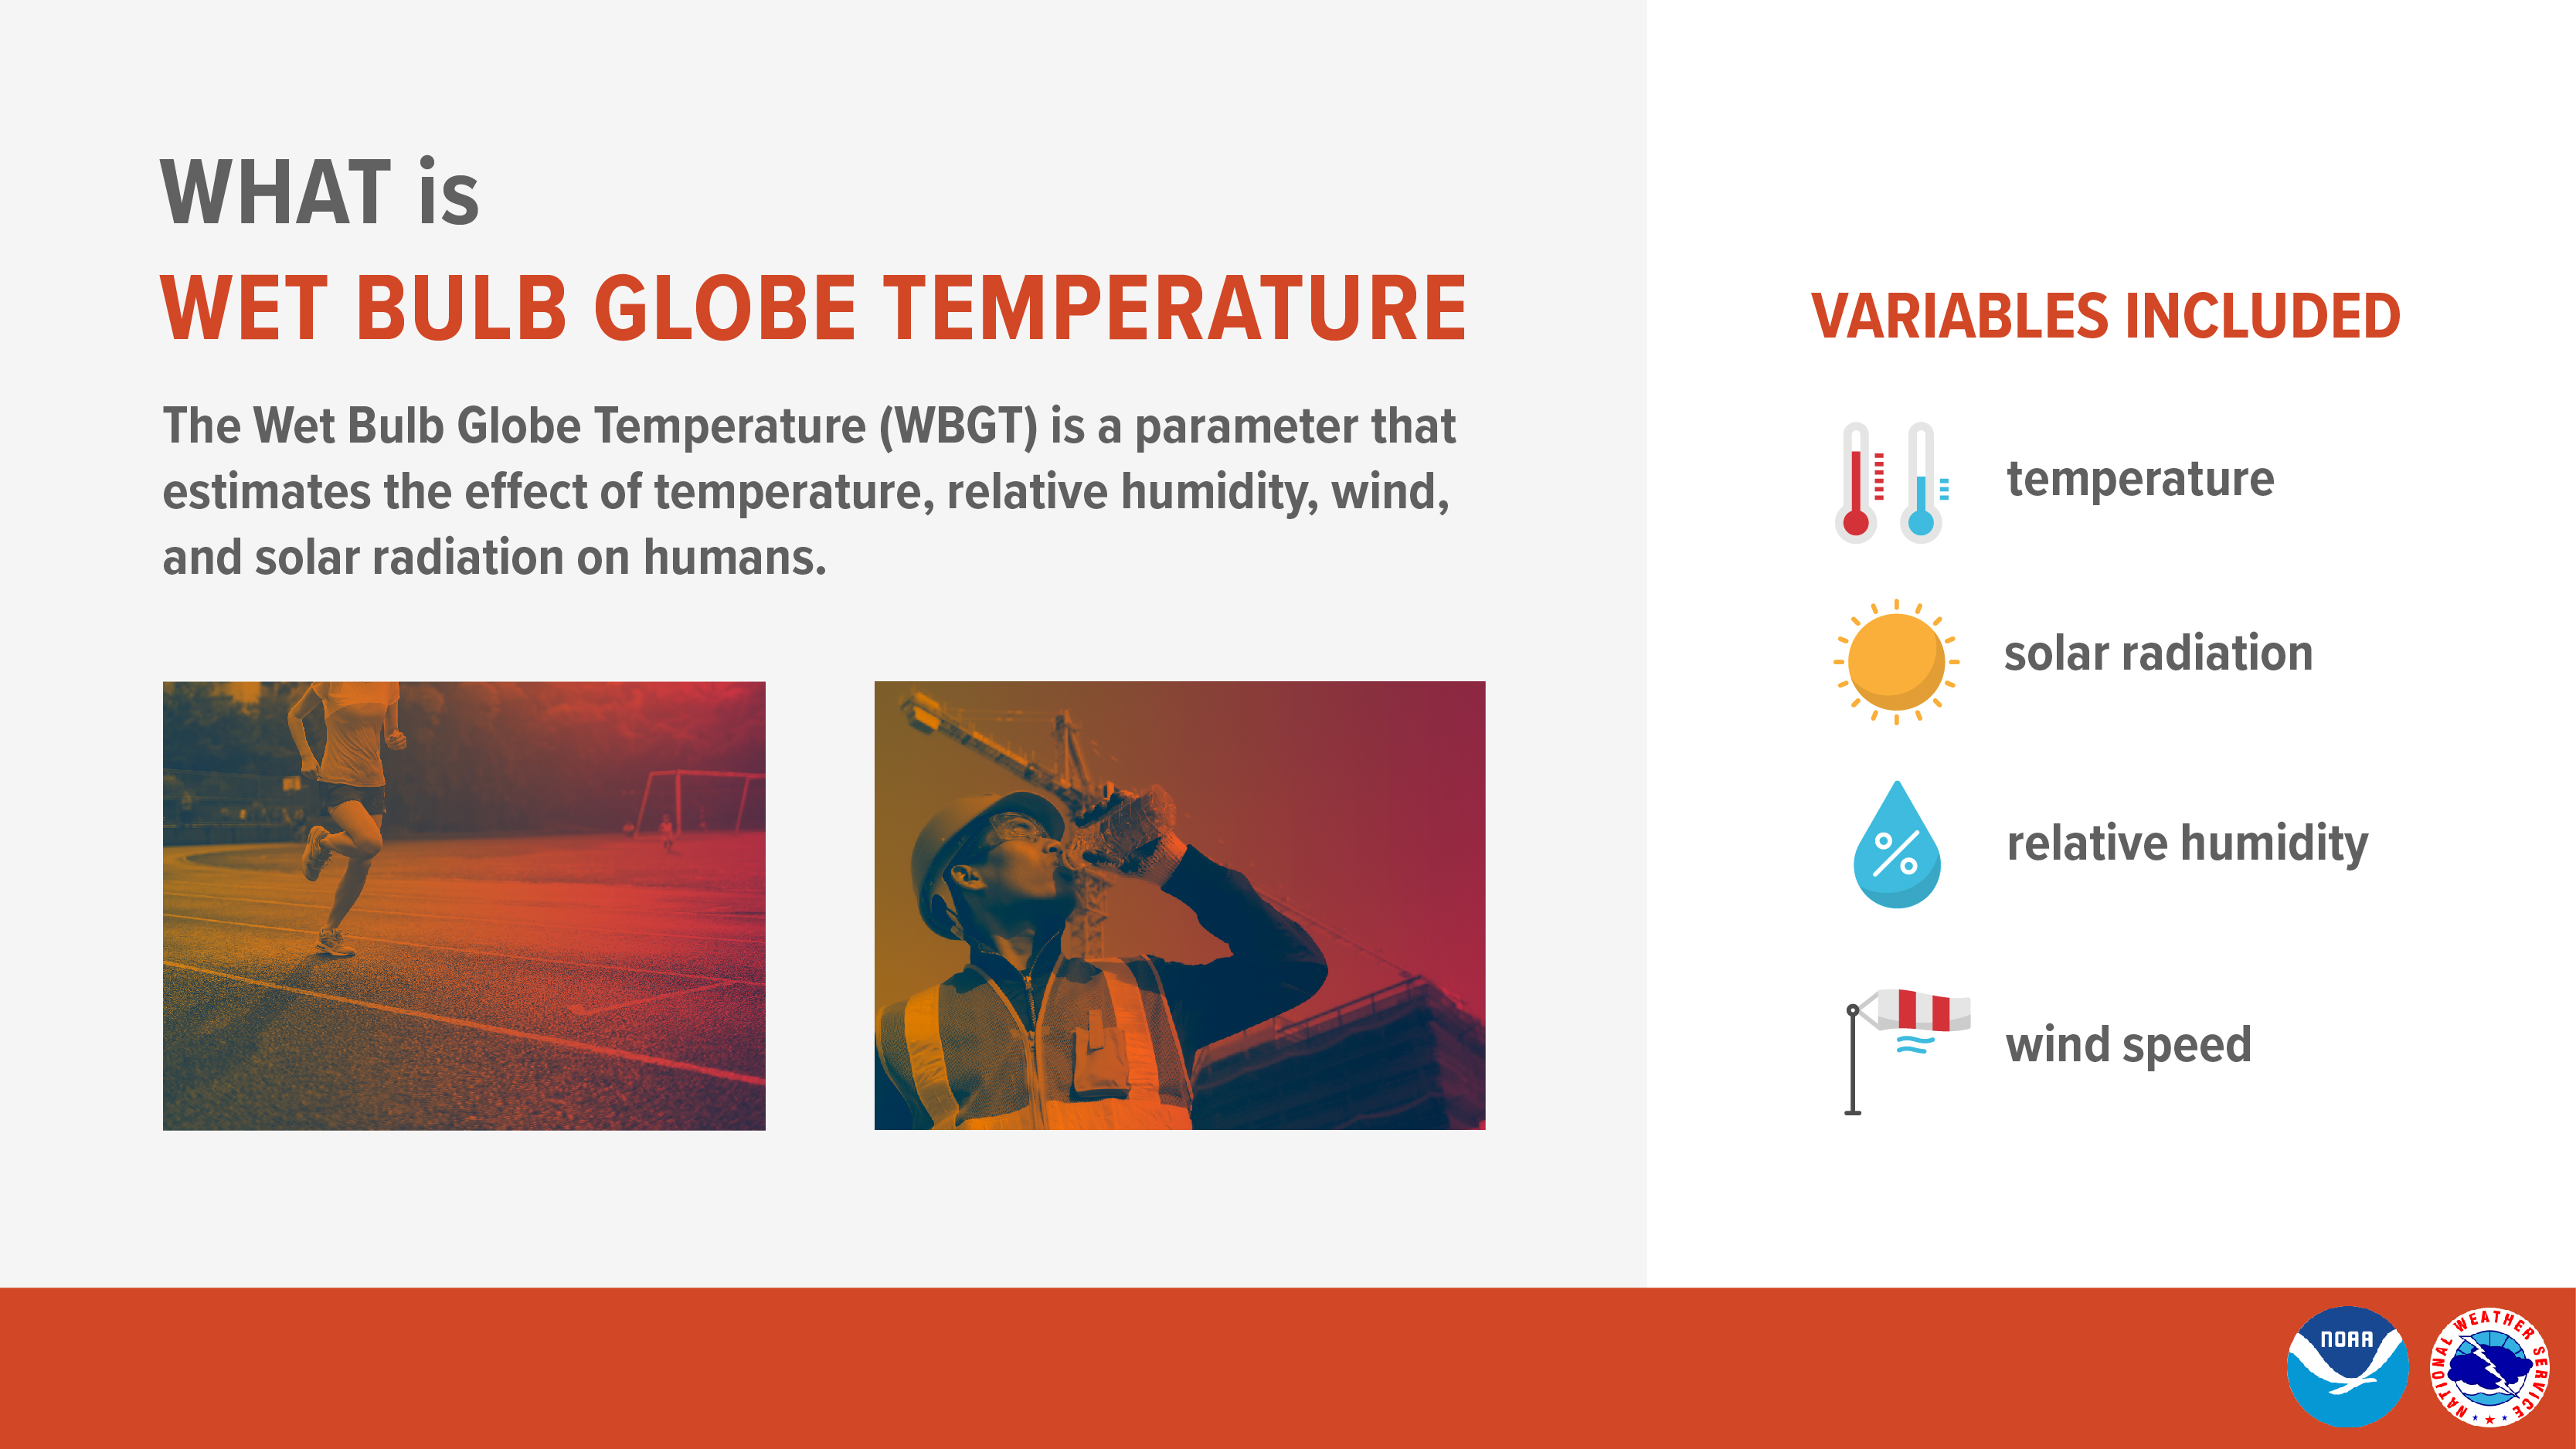
What is Wet Bulb Globe Temperature (WBGT)? Check out this handout and video to learn about WBGT.
WBGT uses temperature, humidity, wind, solar radiation, and other weather parameters. It’s a particularly effective indicator of heat stress for active populations such as outdoor workers and athletes working in direct sunlight.
WBGT can be used to inform activity modifications during exercise or outdoor work. For instance, The American College of Sports Medicine bases its guidelines for the intensity of sport practices on WBGT, and it is therefore utilized by athletic programs in many school districts.
The Occupational Safety and Health Administration (OSHA) recommends protective measures for outdoor work:
Acclimatize workers starting the first day working in the heat and after any extended absences
Provide shade for outdoor work sites
Schedule work earlier or later in the day
Use work/rest schedules
Limit strenuous work (eg., carrying heavy loads)
Use relief workers when needed
What is HeatRisk?
The purpose of the experimental NWS HeatRisk service is to place the upcoming forecast of temperatures into climatological context and identify upcoming heat events that will lead to increased heat-related health impacts. To make it easier to understand, the HeatRisk is divided into five categories:
Simply put, the higher the value, the greater the level of heat concern would be for that location and the higher the risk of heat-related impacts.
Essentially when HeatRisk values are 1 or greater, heat is considered to be of increasing concern – at first for those who are extremely sensitive to heat, then for everyone exposed to heat as HeatRisk values get to the highest levels. For example, a HeatRisk value of 0 represents little to no risk of heat-related impacts; a HeatRisk value of 2 represents a moderate risk of heat-related impacts, primarily amongst those individuals who are sensitive to heat and/or exposed to heat, especially those without effective cooling and/or adequate hydration; while a HeatRisk value of 3 represents a major risk of heat-related impacts affecting all individuals without proper hydration and adequate cooling. If both the overnight lows and daytime highs are exceptionally warm for that date (i.e. in the upper 5% of the historical daily temperature distribution) at a given location over a period of at least 48 hours, at levels that pose an elevated risk for heat complications, the highest level of 4 for HeatRisk is achieved. These higher levels of HeatRisk also identify increasing risk of impacts throughout health systems, heat-sensitive industries, and infrastructure.
The NWS has assigned a specific color to each HeatRisk category to make it easier for people to understand quickly whether heat is reaching a high enough level to potentially cause heat concerns for their unique situation. Each HeatRisk category corresponds to a different level of potential heat-related impacts. The five levels of HeatRisk and what they mean are shown in the table below.
For additional information about the differences between each NWS heat product, please see this document.
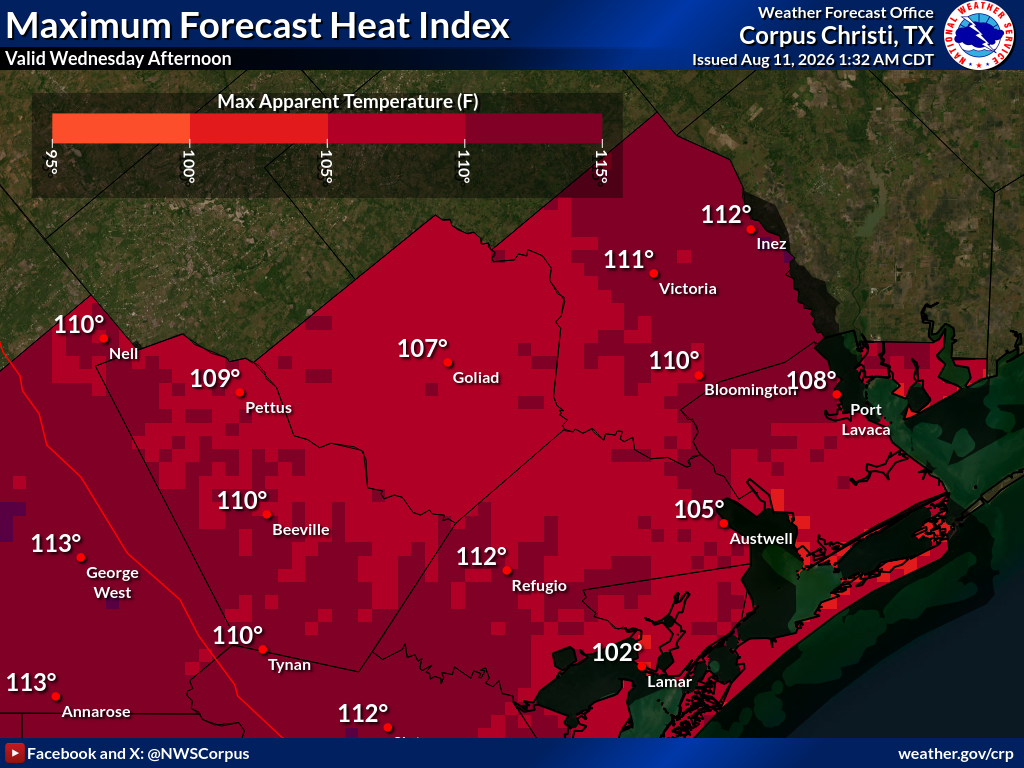
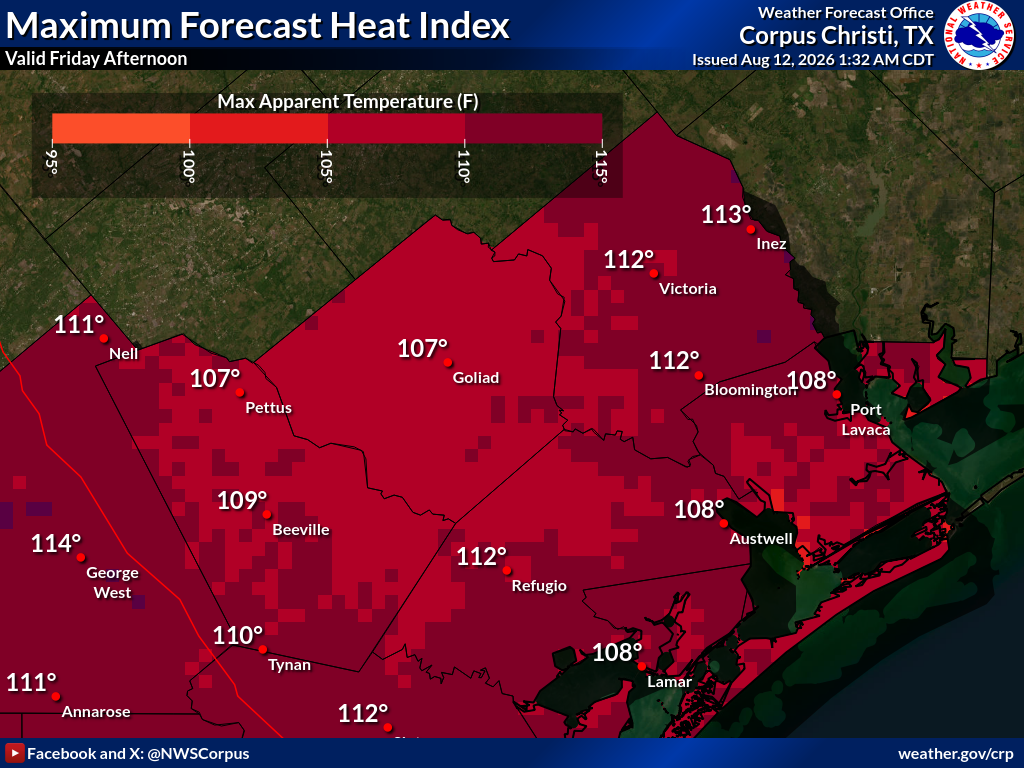
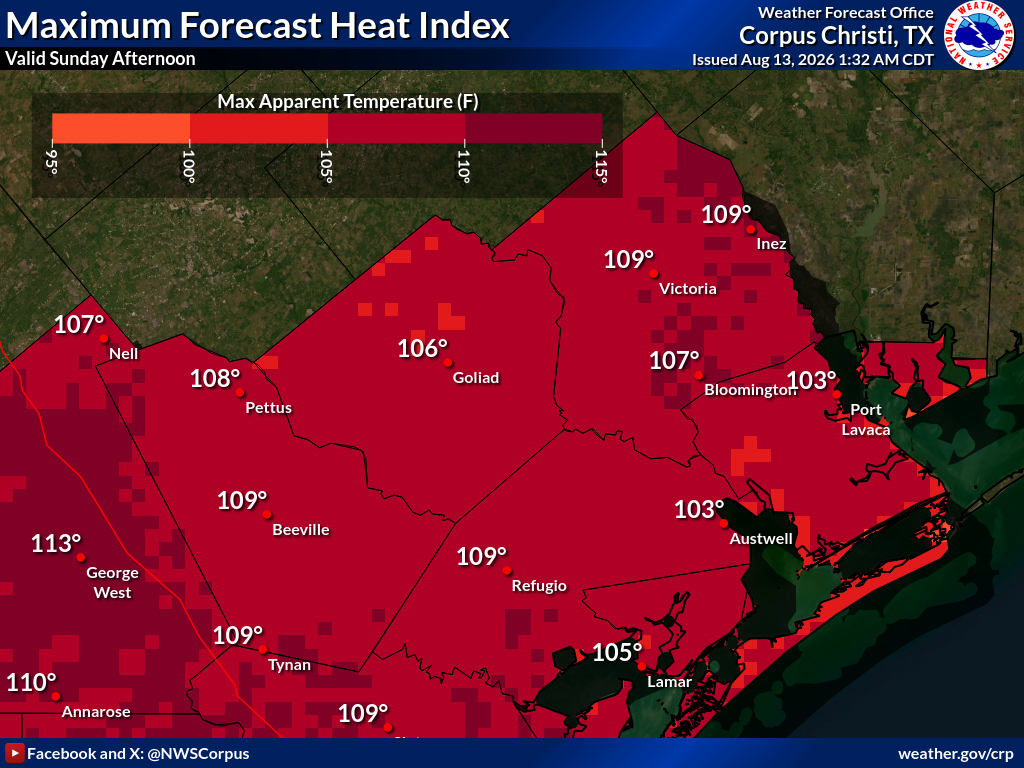
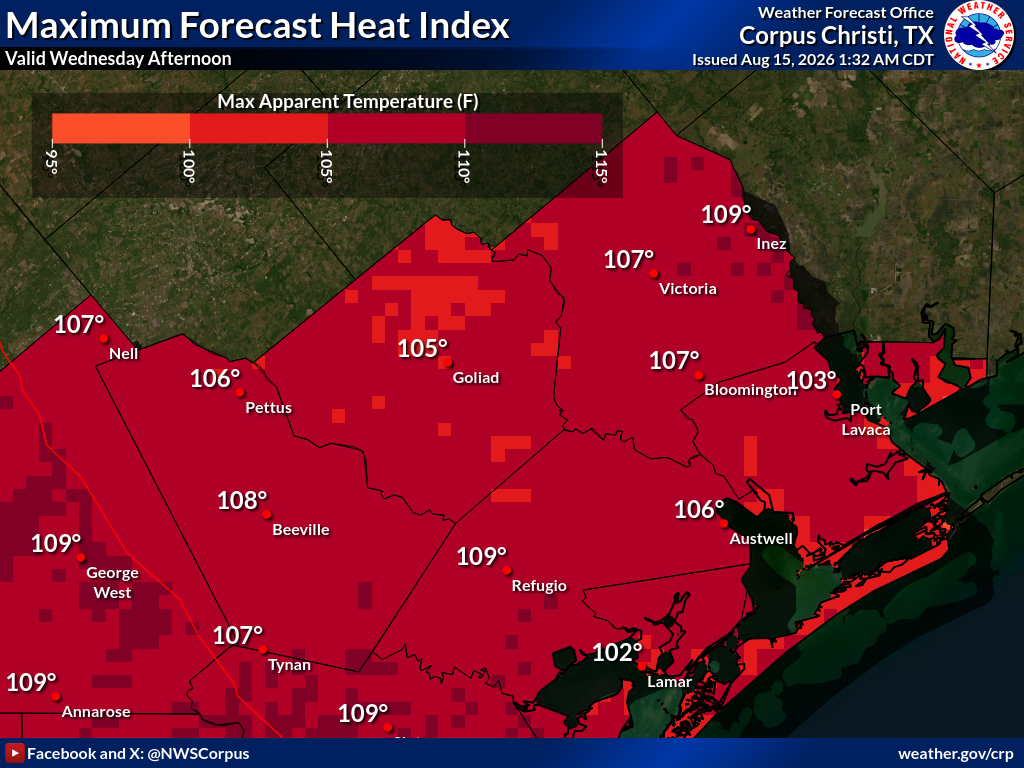
Expected Heat Index (°F) for the Victoria Crossroads
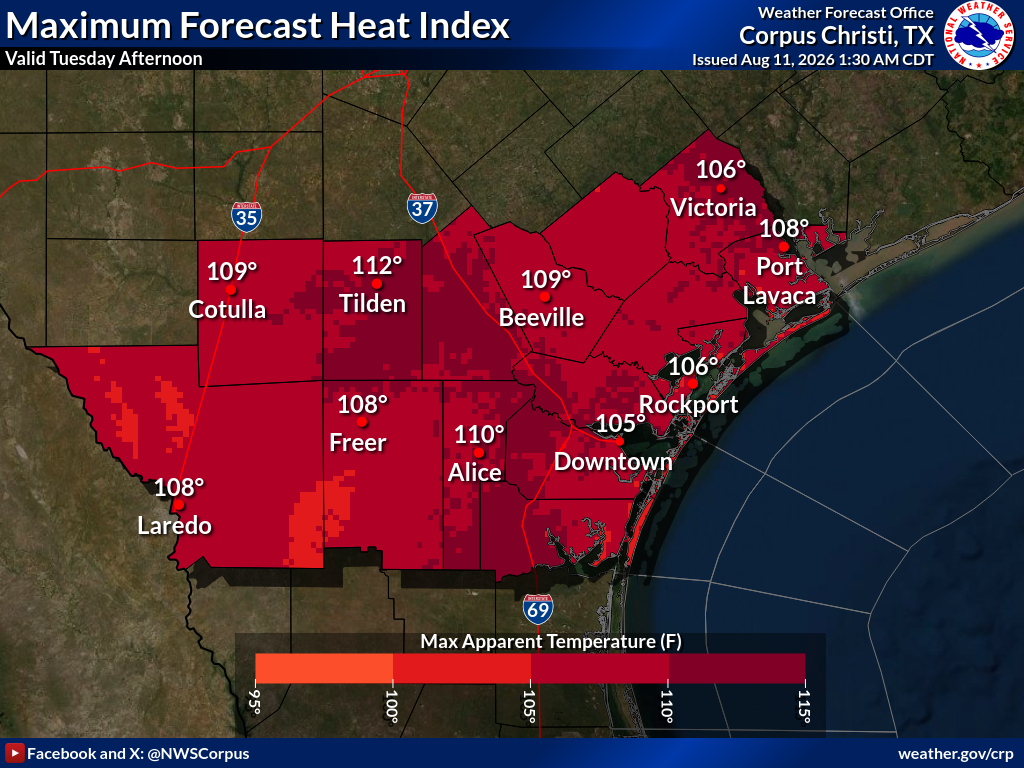
These maps are the official NWS heat index temperature forecast in degrees Fahrenheit during the time period shown on the graphic. These heat index values are determined by NWS forecasters to be the most likely outcome based on evaluation of data from computer models, satellite, radar, and other observations.
Day 1
Day 2
Day 3
Day 4
Day 5
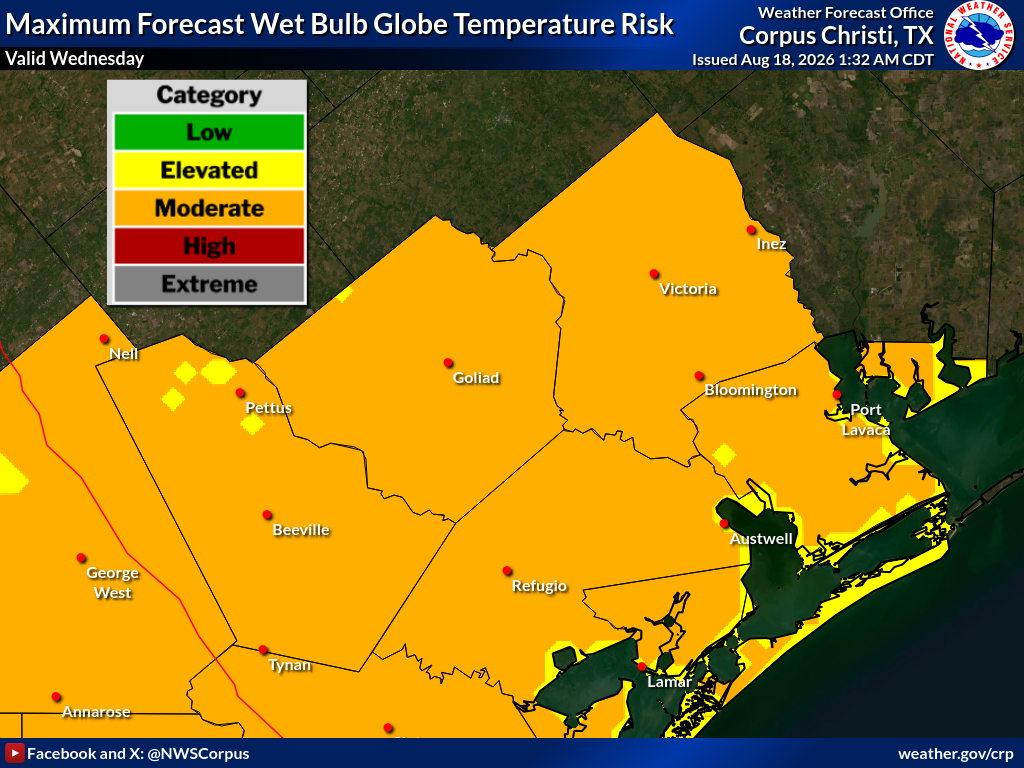
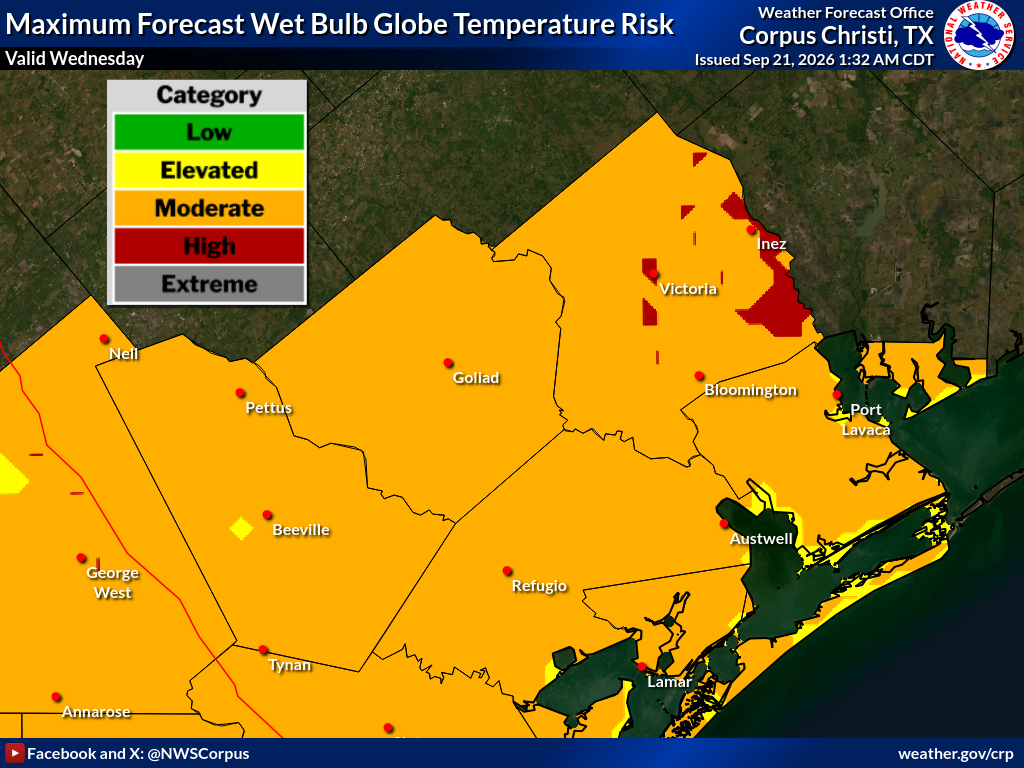
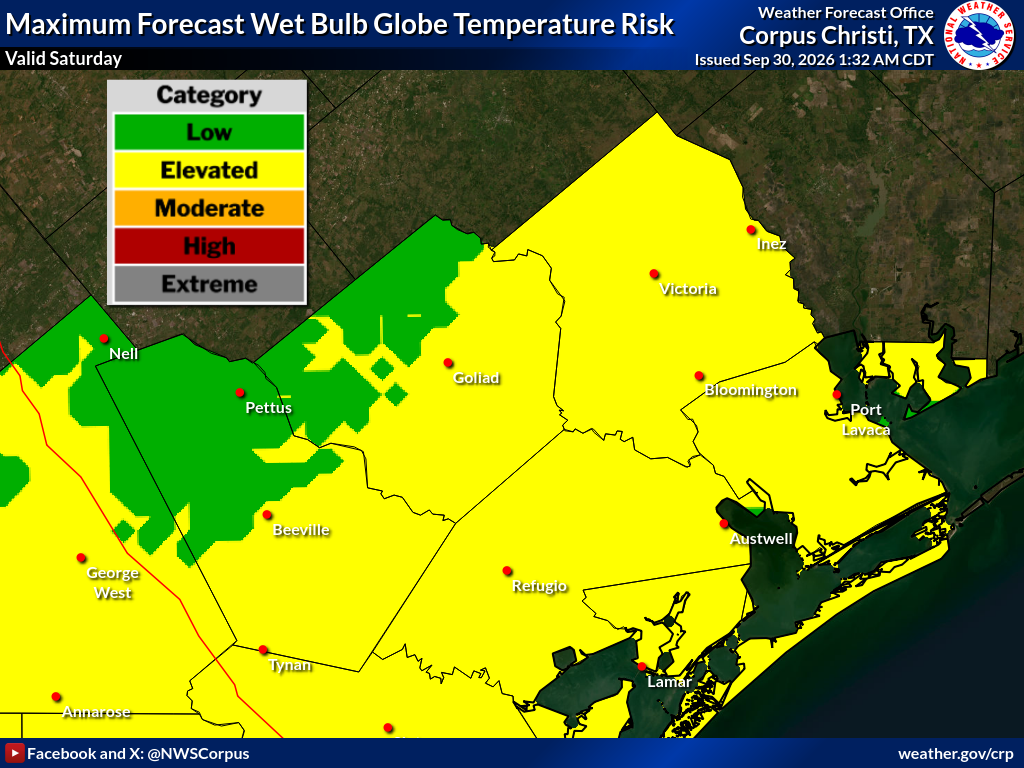
Wet Bulb Globe Temperature Risk for the Victoria Crossroads
The Wet Bulb Globe Temperature (WBGT) is an indicator of heat related stress on the human body at work (or play) in direct sunlight. It takes into account multiple atmospheric variables, including: temperature, humidity, wind speed, sun angle, and cloud cover. Military agencies, OSHA, activities associations and many others use the WBGT Risk as a guide to managing workload or activity level. These graphics don't depict the actual WBGT forecast, but rather will depict the associated risk level for each given time period. The risk categories are based upon the class 3 thresholds in this image
Day 1
Day 2
Day 3
Day 4
Day 5
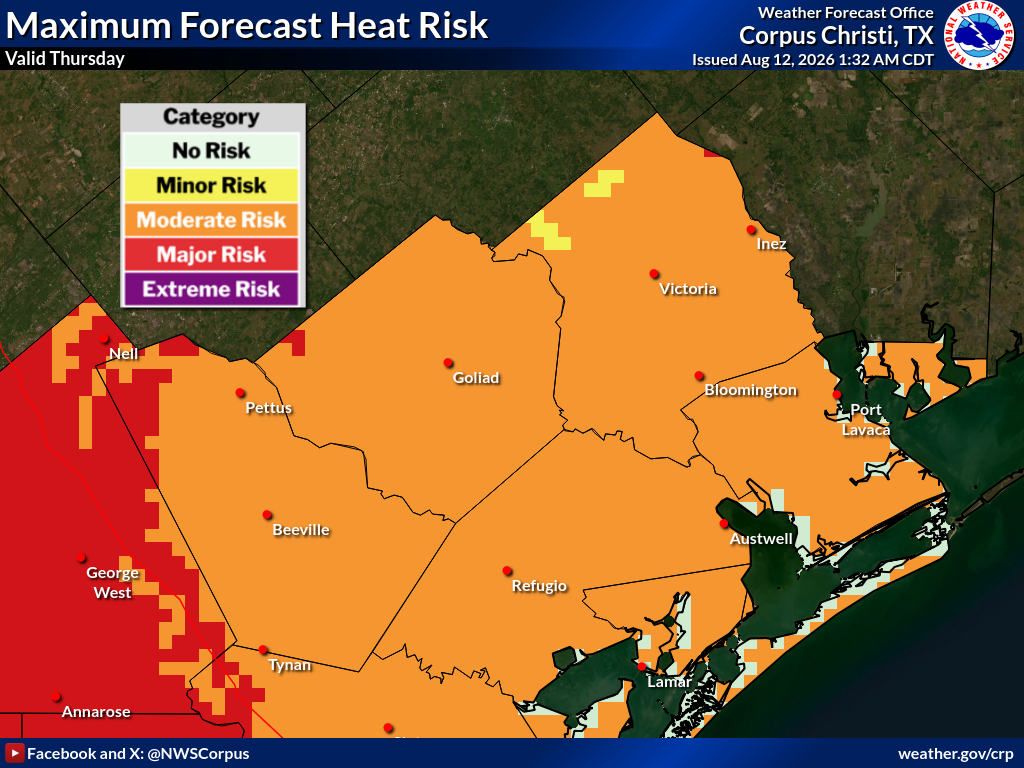
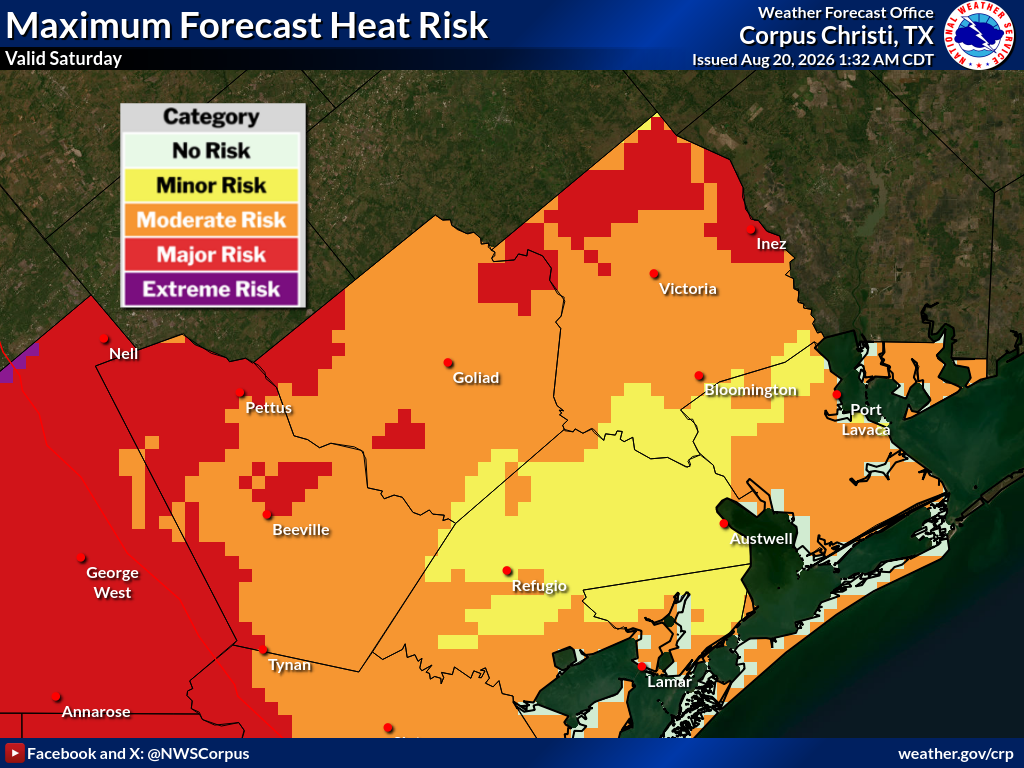
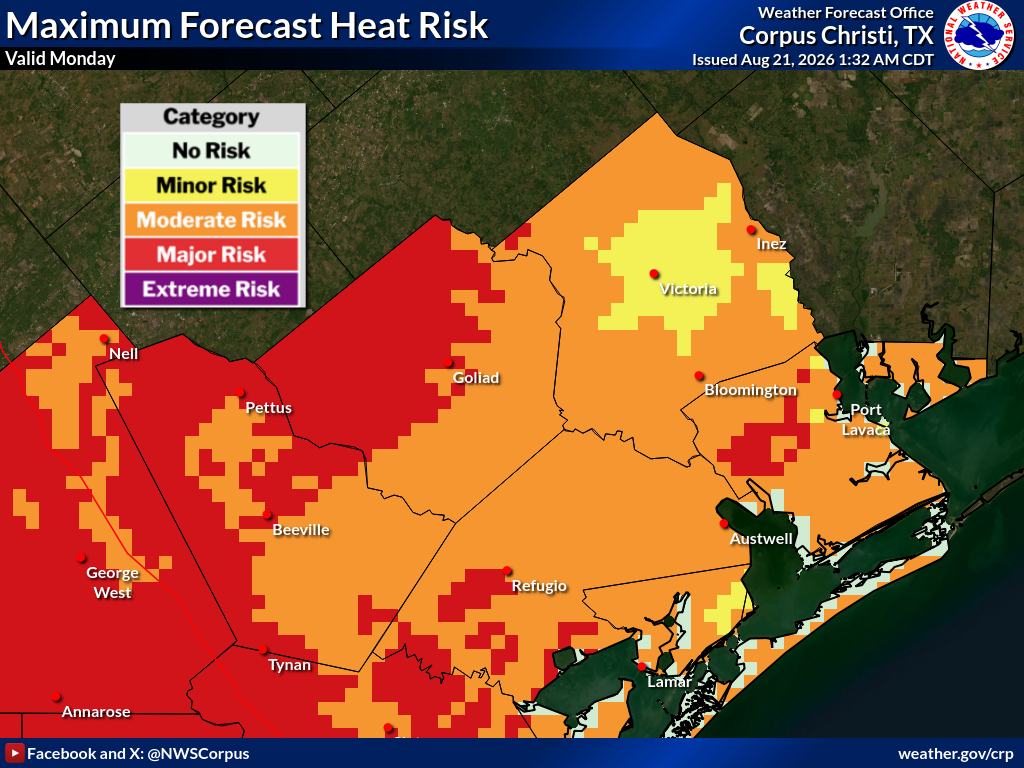
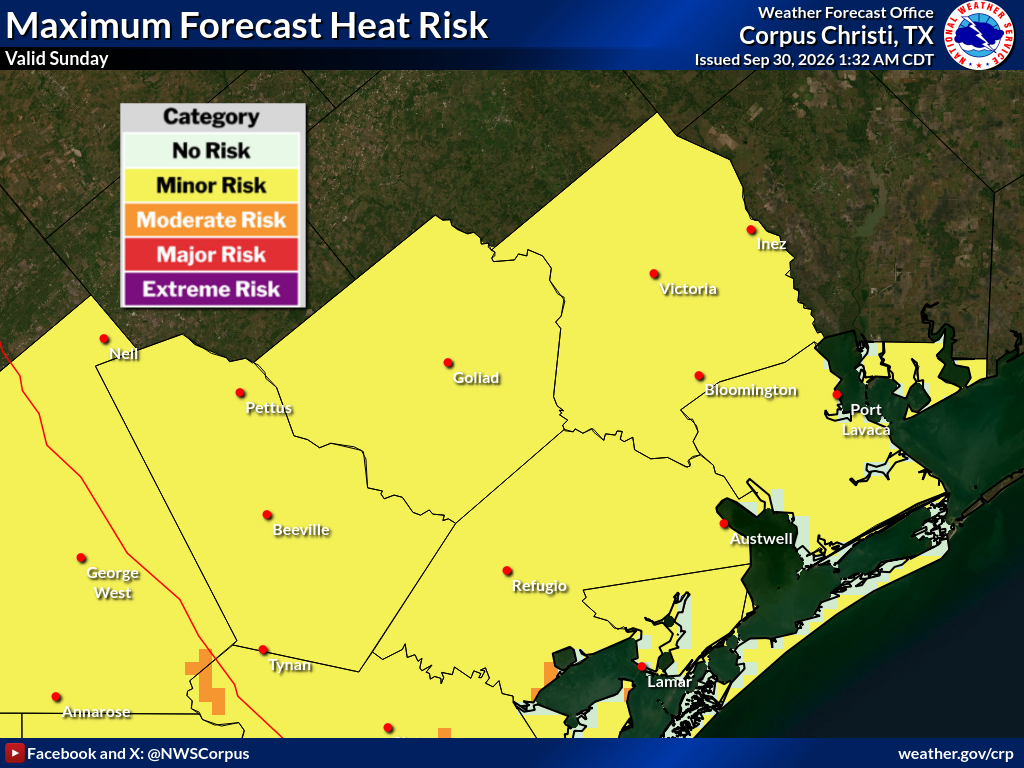
HeatRisk for the Victoria Crossroads
The NWS HeatRisk is an experimental color-numeric-based index that provides a forecast risk of heat-related impacts to occur over a 24-hour period. This index is supplementary to official NWS heat products and is meant to provide risk guidance for those decision makers and heat-sensitive populations who need to take actions at levels that may be below current NWS heat product levels.
Day 1
Day 2
Day 3
Day 4
Day 5
For additional information about the differences between each NWS heat product, please see this document.
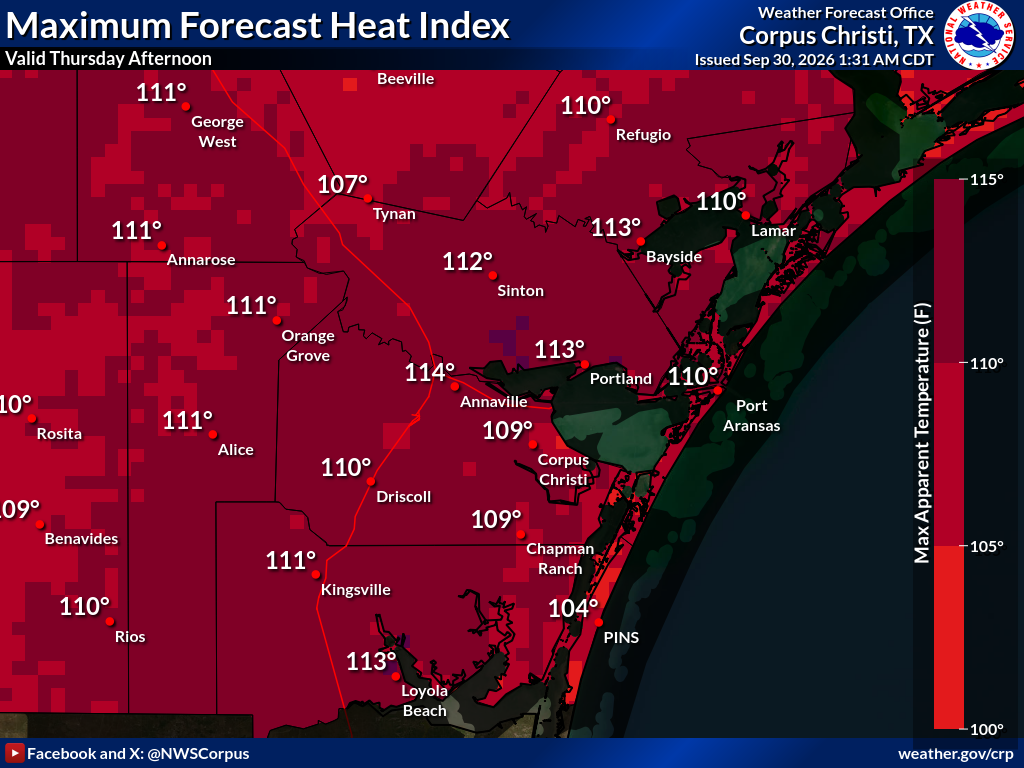
Expected Heat Index (°F) for the Corpus Christi area
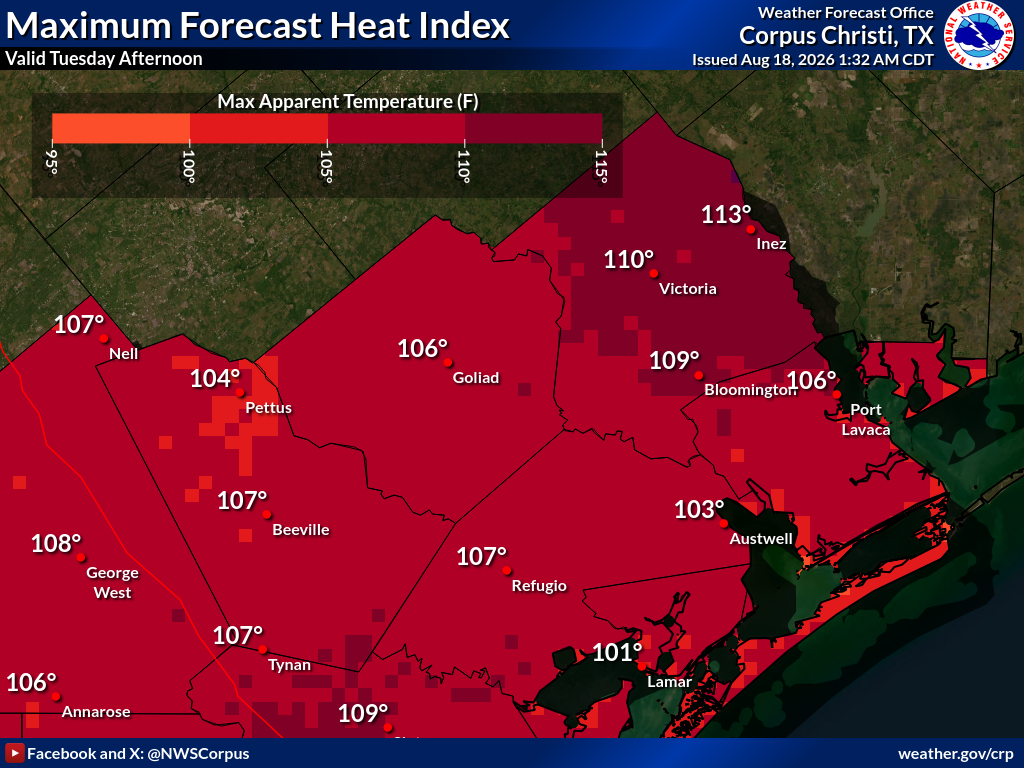
These maps are the official NWS heat index temperature forecast in degrees Fahrenheit during the time period shown on the graphic. These heat index temperatures are determined by NWS forecasters to be the most likely outcome based on evaluation of data from computer models, satellite, radar, and other observations.
Day 1
Day 2
Day 3
Day 4
Day 5
Wet Bulb Globe Temperature Risk for the Corpus Christi area
The Wet Bulb Globe Temperature (WBGT) is an indicator of heat related stress on the human body at work (or play) in direct sunlight. It takes into account multiple atmospheric variables, including: temperature, humidity, wind speed, sun angle, and cloud cover. Military agencies, OSHA, activities associations and many others use the WBGT Risk as a guide to managing workload or activity level. These graphics don't depict the actual WBGT forecast, but rather will depict the associated risk level for each given time period. The risk categories are based upon the class 3 thresholds in this image
Day 1
Day 2
Day 3
Day 4
Day 5
HeatRisk for the Corpus Christi area
The NWS HeatRisk is an experimental color-numeric-based index that provides a forecast risk of heat-related impacts to occur over a 24-hour period. This index is supplementary to official NWS heat products and is meant to provide risk guidance for those decision makers and heat-sensitive populations who need to take actions at levels that may be below current NWS heat product levels.
Day 1
Day 2
Day 3
Day 4
Day 5
For additional information about the differences between each NWS heat product, please see this document.
Expected Heat Index (°F) for the Laredo Area
These maps are the official NWS heat index temperature forecast in degrees Fahrenheit during the time period shown on the graphic. These heat index temperatures are determined by NWS forecasters to be the most likely outcome based on evaluation of data from computer models, satellite, radar, and other observations.
Day 1
Day 2
Day 3
Day 4
Day 5
Wet Bulb Globe Temperature Risk for the Laredo Area
The Wet Bulb Globe Temperature (WBGT) is an indicator of heat related stress on the human body at work (or play) in direct sunlight. It takes into account multiple atmospheric variables, including: temperature, humidity, wind speed, sun angle, and cloud cover. Military agencies, OSHA, activities associations and many others use the WBGT Risk as a guide to managing workload or activity level. These graphics don't depict the actual WBGT forecast, but rather will depict the associated risk level for each given time period. The risk categories are based upon the class 3 thresholds in this image
Day 1
Day 2
Day 3
Day 4
Day 5
HeatRisk for the Laredo area
The NWS HeatRisk is an experimental color-numeric-based index that provides a forecast risk of heat-related impacts to occur over a 24-hour period. This index is supplementary to official NWS heat products and is meant to provide risk guidance for those decision makers and heat-sensitive populations who need to take actions at levels that may be below current NWS heat product levels.
Day 1
Day 2
Day 3
Day 4
Day 5
For additional information about the differences between each NWS heat product, please see this document.
Expected Heat Index (°F) for the Brush Country
These maps are the official NWS heat index temperature forecast in degrees Fahrenheit during the time period shown on the graphic. These heat index temperatures are determined by NWS forecasters to be the most likely outcome based on evaluation of data from computer models, satellite, radar, and other observations.
Day 1
Day 2
Day 3
Day 4
Day 5
Wet Bulb Globe Temperature Risk for the Brush Country
The Wet Bulb Globe Temperature (WBGT) is an indicator of heat related stress on the human body at work (or play) in direct sunlight. It takes into account multiple atmospheric variables, including: temperature, humidity, wind speed, sun angle, and cloud cover. Military agencies, OSHA, activities associations and many others use the WBGT Risk as a guide to managing workload or activity level. These graphics don't depict the actual WBGT forecast, but rather will depict the associated risk level for each given time period. The risk categories are based upon the class 3 thresholds in this image
Day 1
Day 2
Day 3
Day 4
Day 5
HeatRisk for the Brush Country
The NWS HeatRisk is an experimental color-numeric-based index that provides a forecast risk of heat-related impacts to occur over a 24-hour period. This index is supplementary to official NWS heat products and is meant to provide risk guidance for those decision makers and heat-sensitive populations who need to take actions at levels that may be below current NWS heat product levels.
Day 1
Day 2
Day 3
Day 4
Day 5
For additional information about the differences between each NWS heat product, please see this document.
Current Wet Bulb Globe Temperature Observations
Interactive Heat Safety & WBGT Dashboard
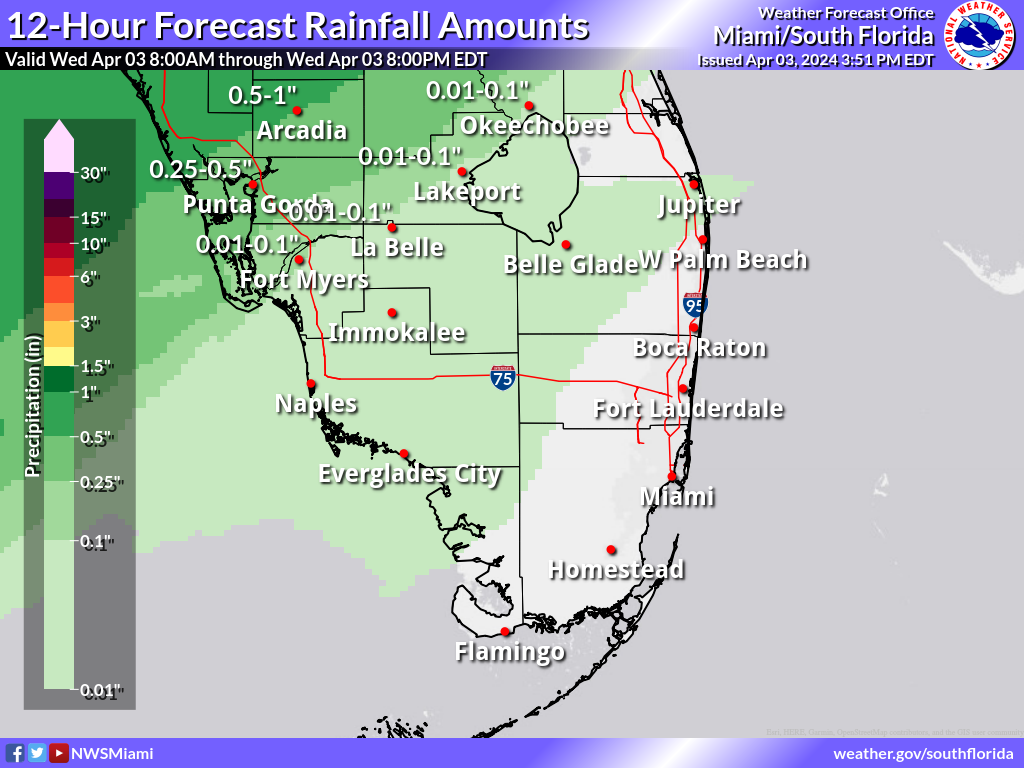
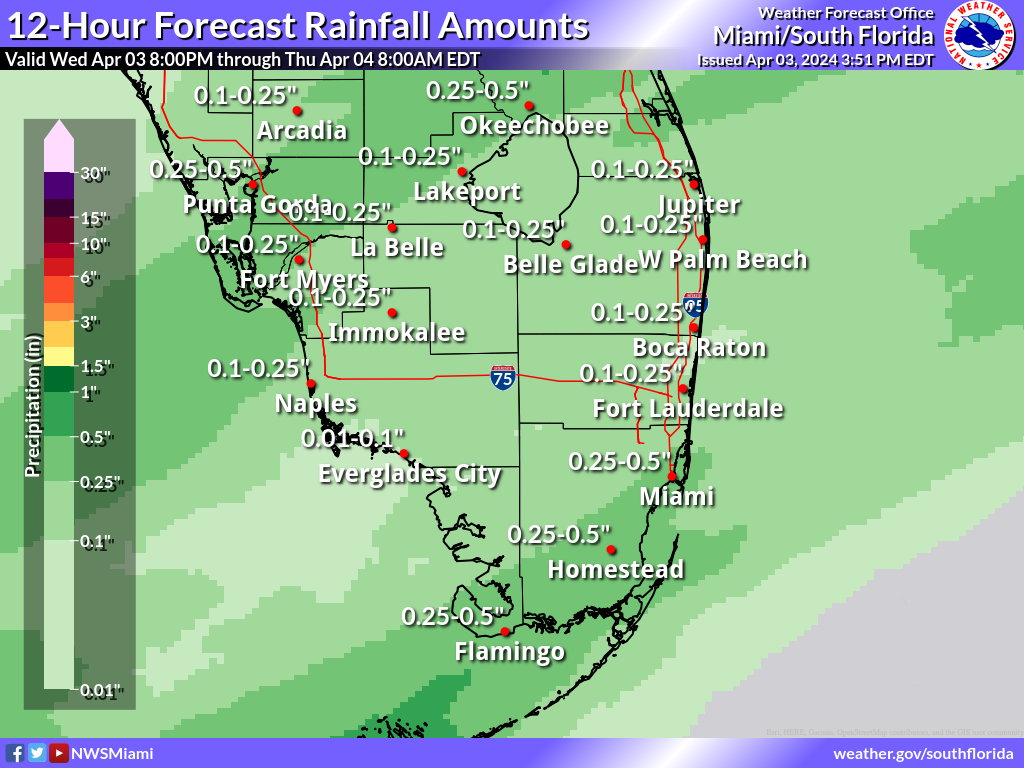
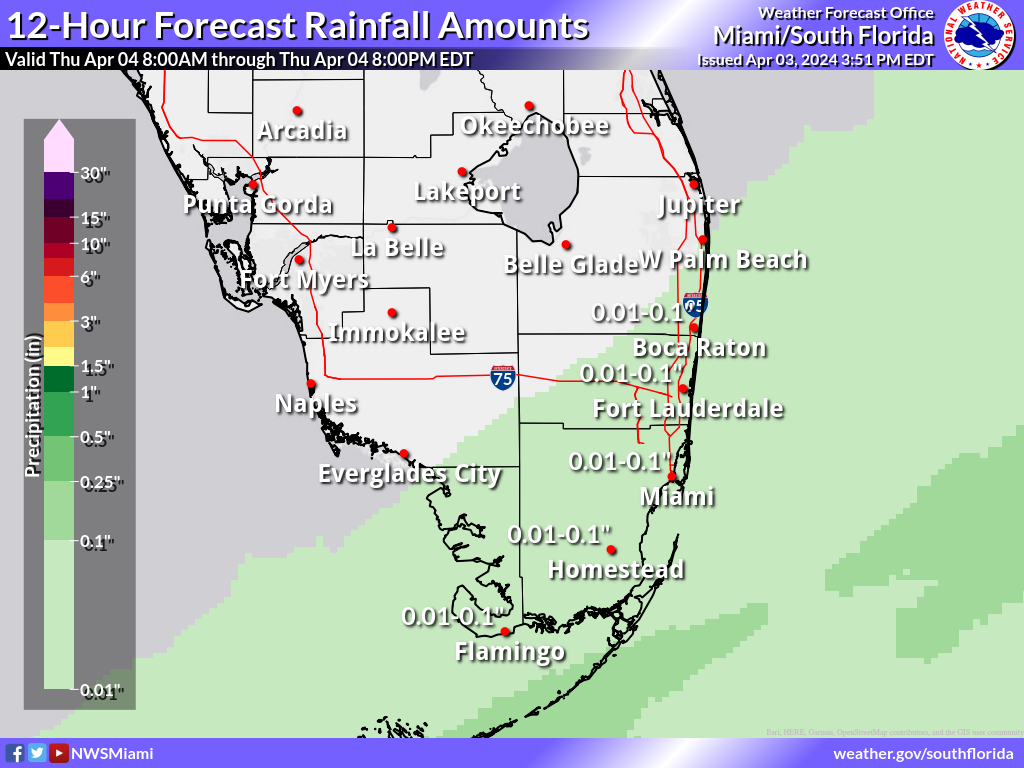
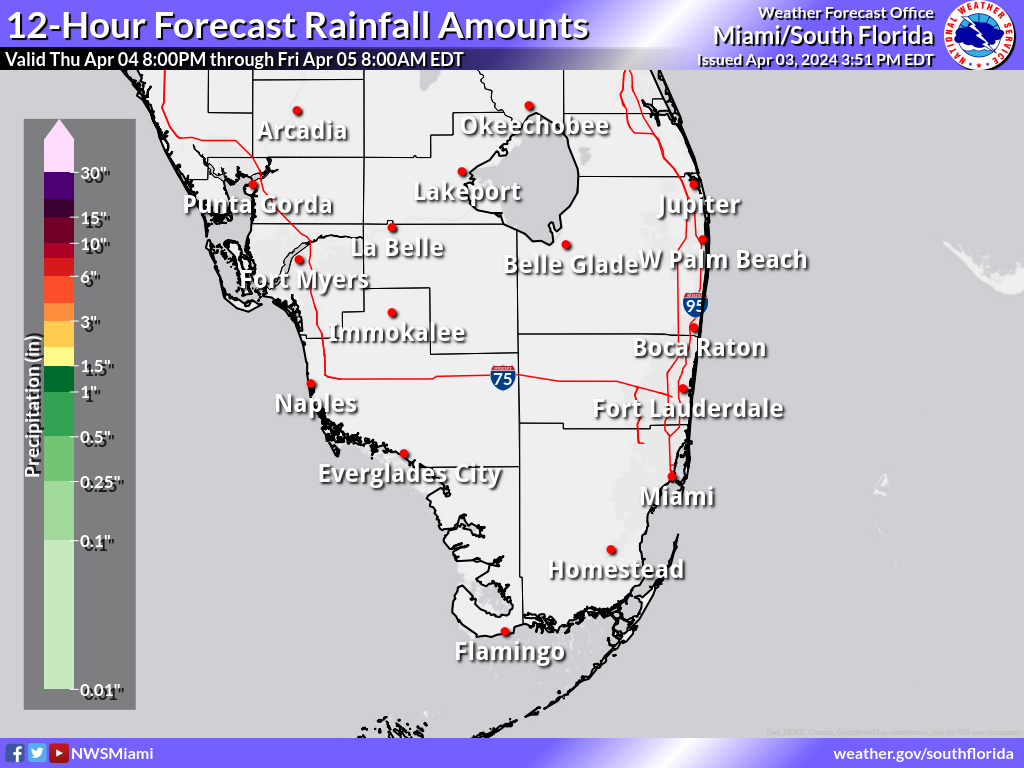
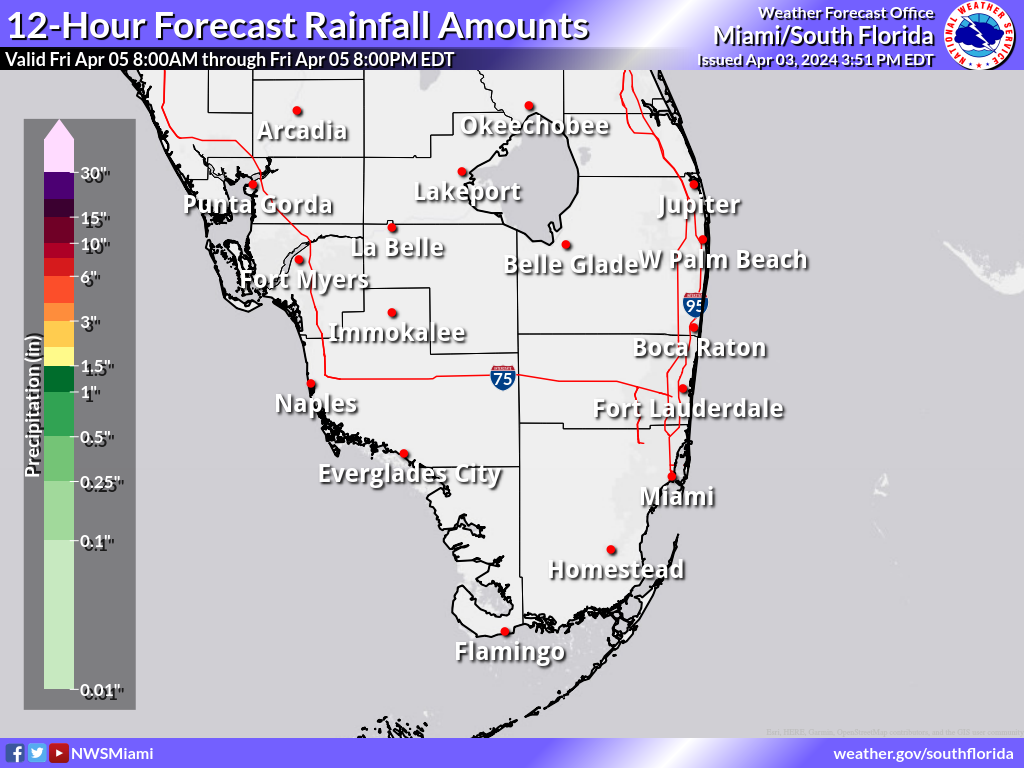
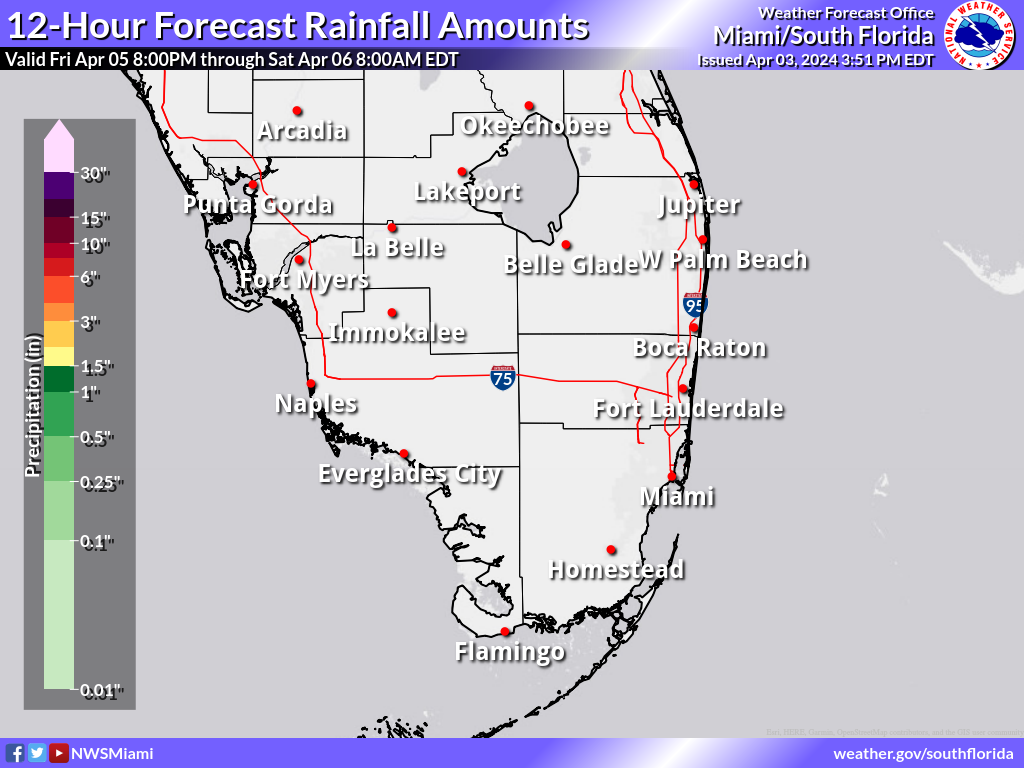
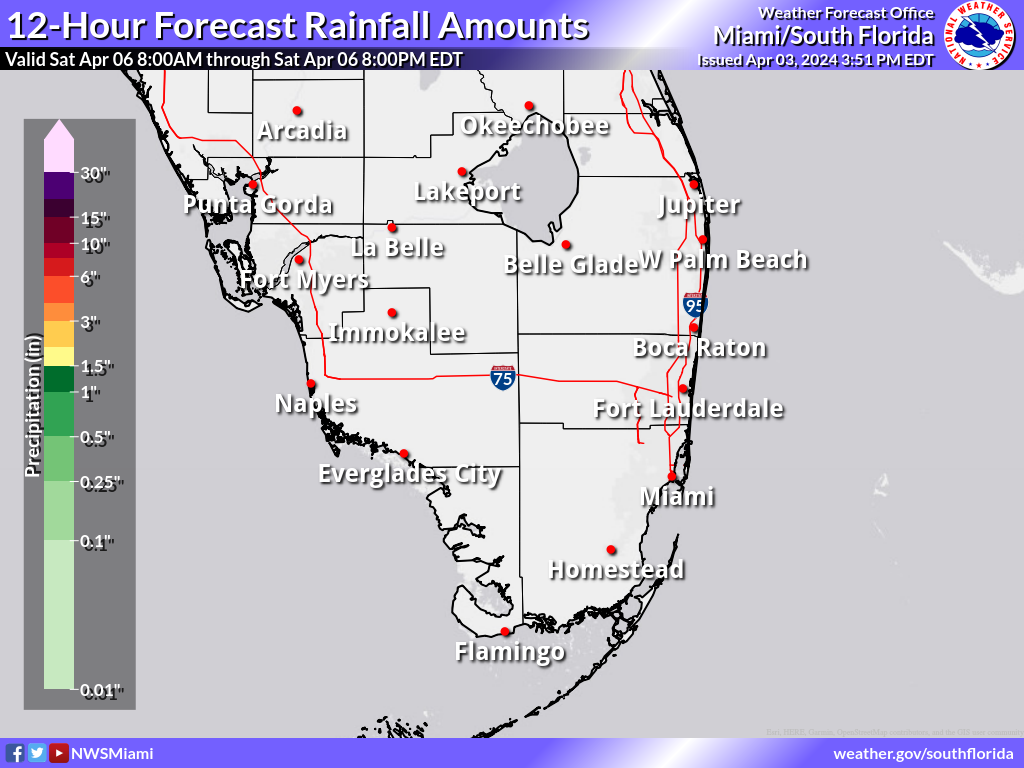
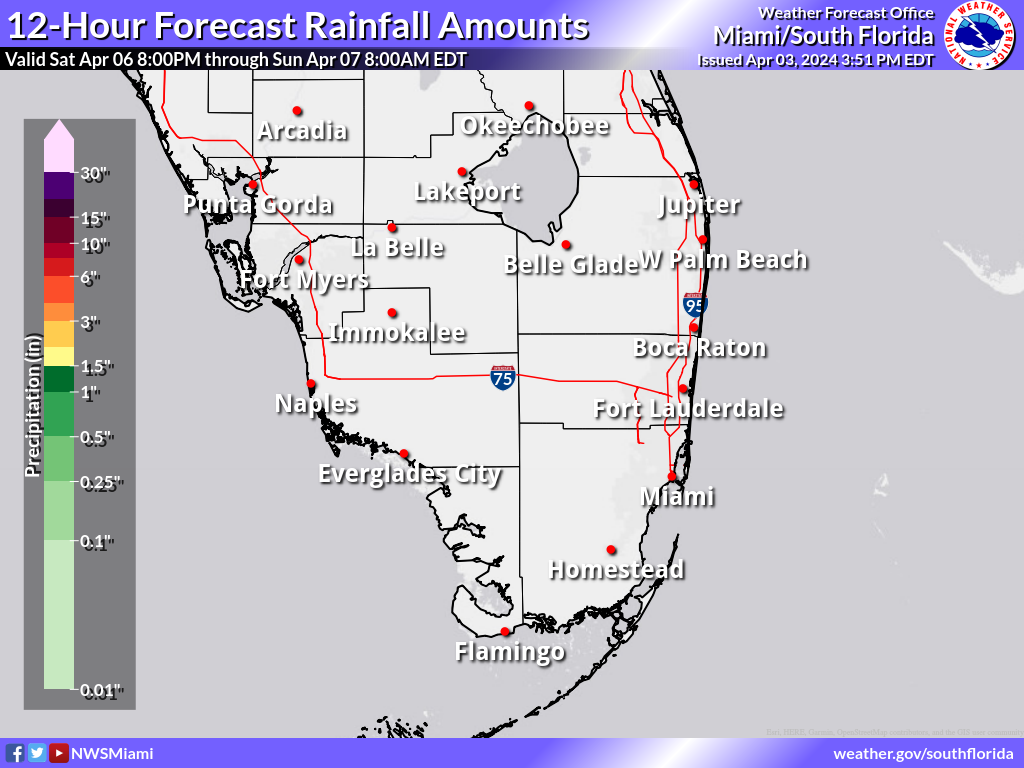
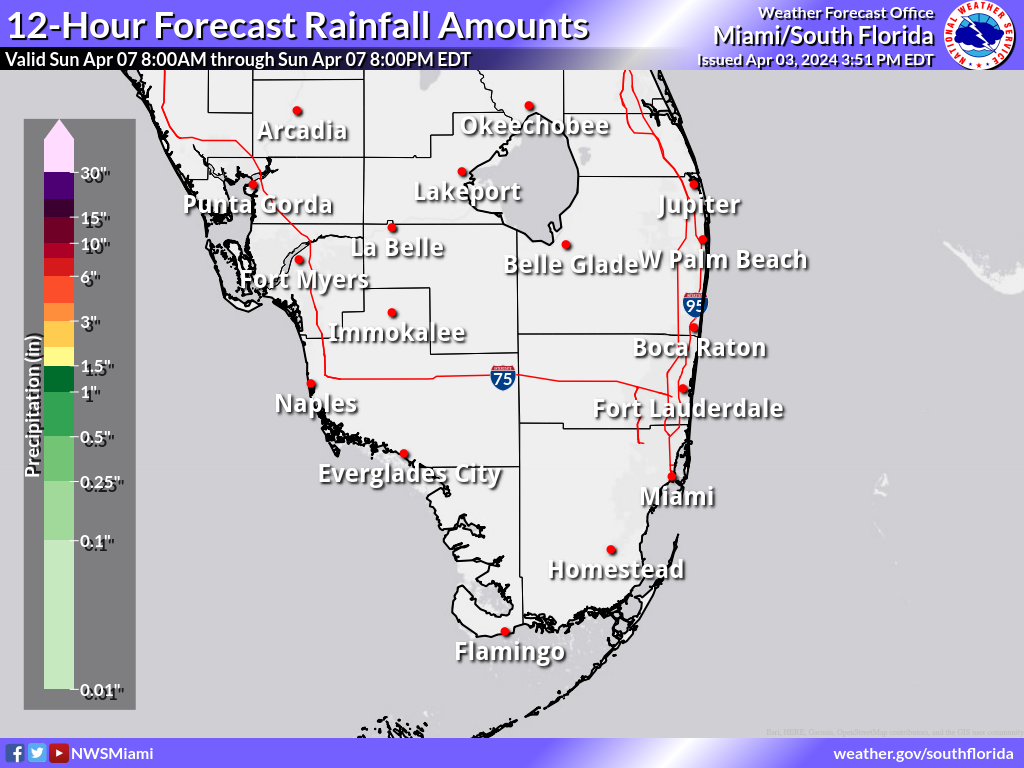
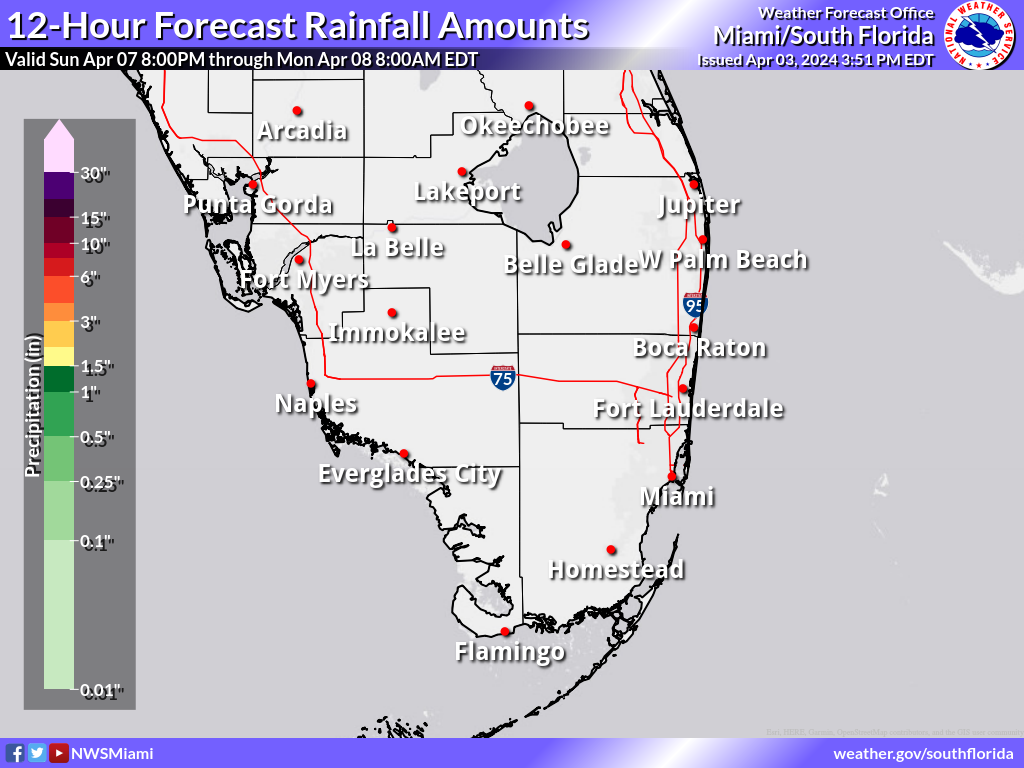
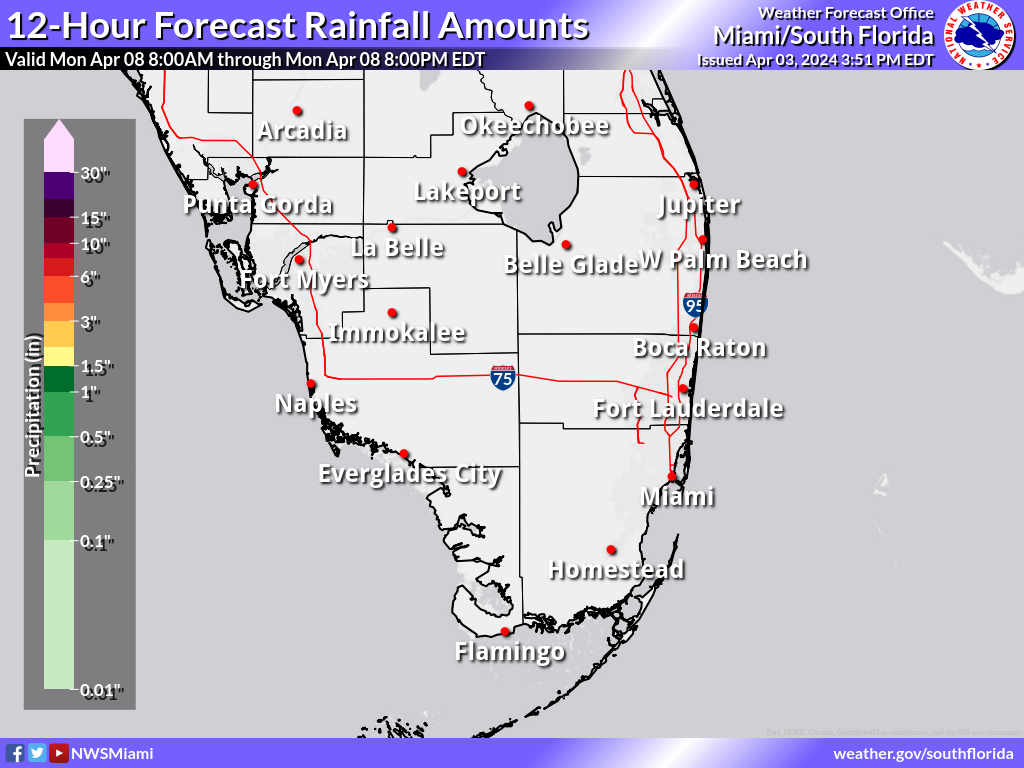
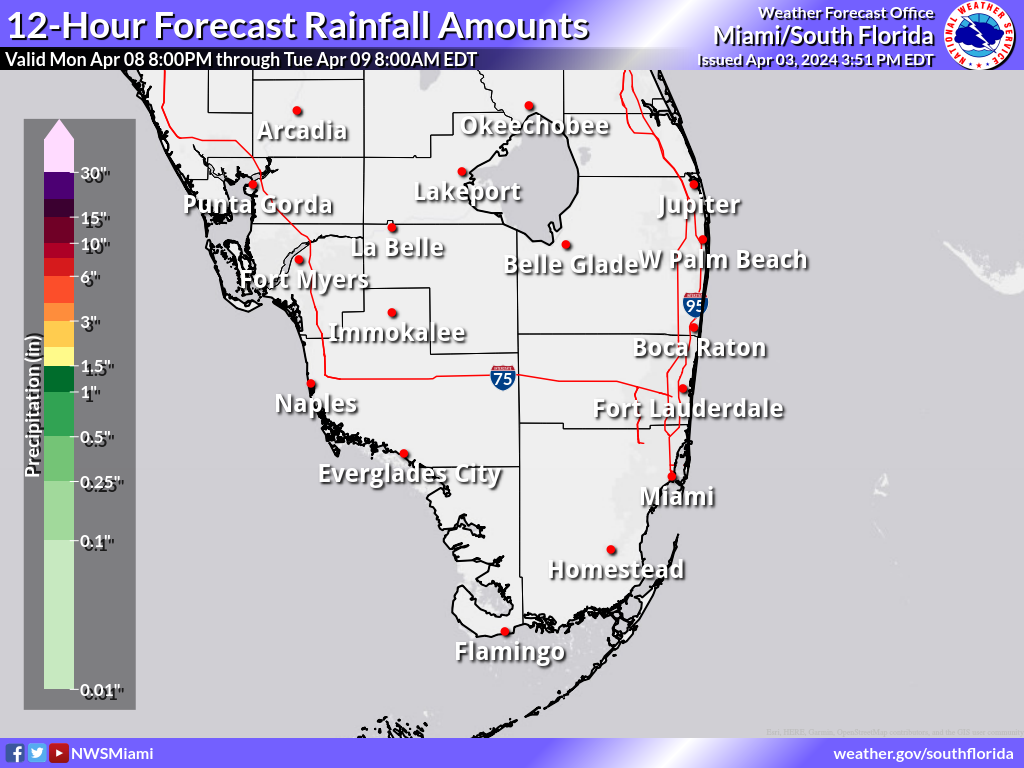
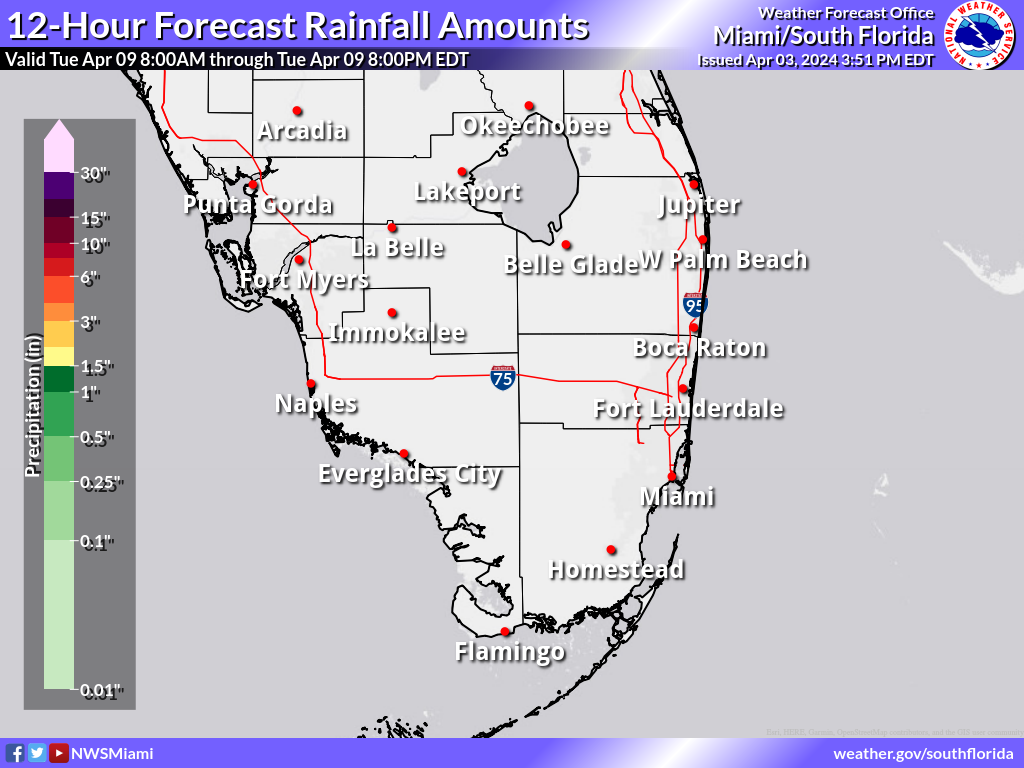
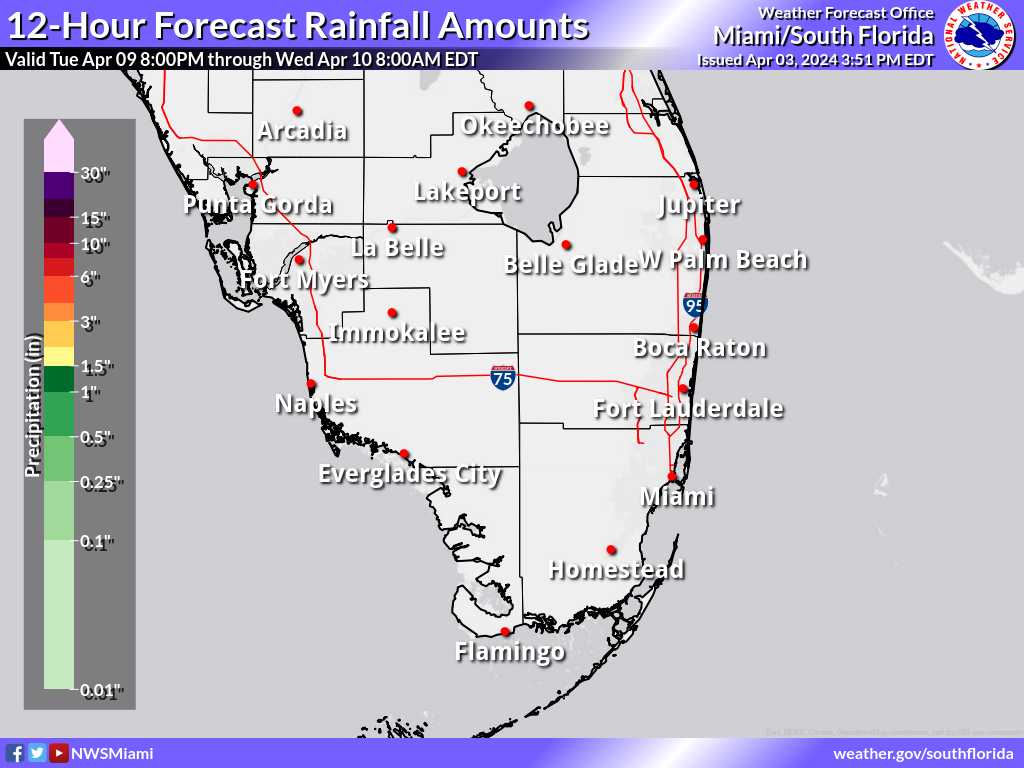
Expected 12 Hour Rainfall (in.)
These maps are the official NWS rainfall forecast in inches during the time period shown on the graphic. These rainfall amounts are determined by NWS forecasters to be the most likely outcome based on evaluation of data from computer models, satellite, radar, and other observations.
Day 1
Night 1
Day 2
Night 2
Day 3
Night 3
Day 4
Night 4
Day 5
Night 5
Day 6
Night 6
Day 7
Night 7
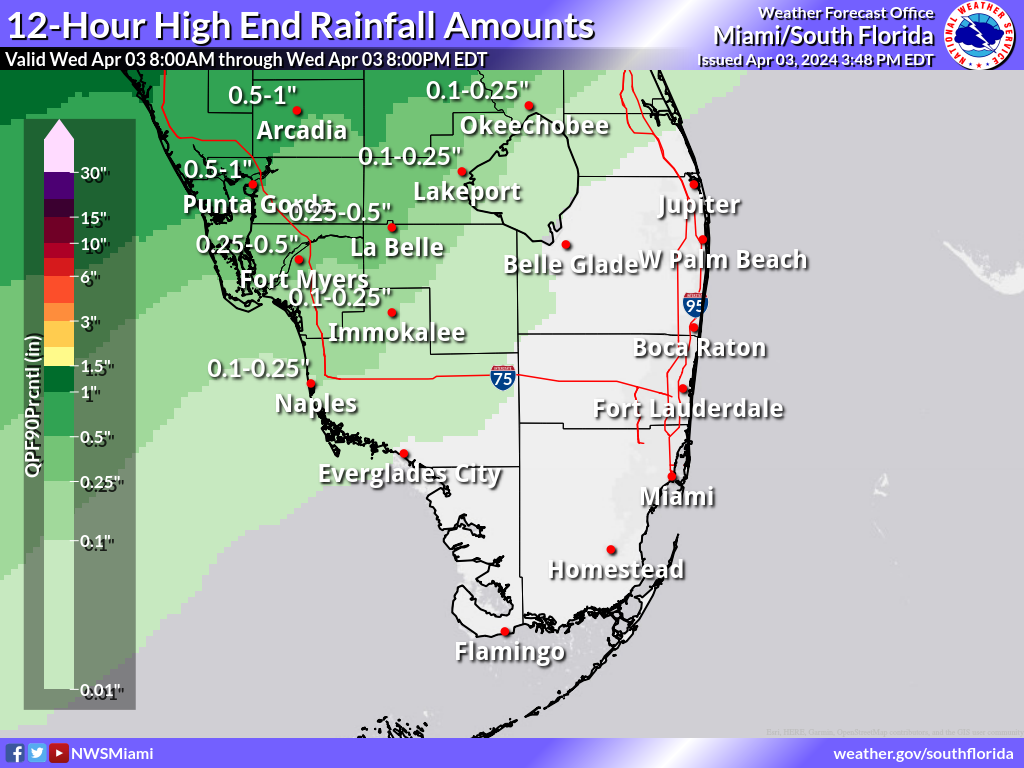
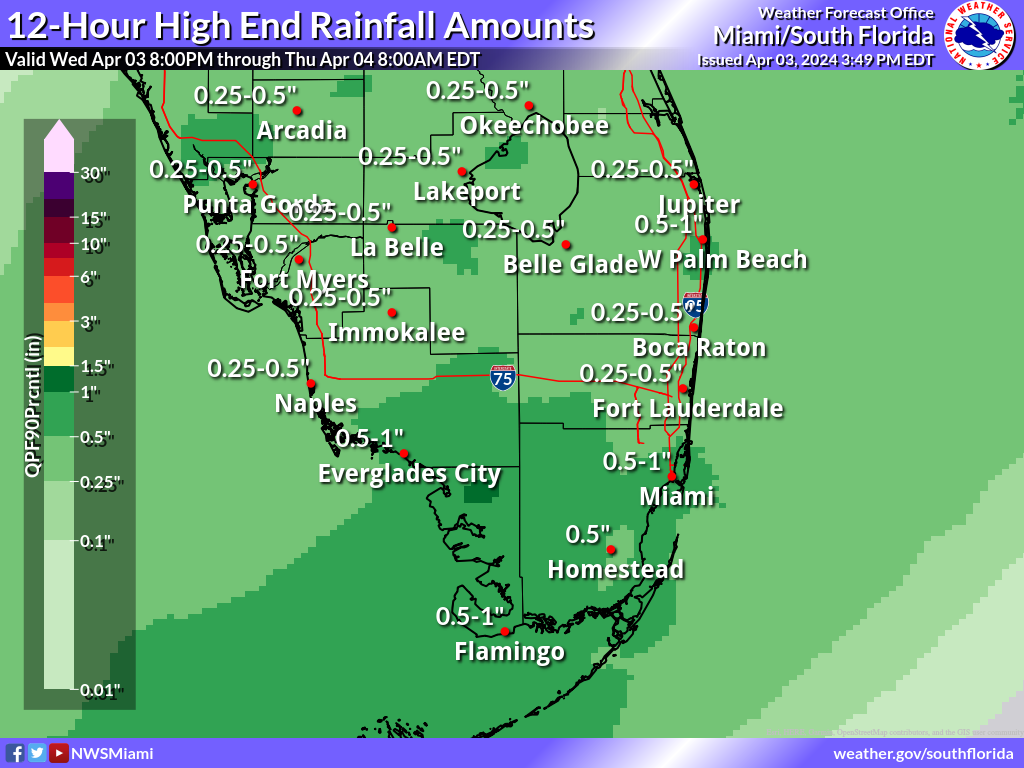
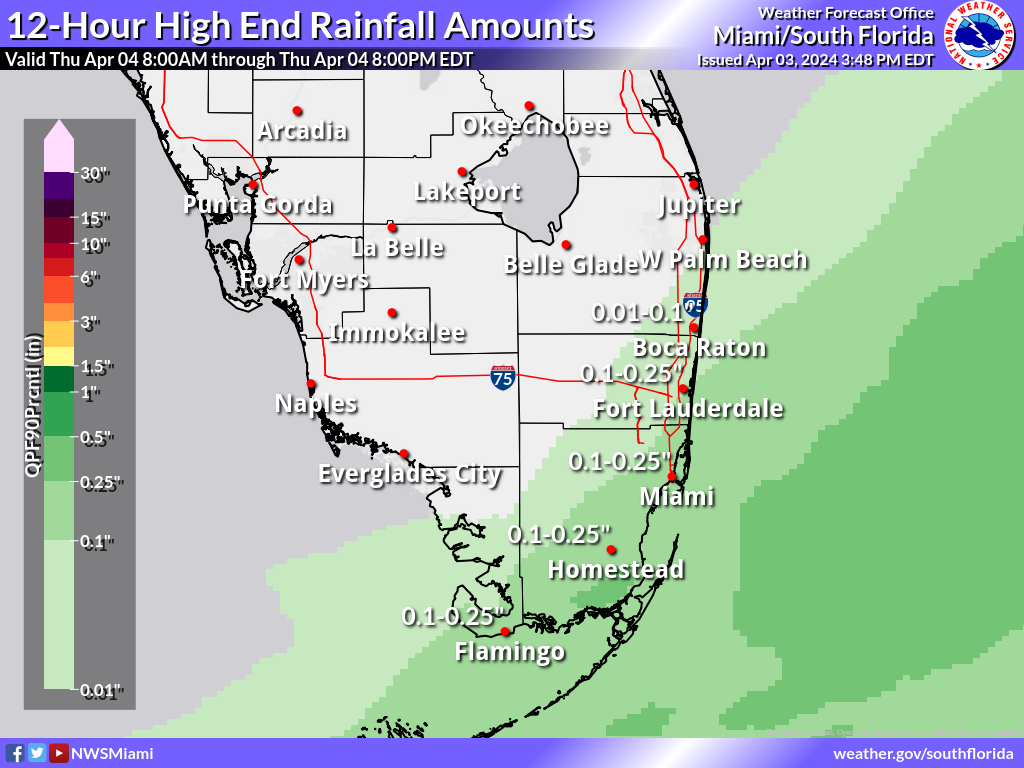
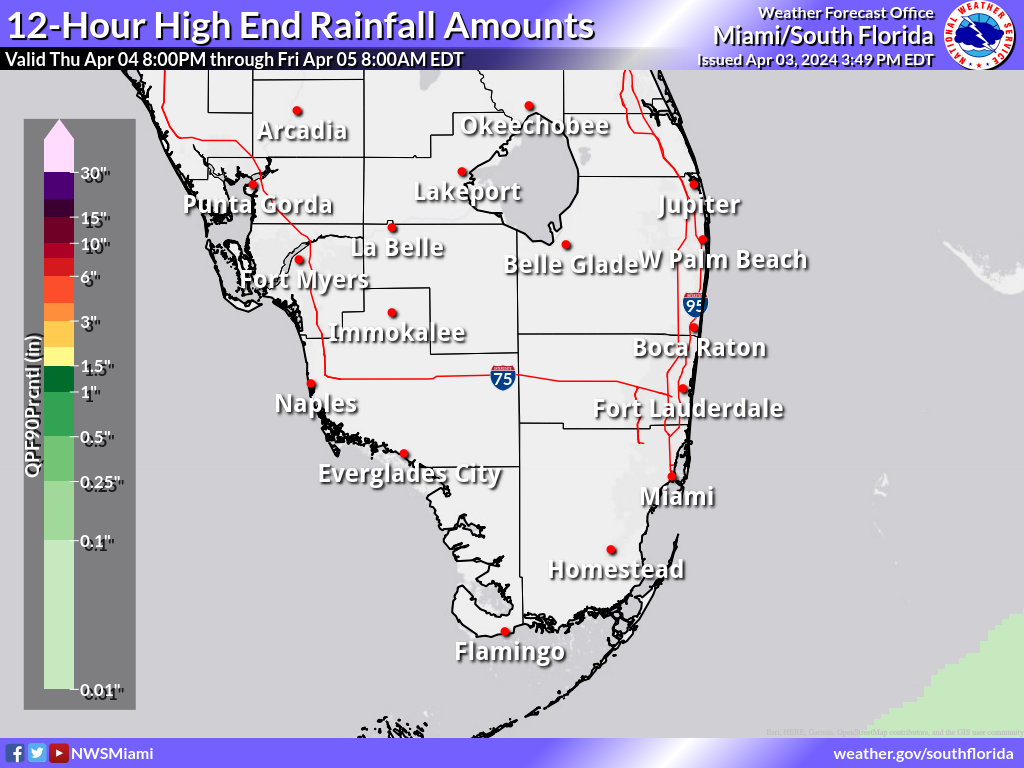
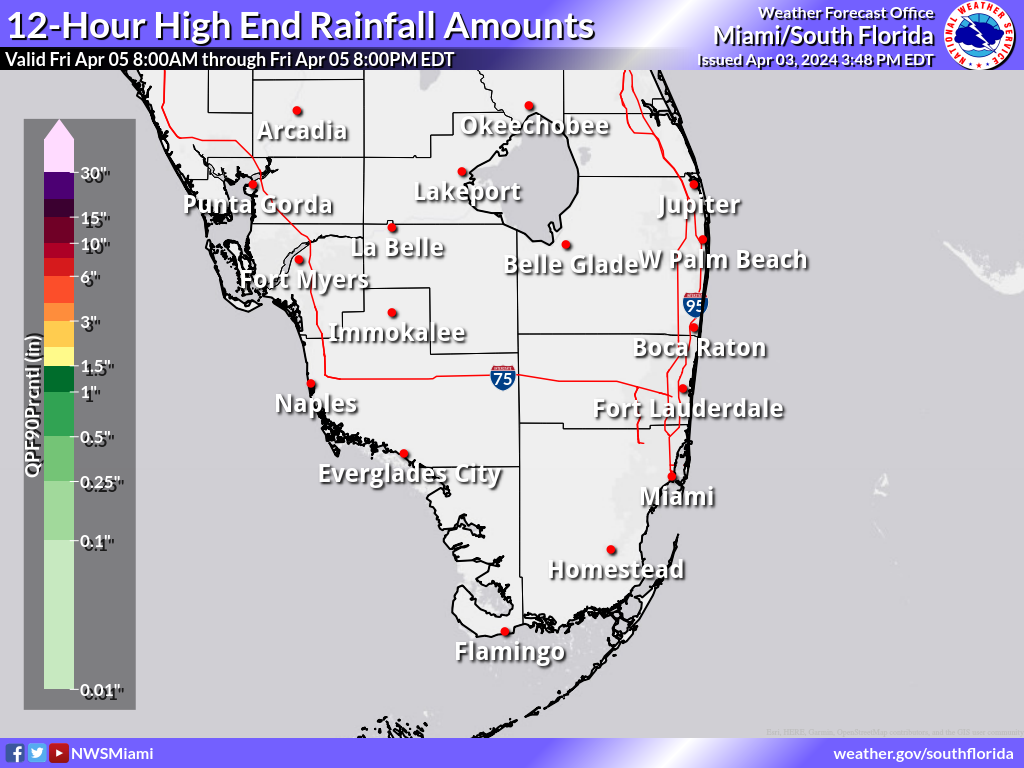
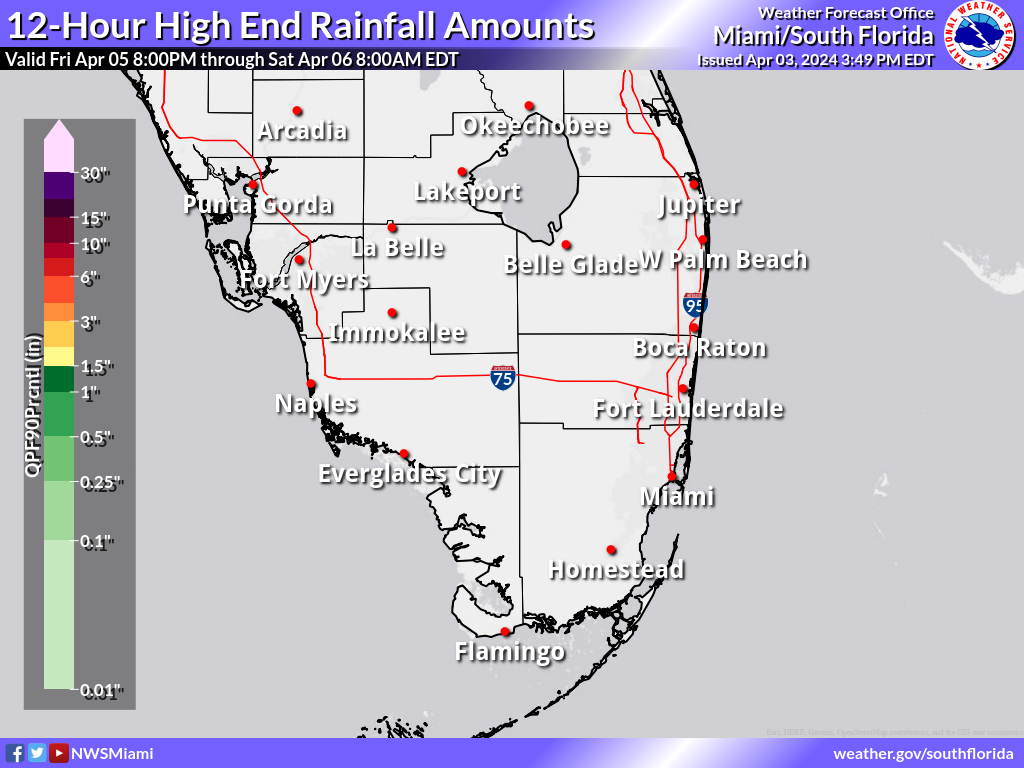
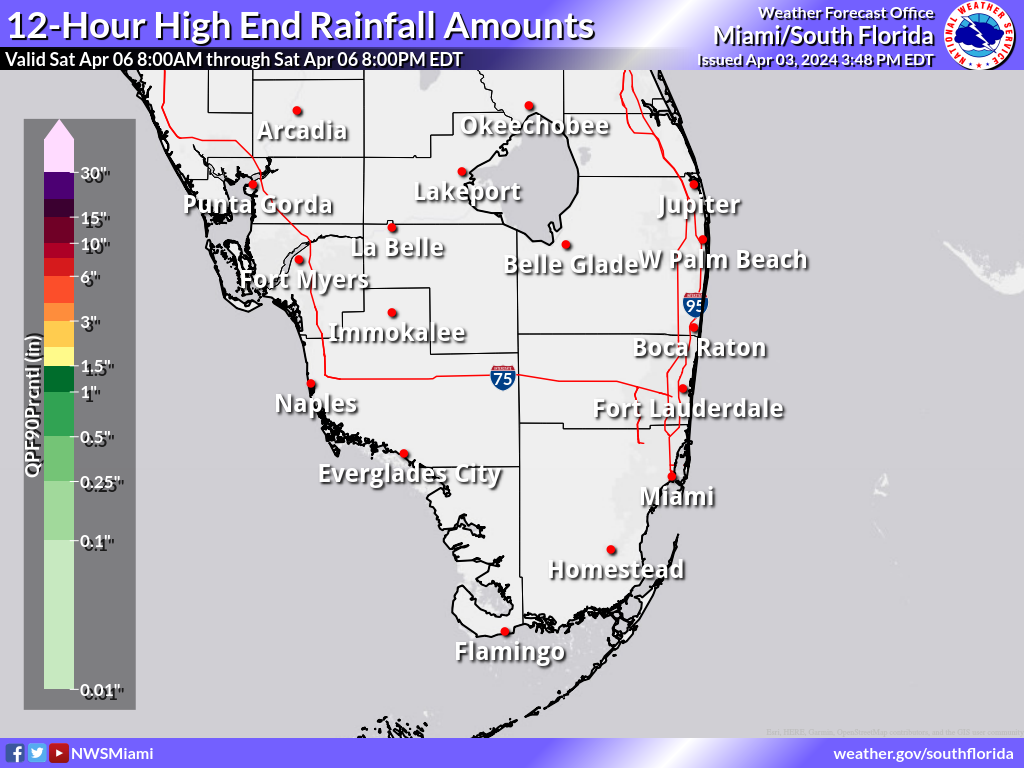
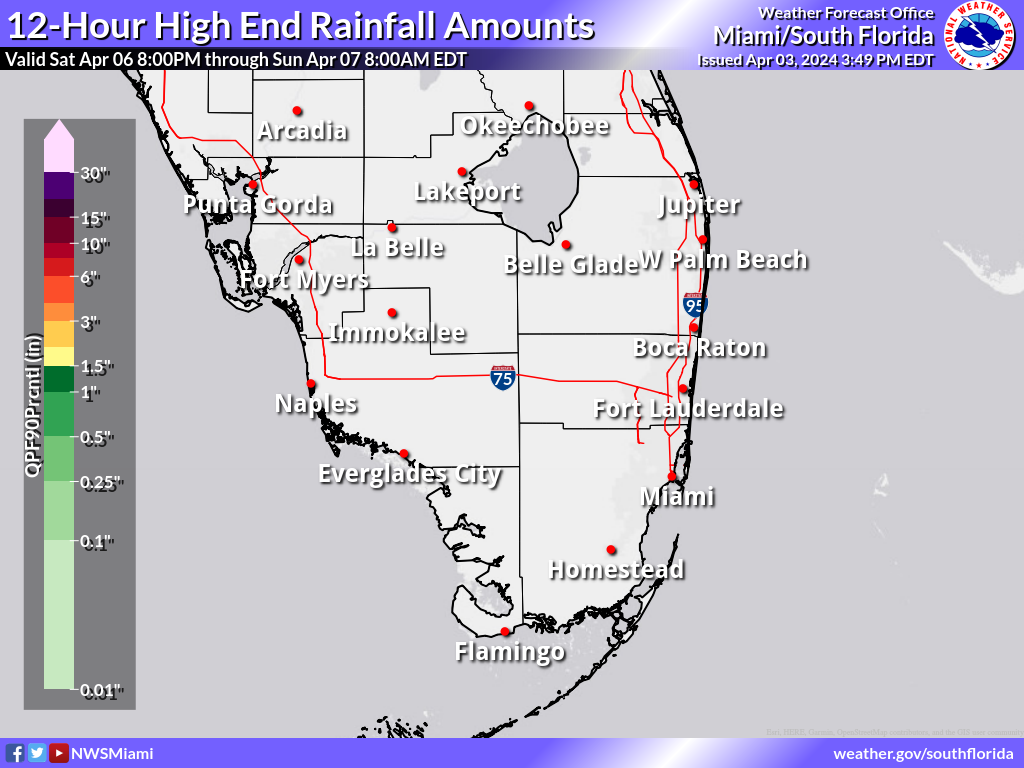
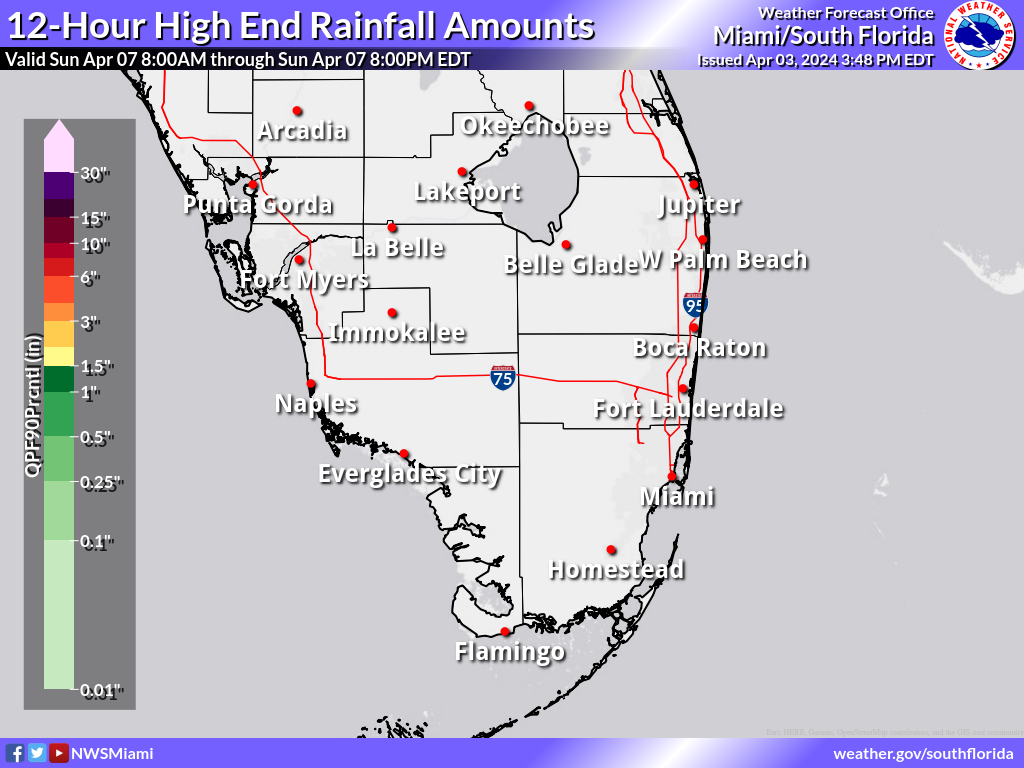
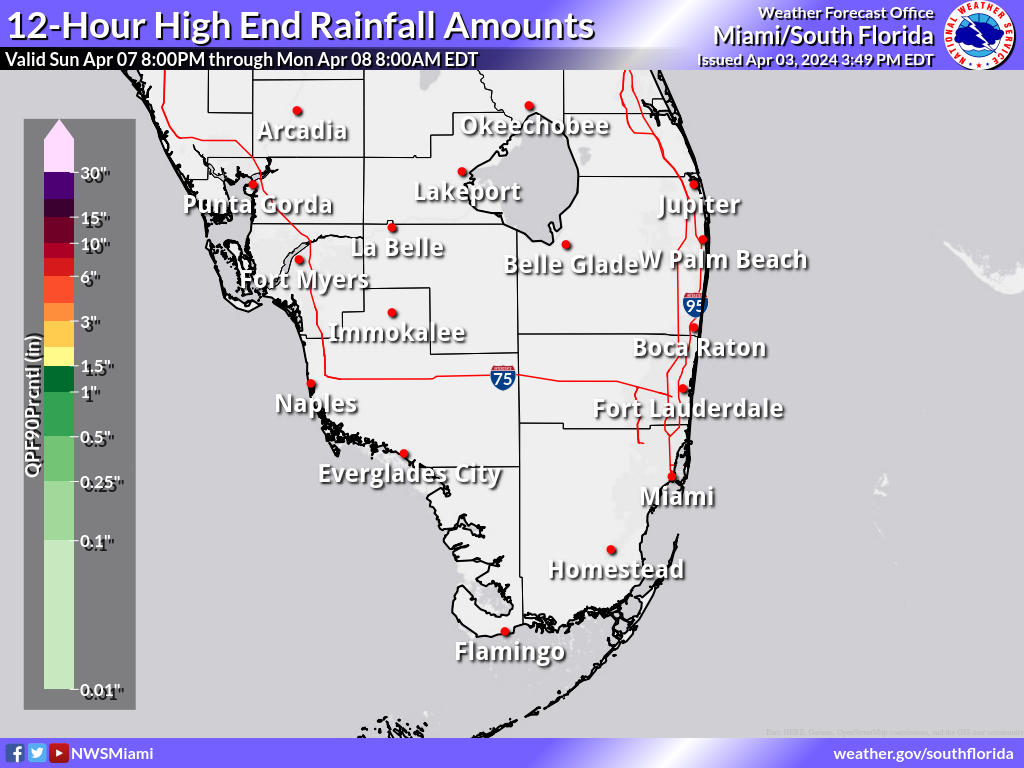
Greatest 12 Hour Possible Rainfall (in.)
These maps depict a reasonable upper-end rainfall amount for the time period shown on the graphic, based on many computer model simulations of possible rainfall totals. These higher amounts are an unlikely scenario, with only a 1 in 10, or 10% chance that more rain will fall, and a 9 in 10, or 90% chance that less rain will fall. These amounts can help serve as an upper-end scenario for planning purposes.
Day 1
Night 1
Day 2
Night 2
Day 3
Night 3
Day 4
Night 4
Day 5
Night 5
Day 6
Night 6
Day 7
Night 7
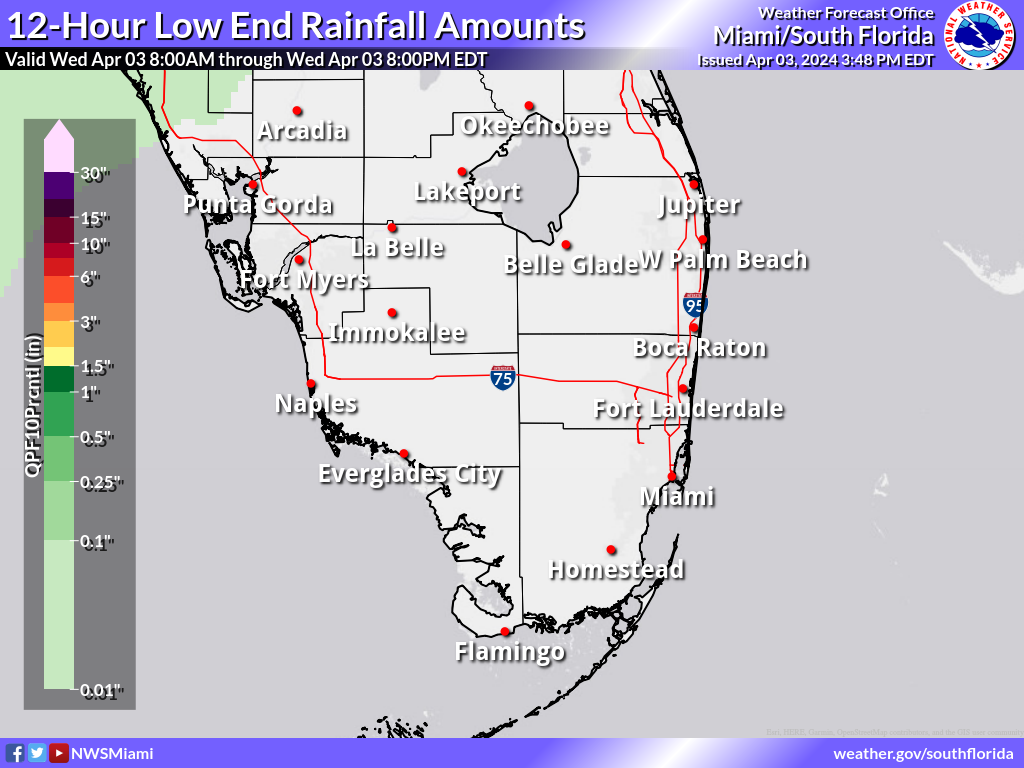
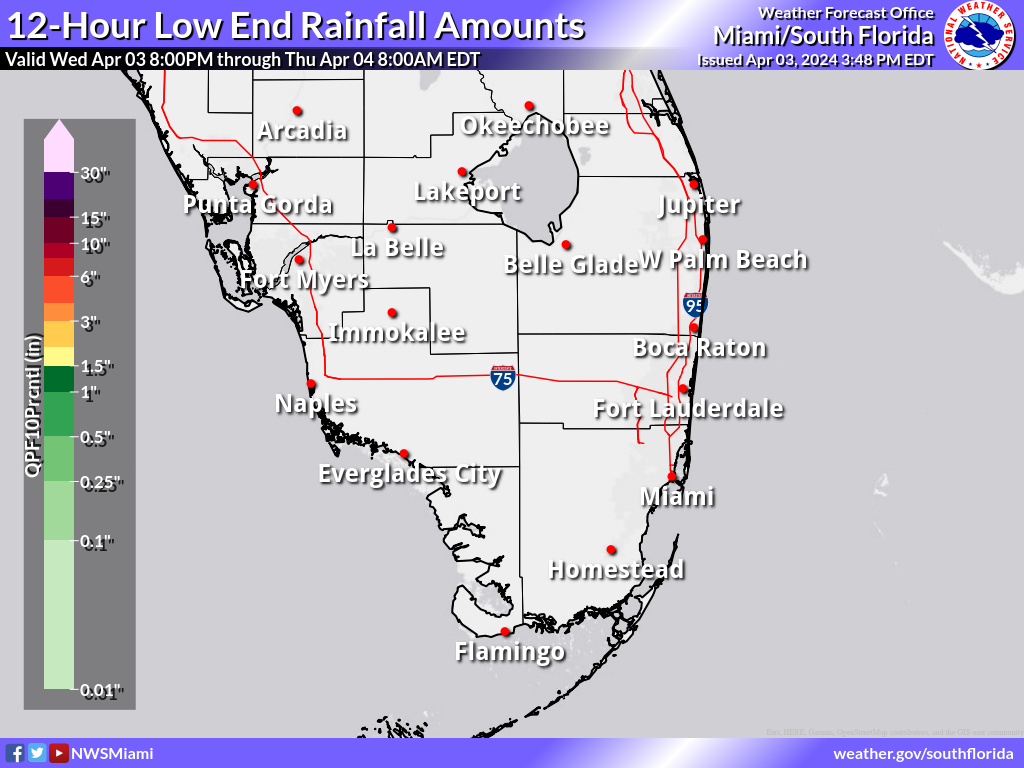
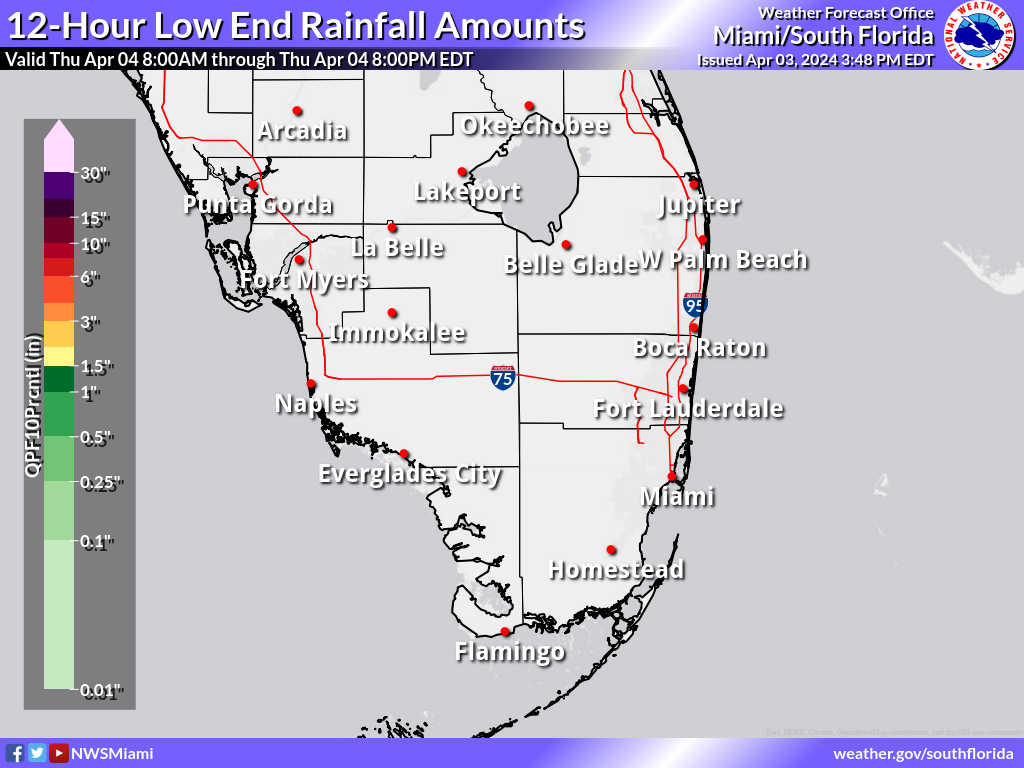
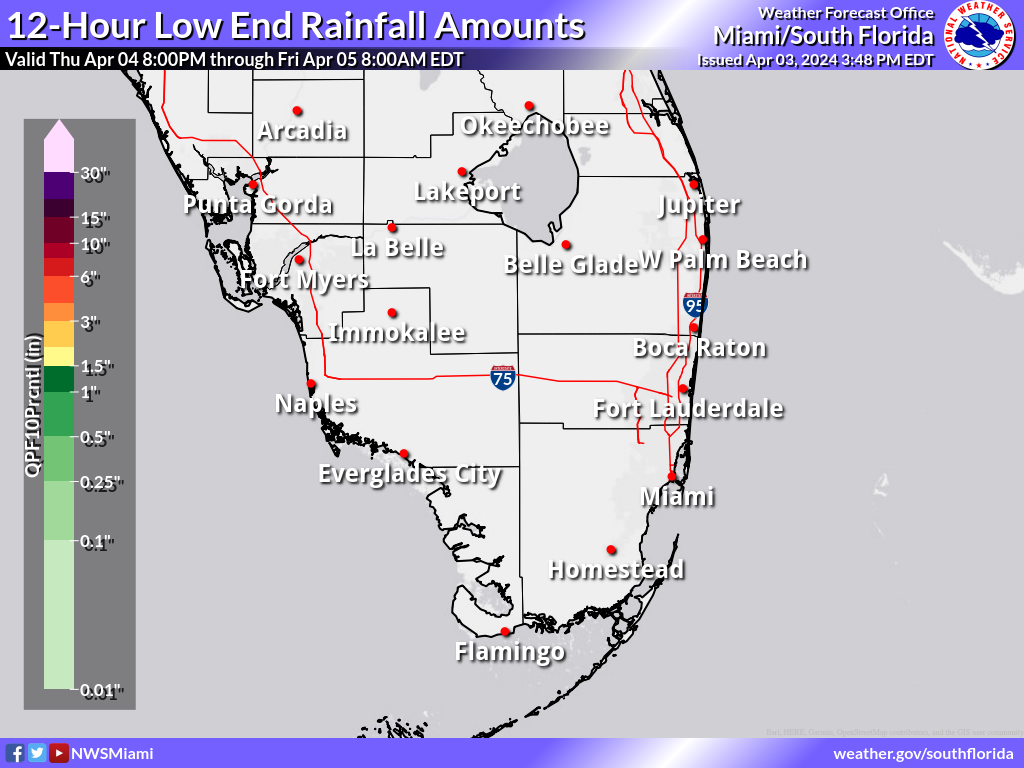
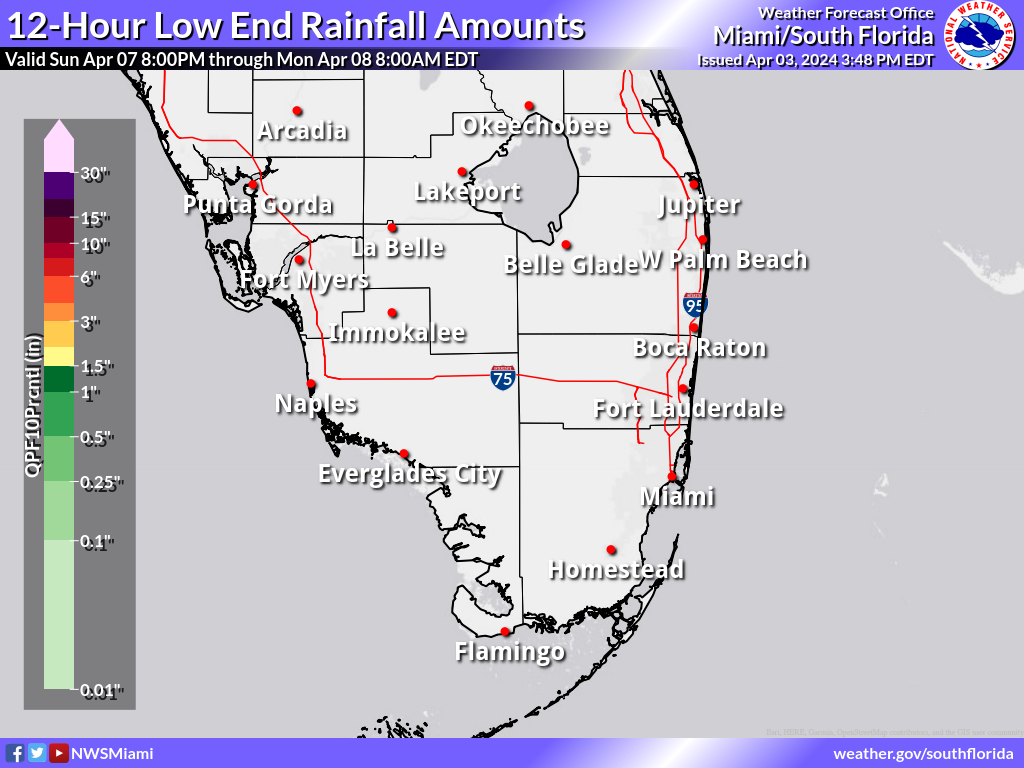
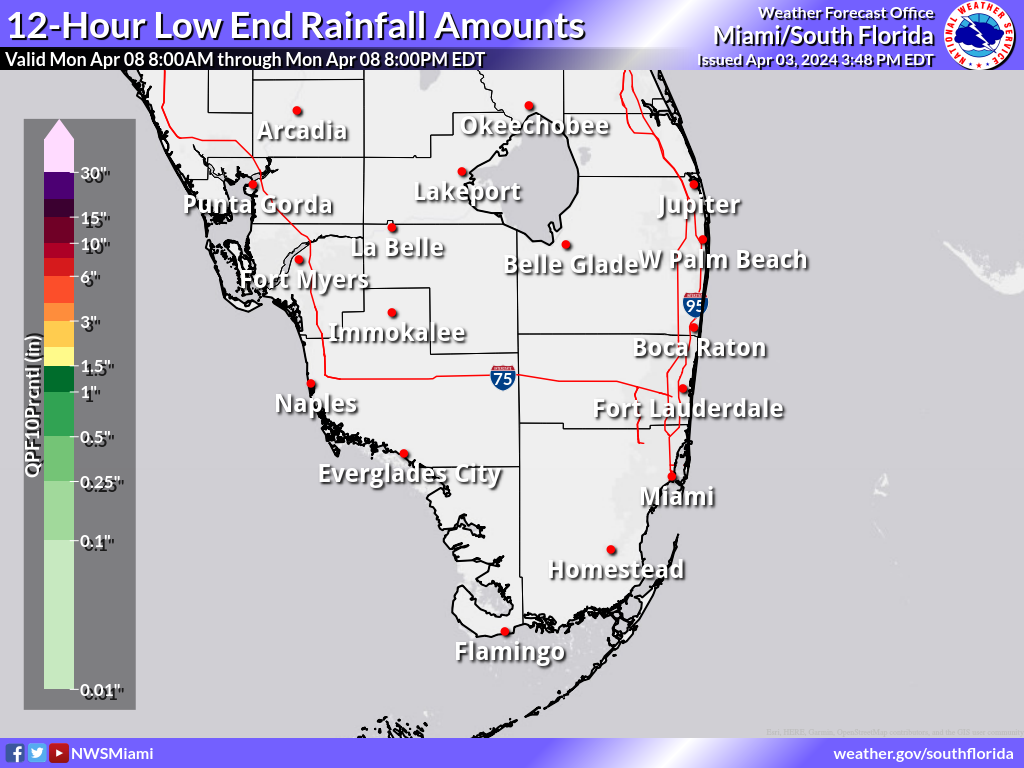
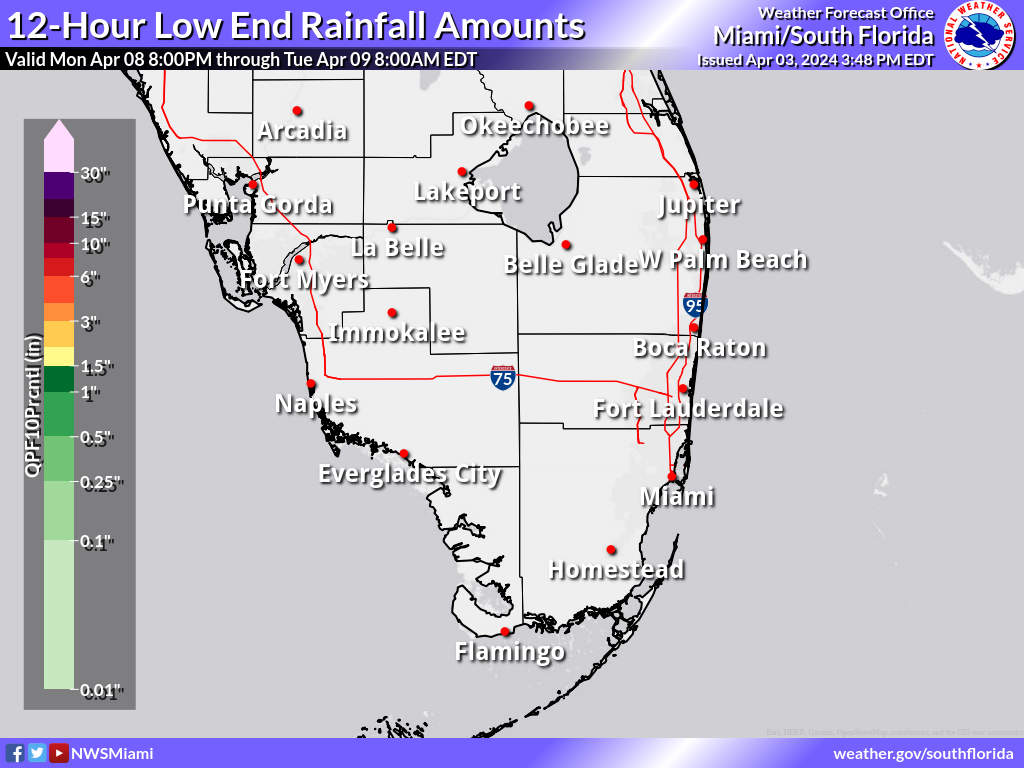
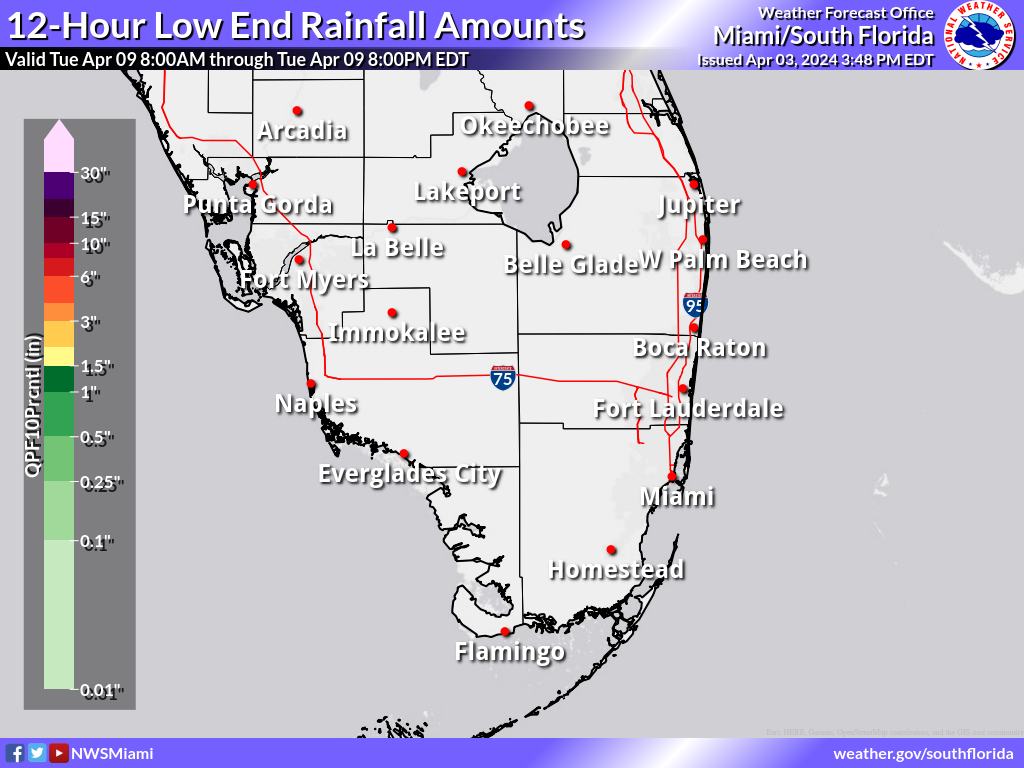
Least Possible 12 Hour Rainfall (in.)
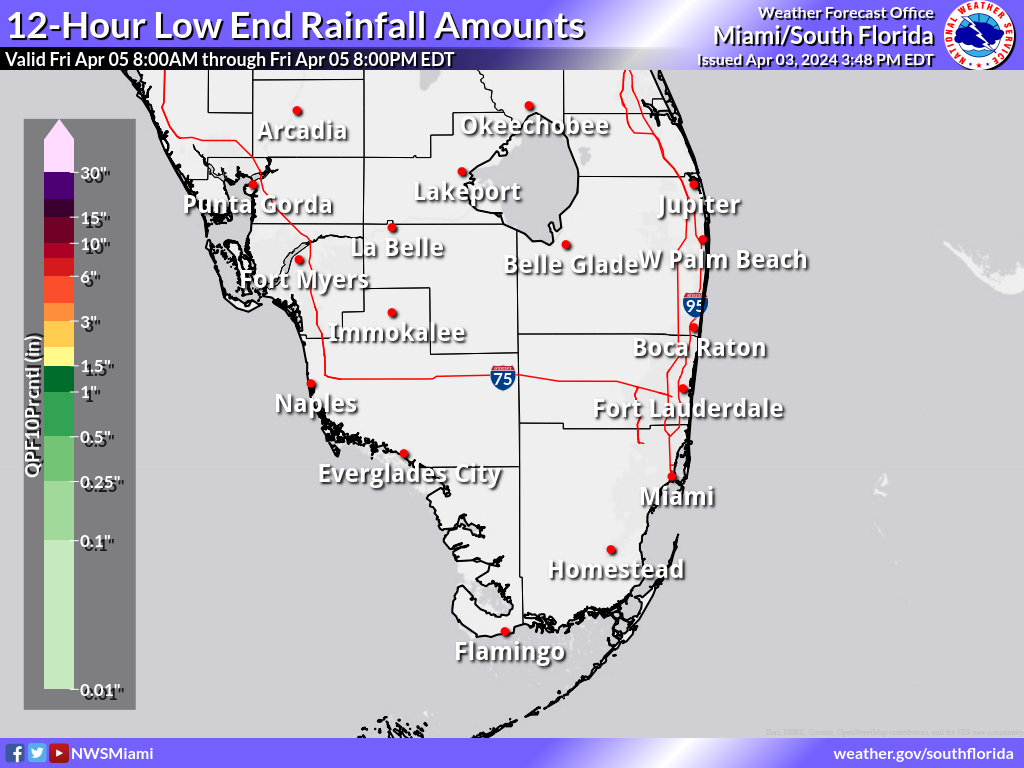
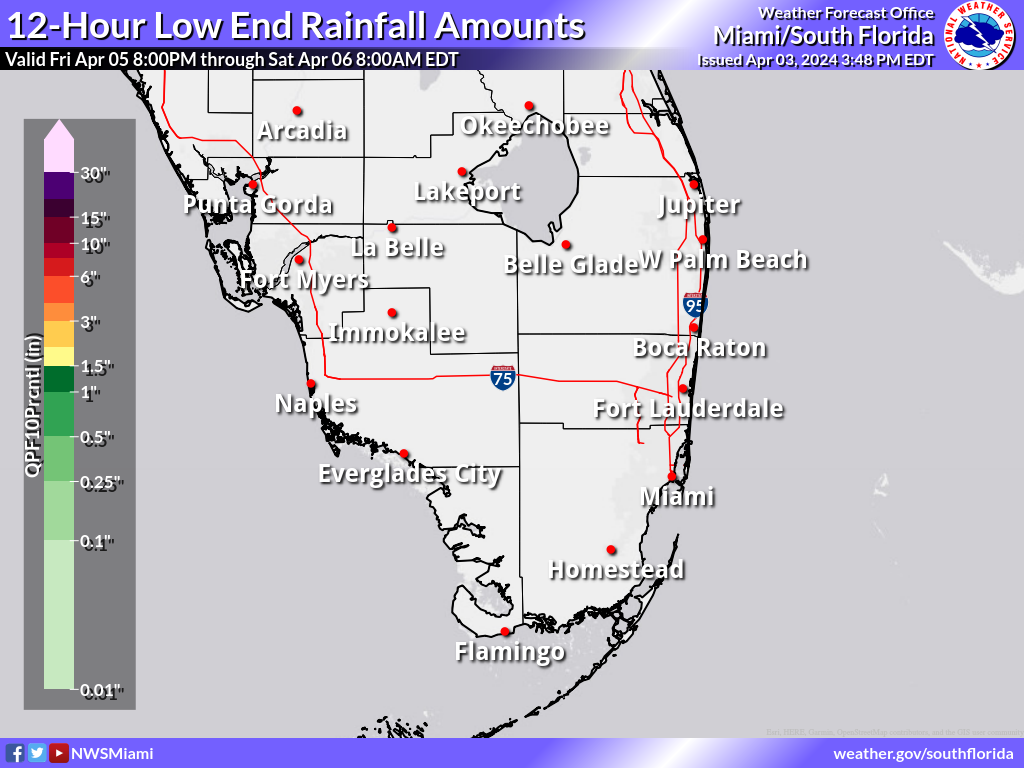
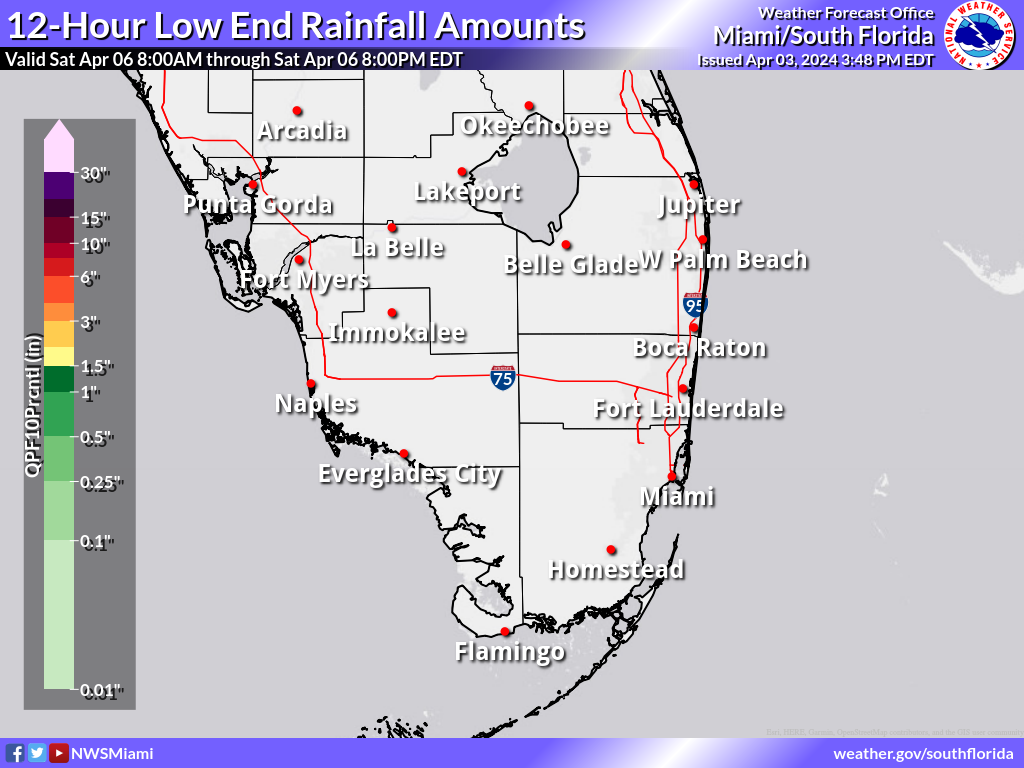
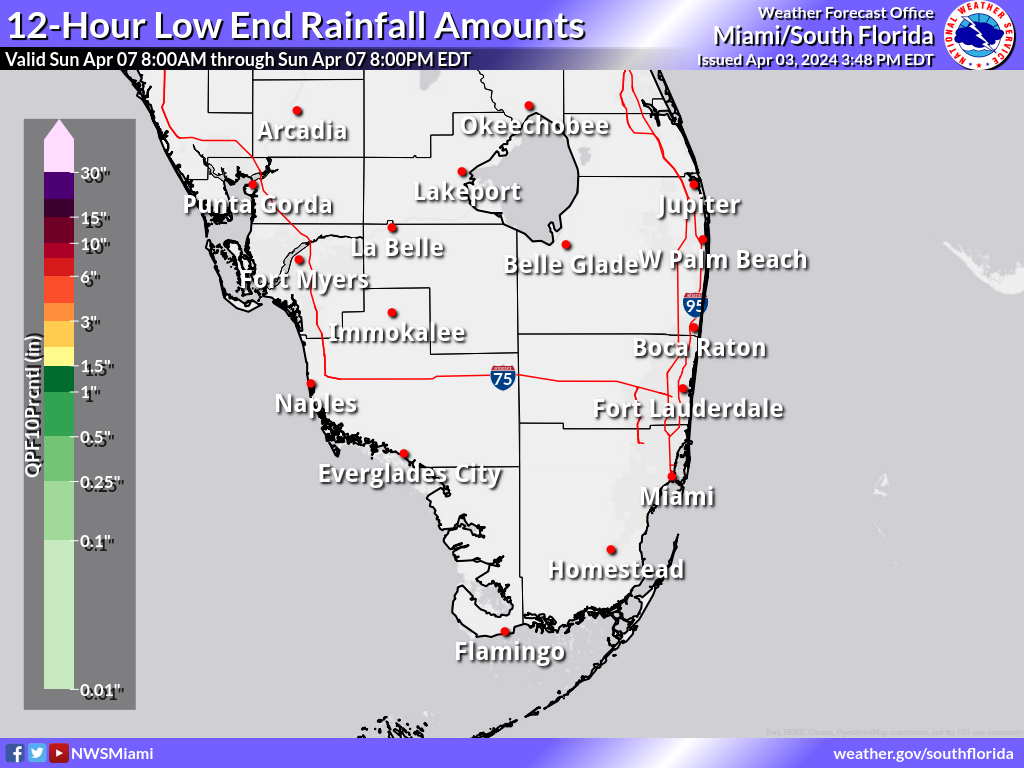
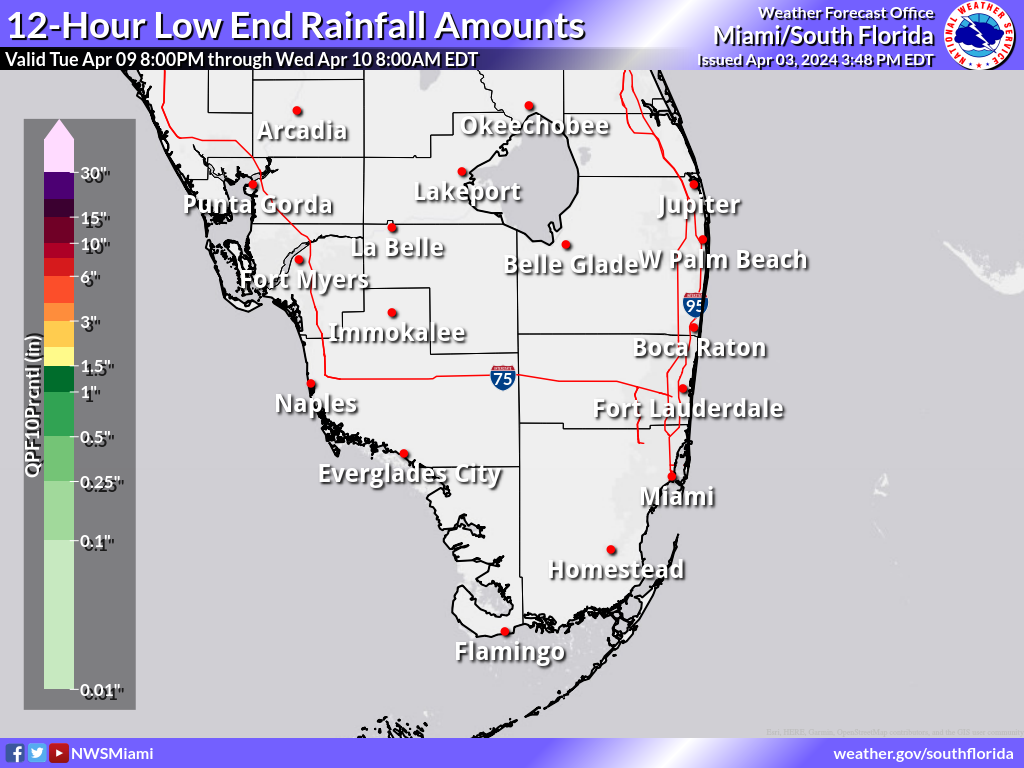
These maps depict a reasonable lower-end rainfall amount for the time period shown on the graphic, based on many computer model simulations of possible rainfall totals. These lower amounts are an unlikely scenario, with a 9 in 10, or 90% chance that more rain will fall, and only a 1 in 10, or 10% chance that less rain will fall. These amounts can help serve as a lower-end scenario for planning purposes. On many occasions these graphics will be blank, which depicts that the low end is for no measurable rainfall.
Day 1
Night 1
Day 2
Night 2
Day 3
Night 3
Day 4
Night 4
Day 5
Night 5
Day 6
Night 6
Day 7
Night 7
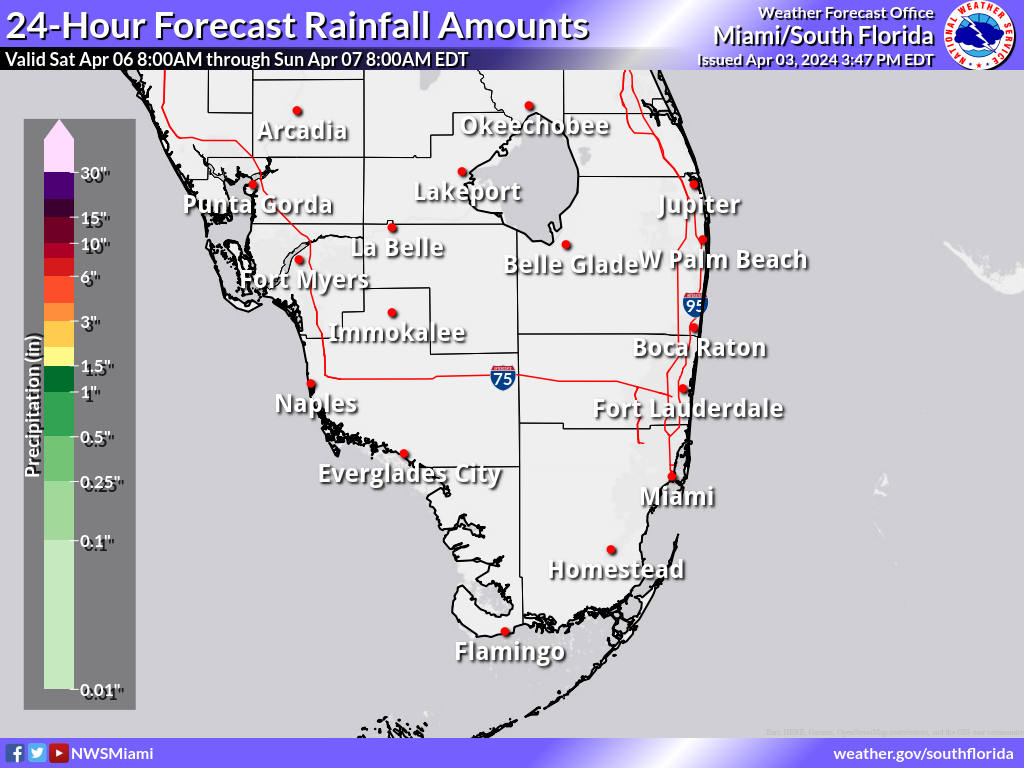
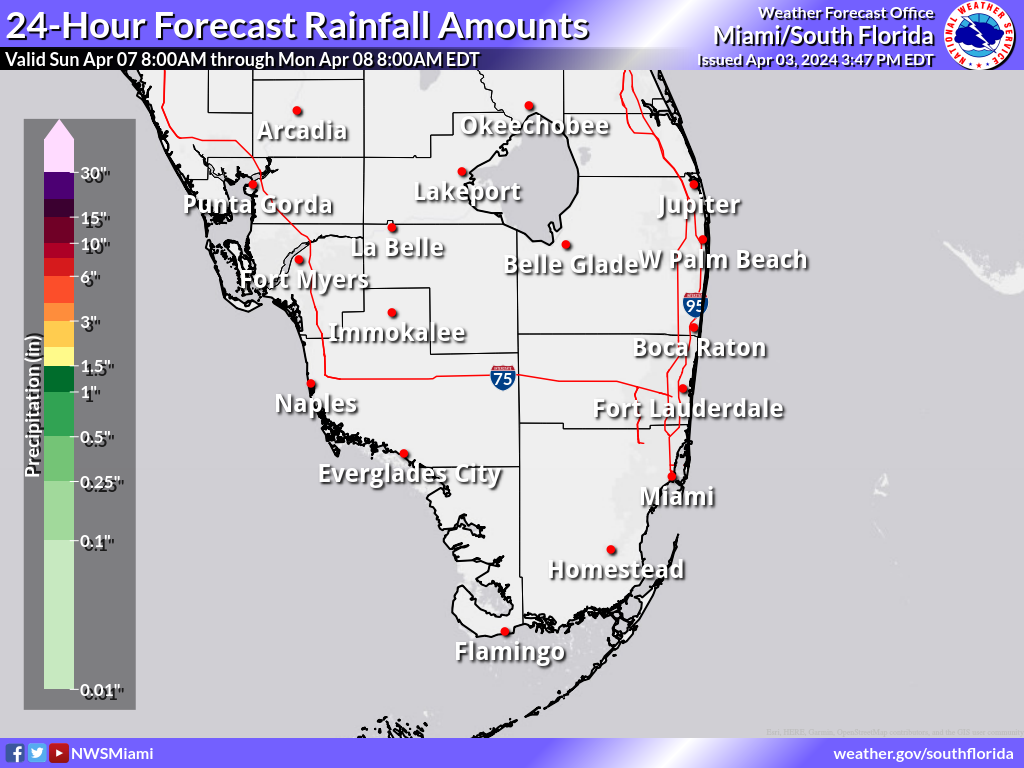
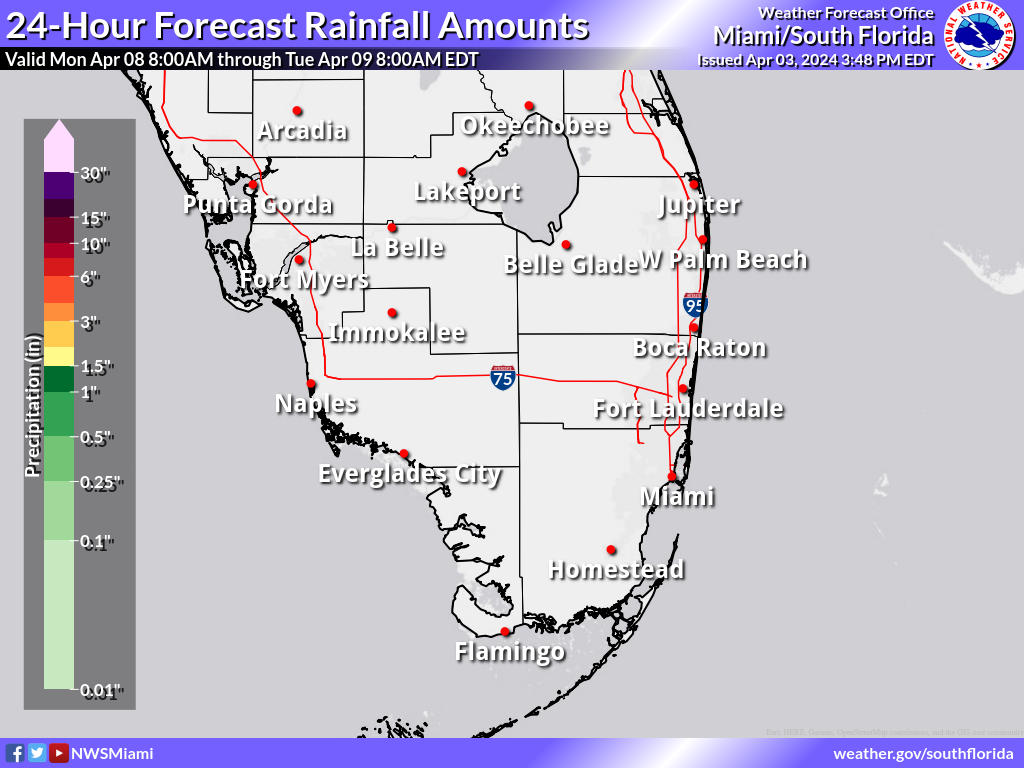
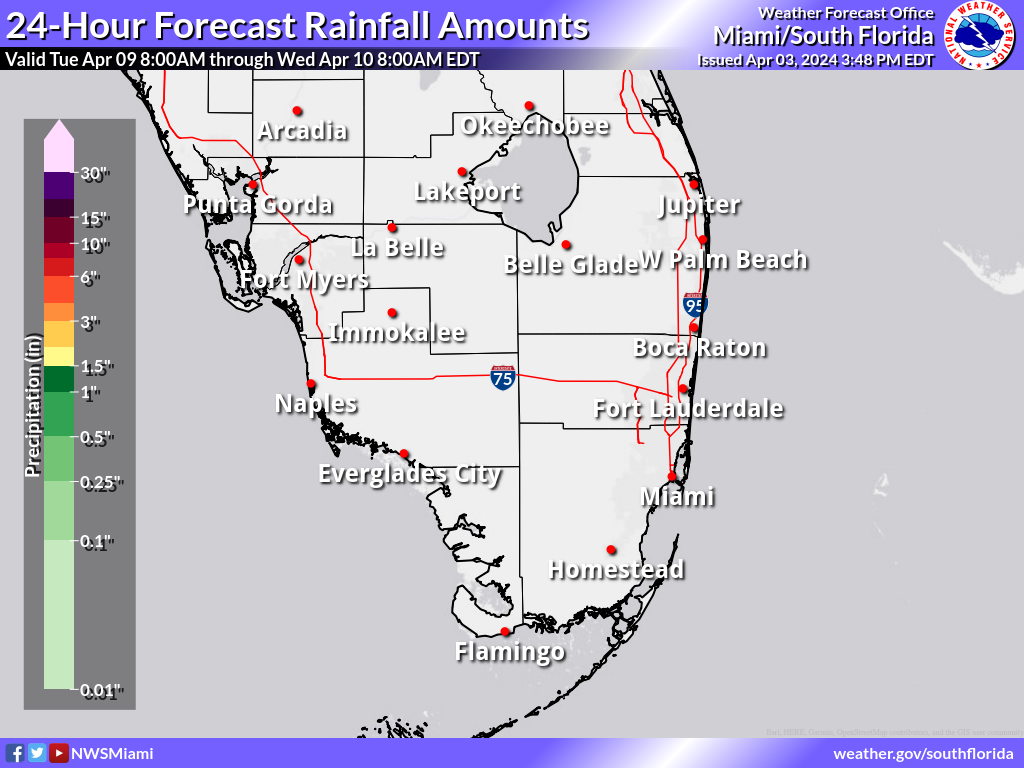
Expected 24 Hour Rainfall (in.)
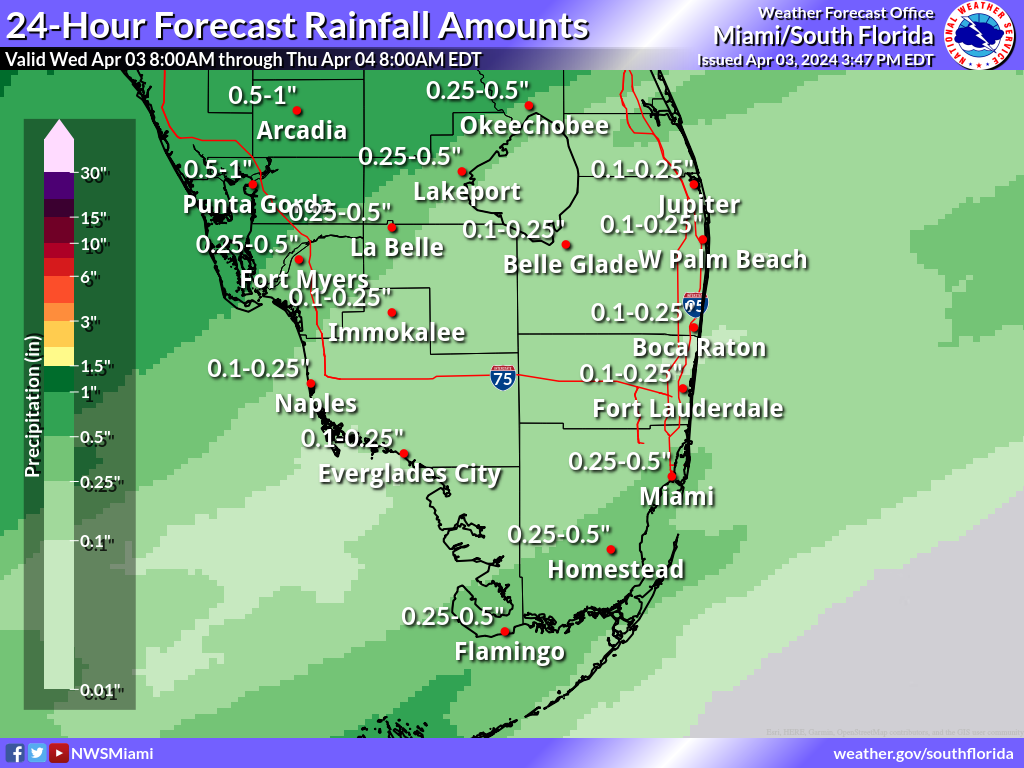
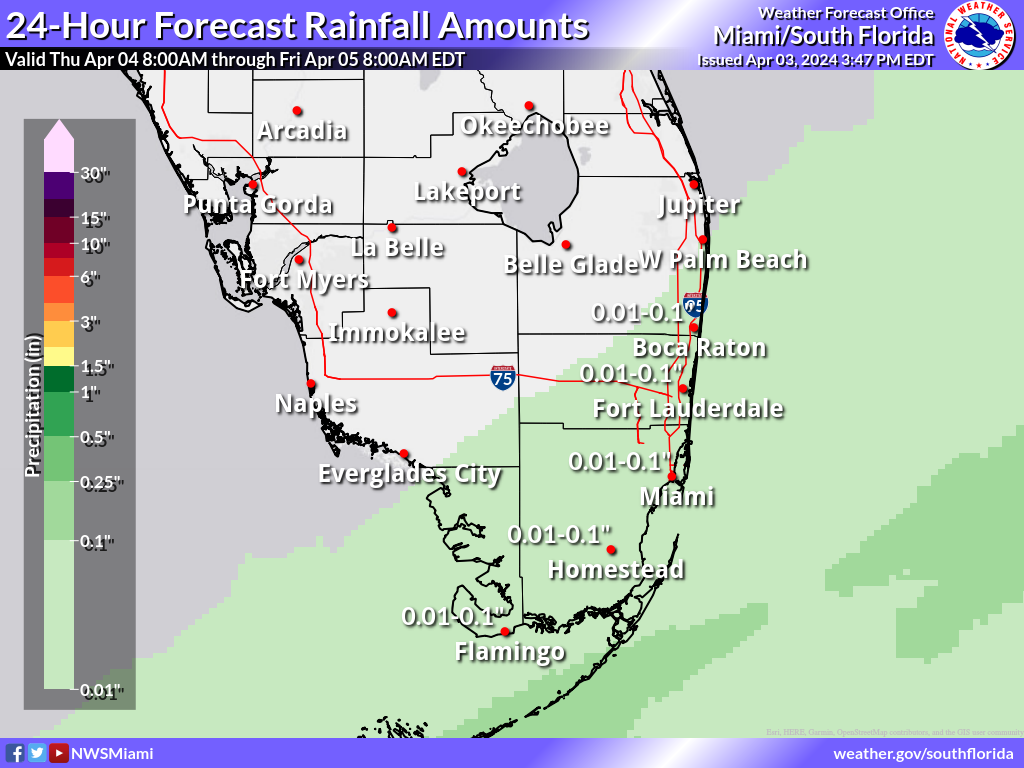
These maps are the official NWS rainfall forecast in inches during the time period shown on the graphic. These rainfall amounts are determined by NWS forecasters to be the most likely outcome based on evaluation of data from computer models, satellite, radar, and other observations.
Day 1
Day 2
Day 3
Day 4
Day 5
Day 6
Day 7
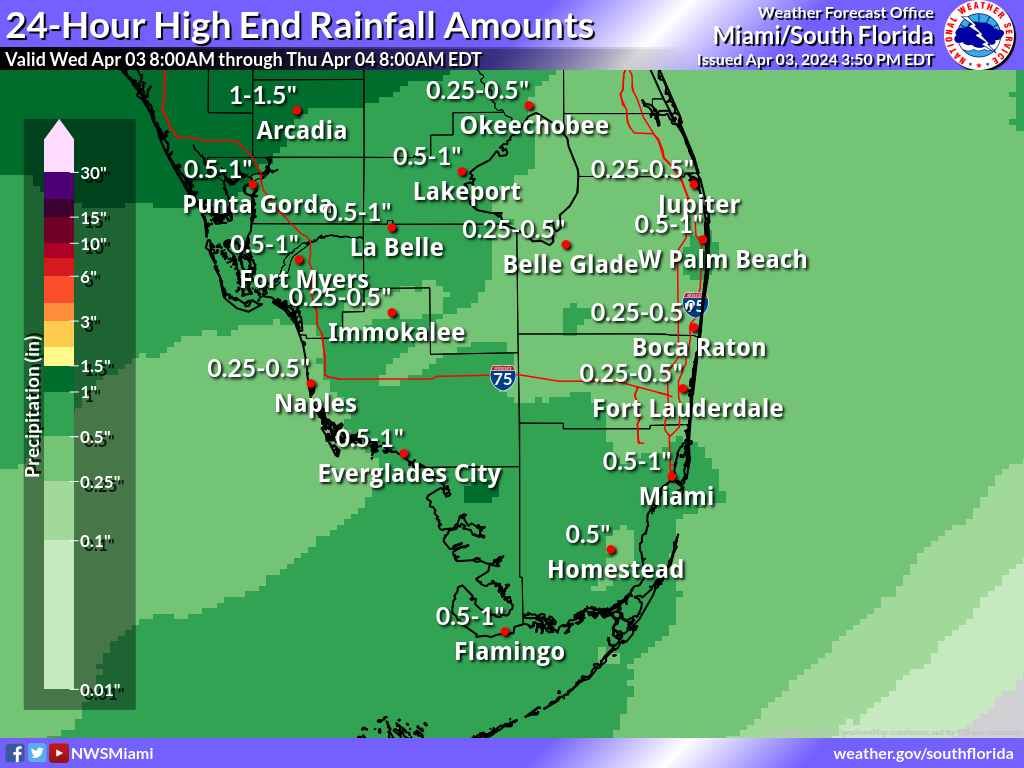
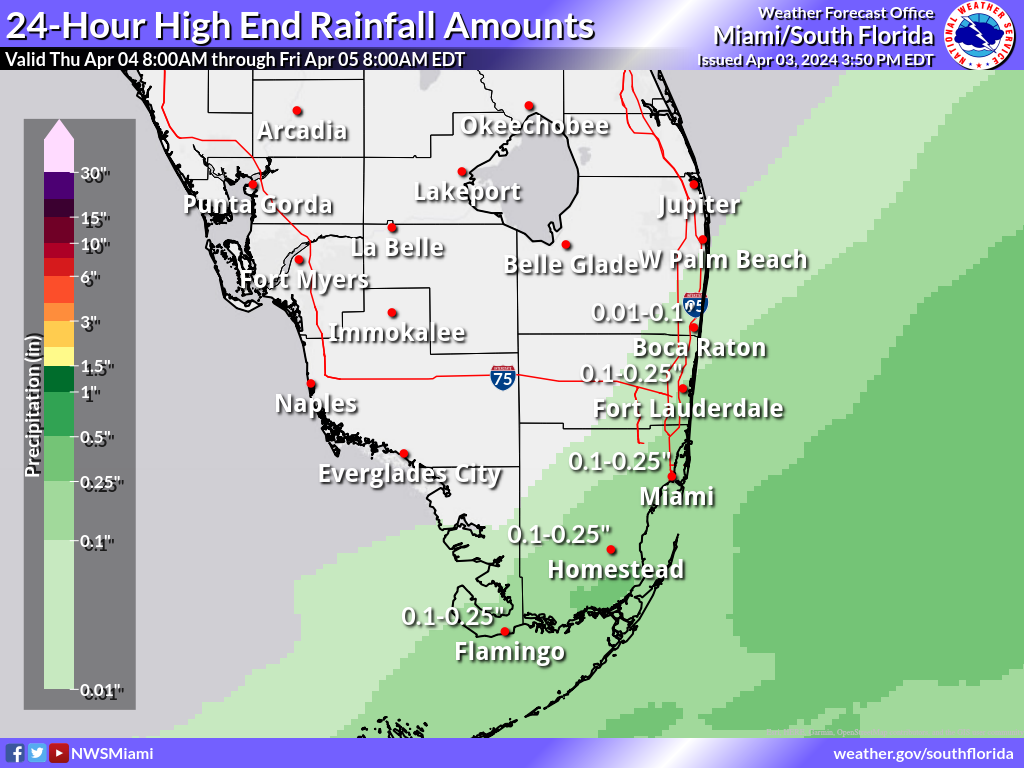
Greatest 24 Hour Possible Rainfall (in.)
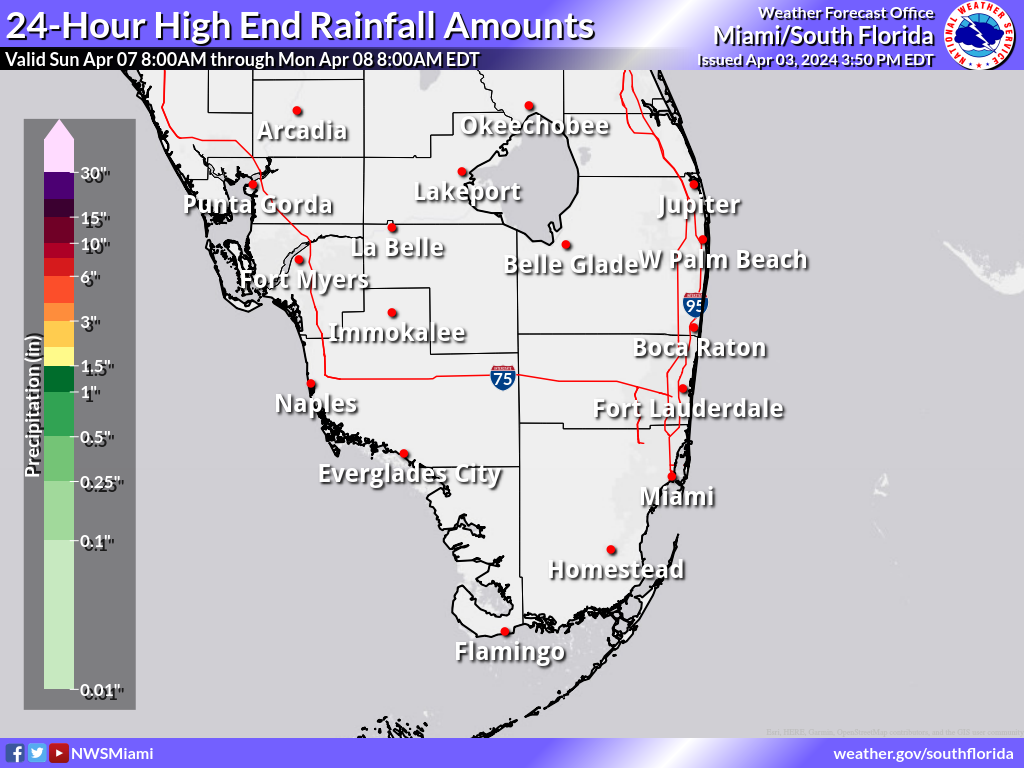
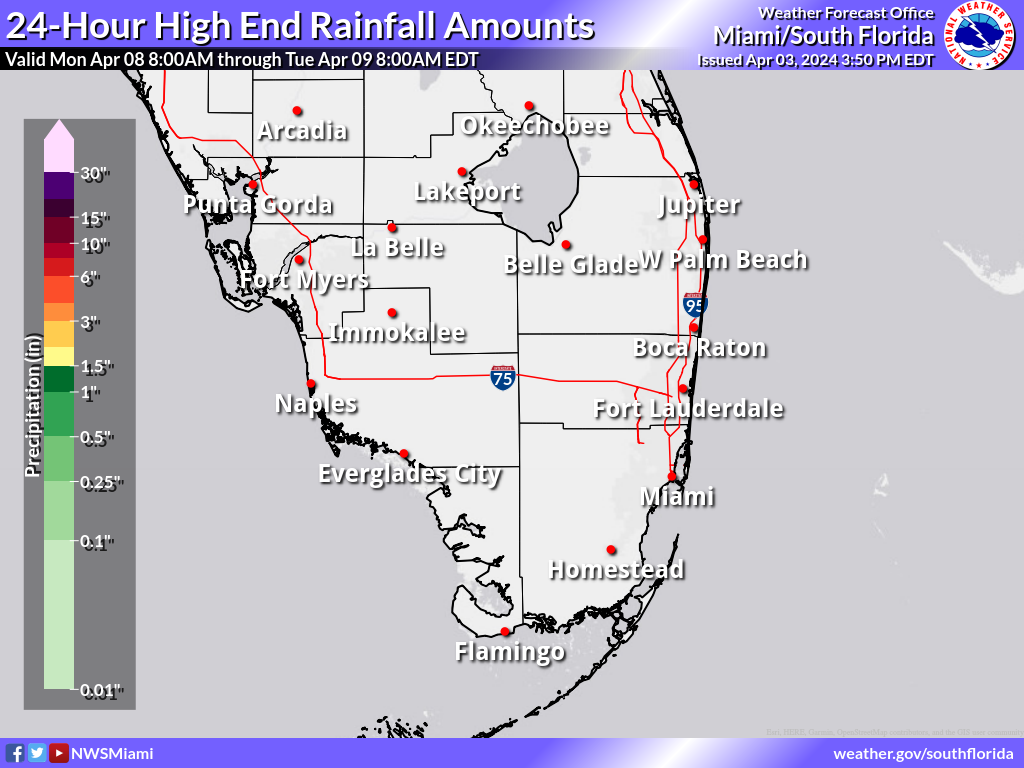
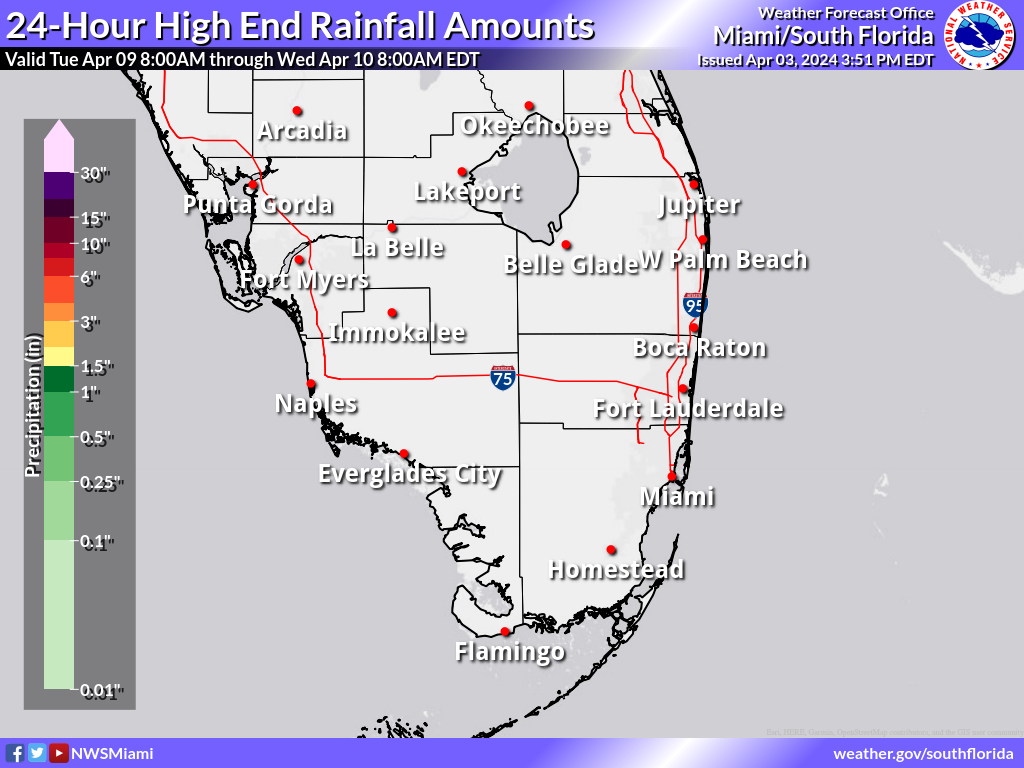
These maps depict a reasonable upper-end rainfall amount for the time period shown on the graphic, based on many computer model simulations of possible rainfall totals. These higher amounts are an unlikely scenario, with only a 1 in 10, or 10% chance that more rain will fall, and a 9 in 10, or 90% chance that less rain will fall. These amounts can help serve as an upper-end scenario for planning purposes.
Day 1
Day 2
Day 3
Day 4
Day 5
Day 6
Day 7
Least Possible 24 Hour Rainfall (in.)
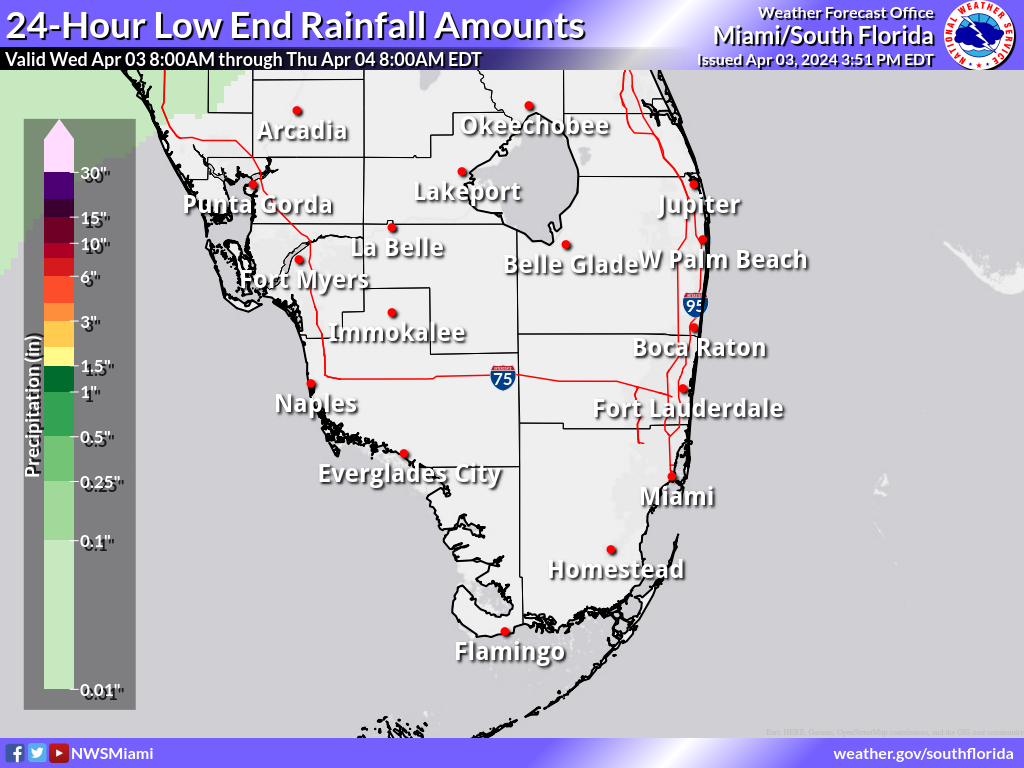
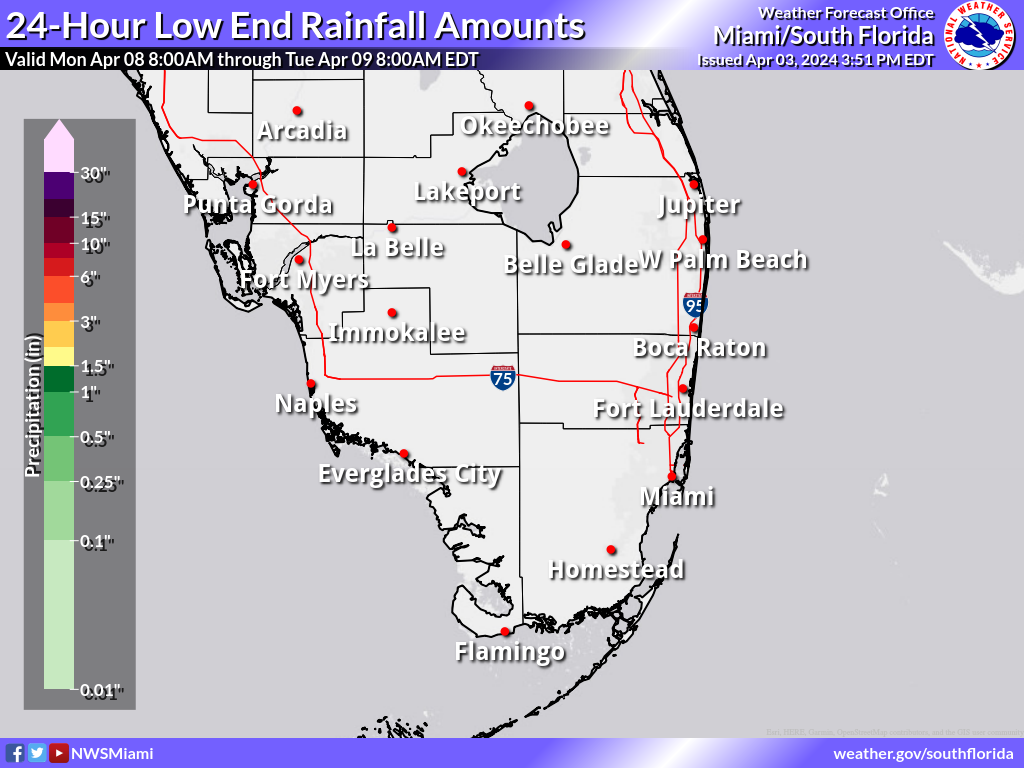
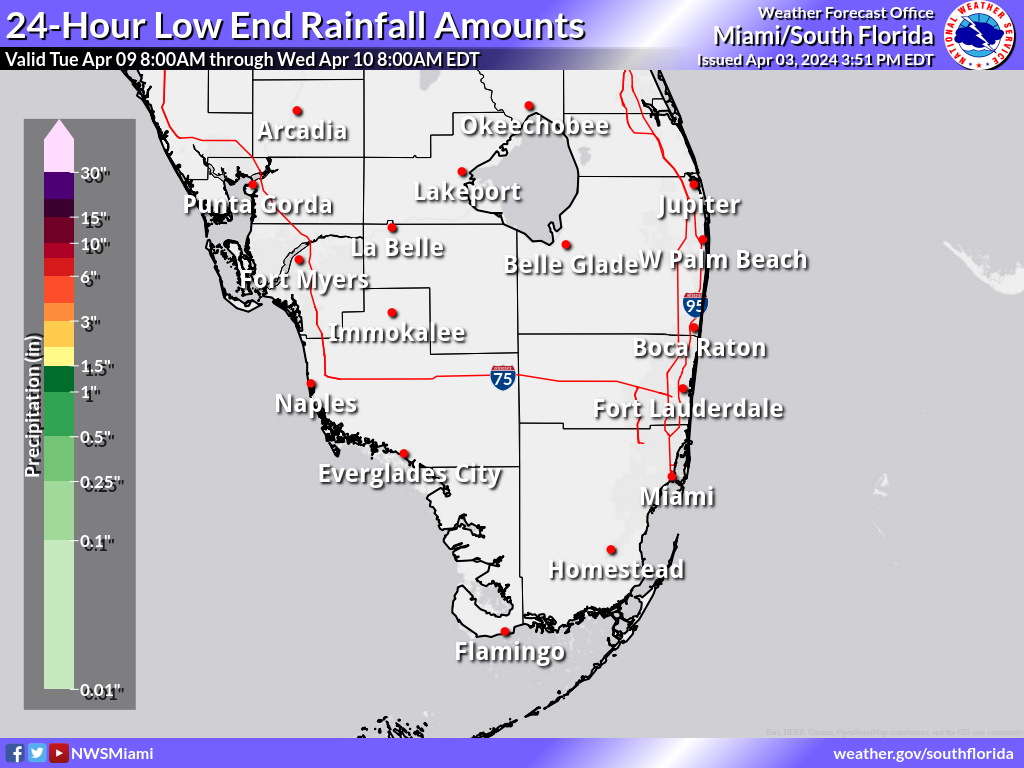
These maps depict a reasonable lower-end rainfall amount for the time period shown on the graphic, based on many computer model simulations of possible rainfall totals. These lower amounts are an unlikely scenario, with a 9 in 10, or 90% chance that more rain will fall, and only a 1 in 10, or 10% chance that less rain will fall. These amounts can help serve as a lower-end scenario for planning purposes. On many occasions these graphics will be blank, which depicts that the low end is for no measurable rainfall.
Day 1
Day 2
Day 3
Day 4
Day 5
Day 6
Day 7
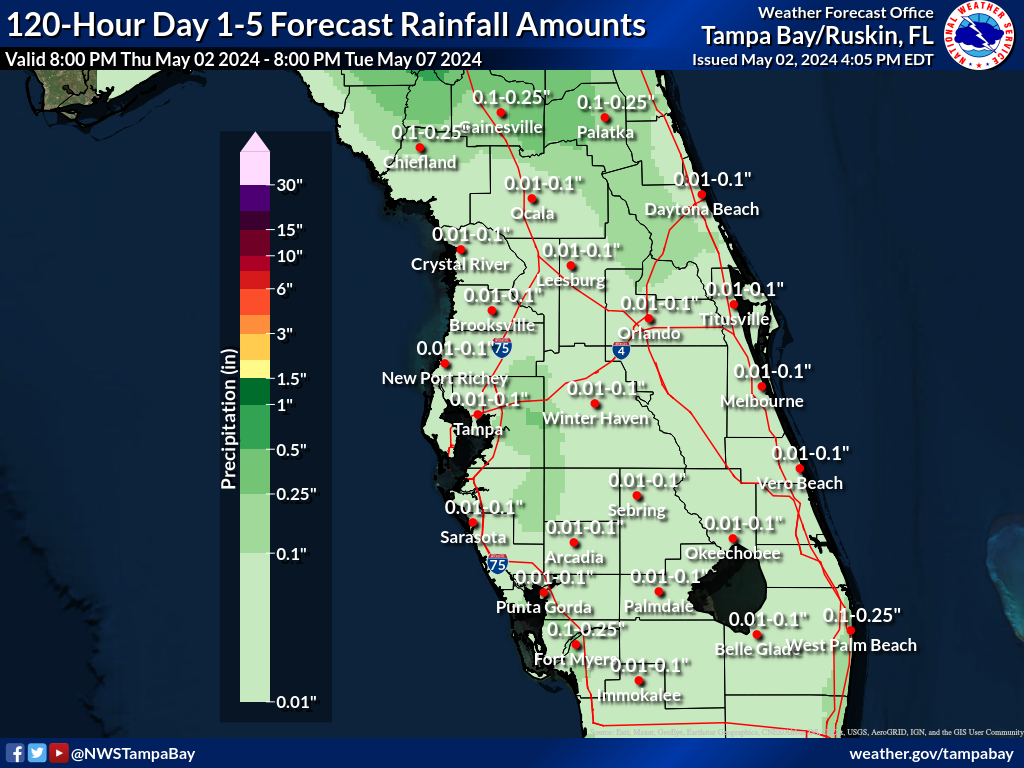
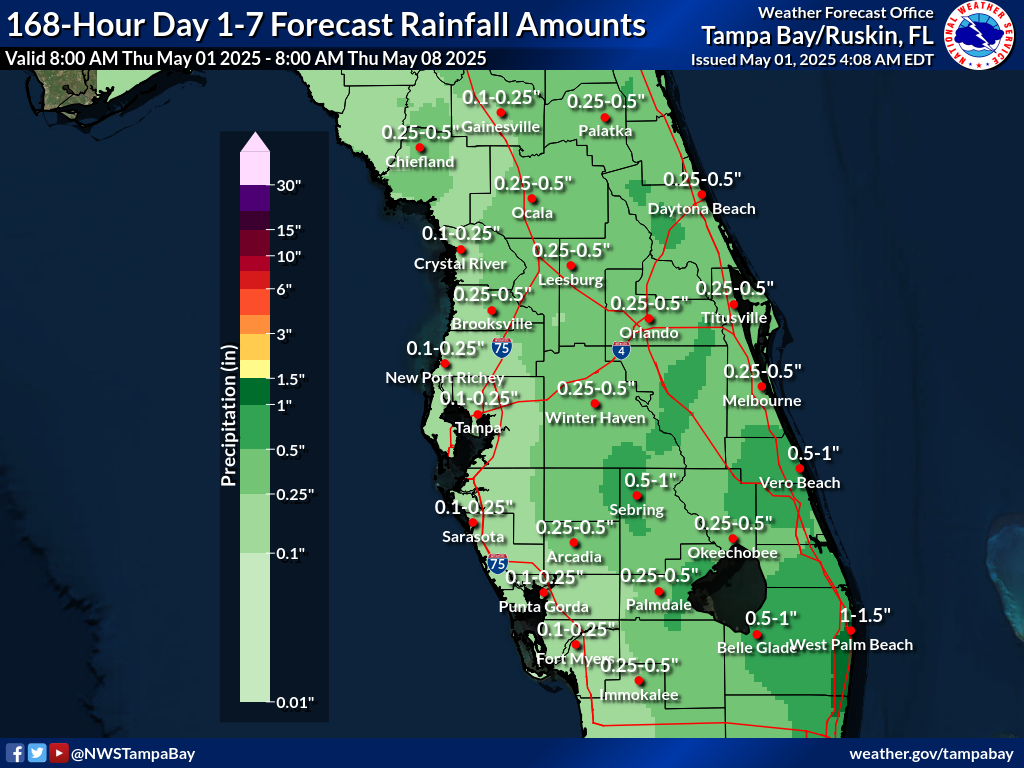
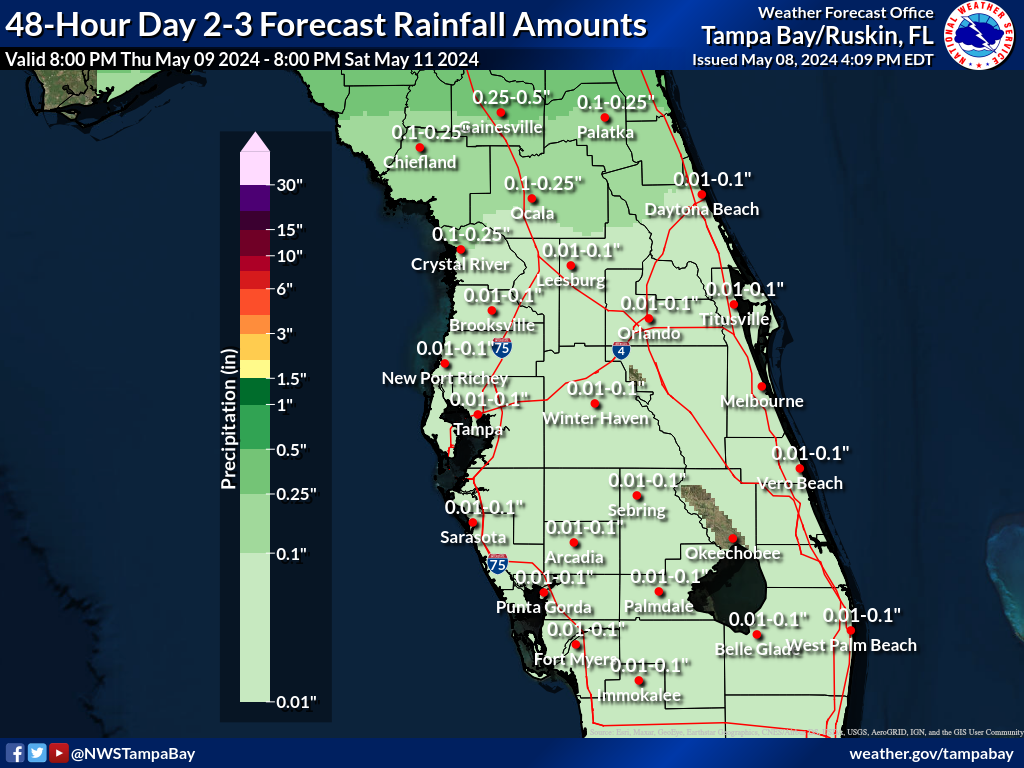
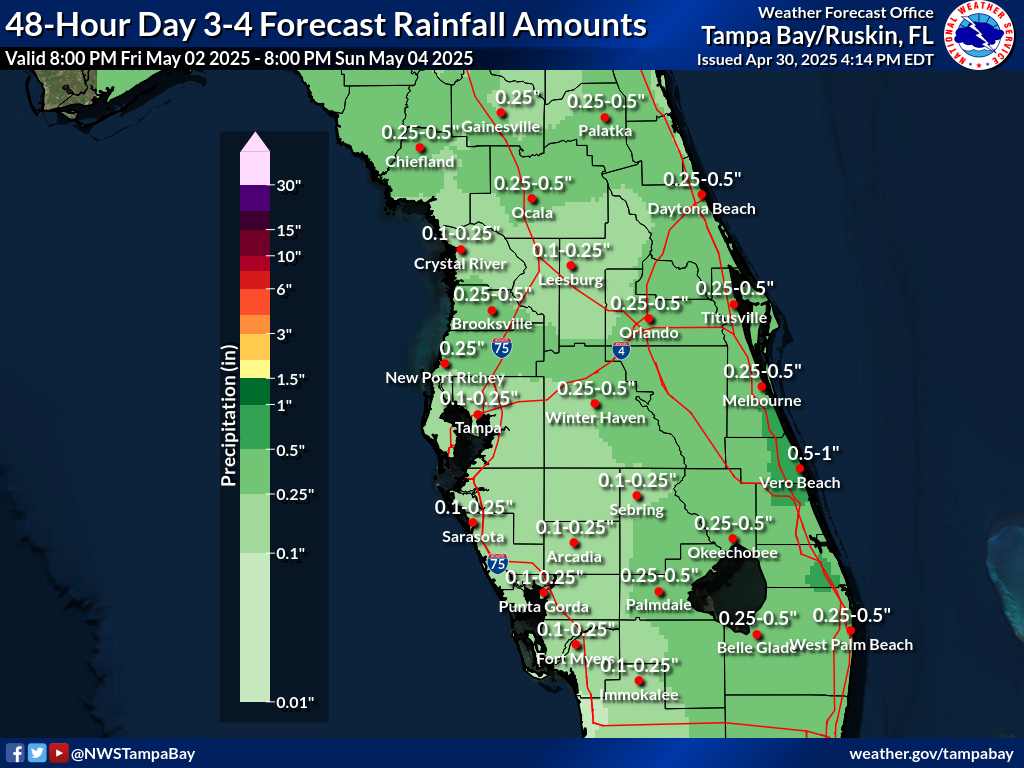
Expected Rainfall (in.)
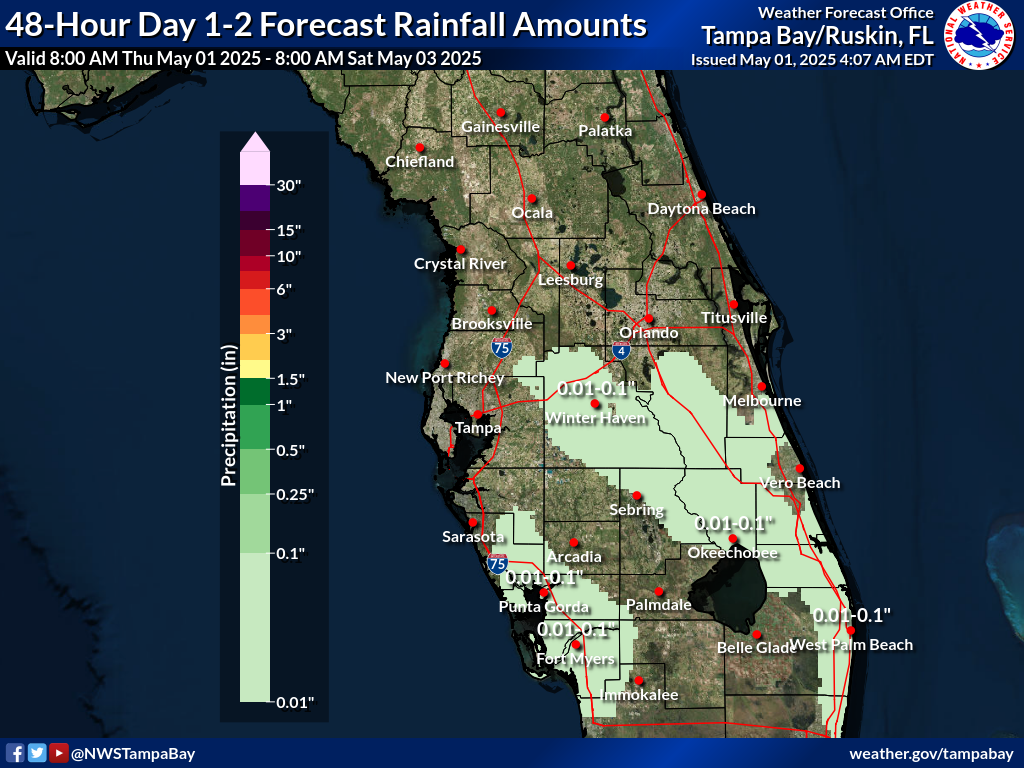
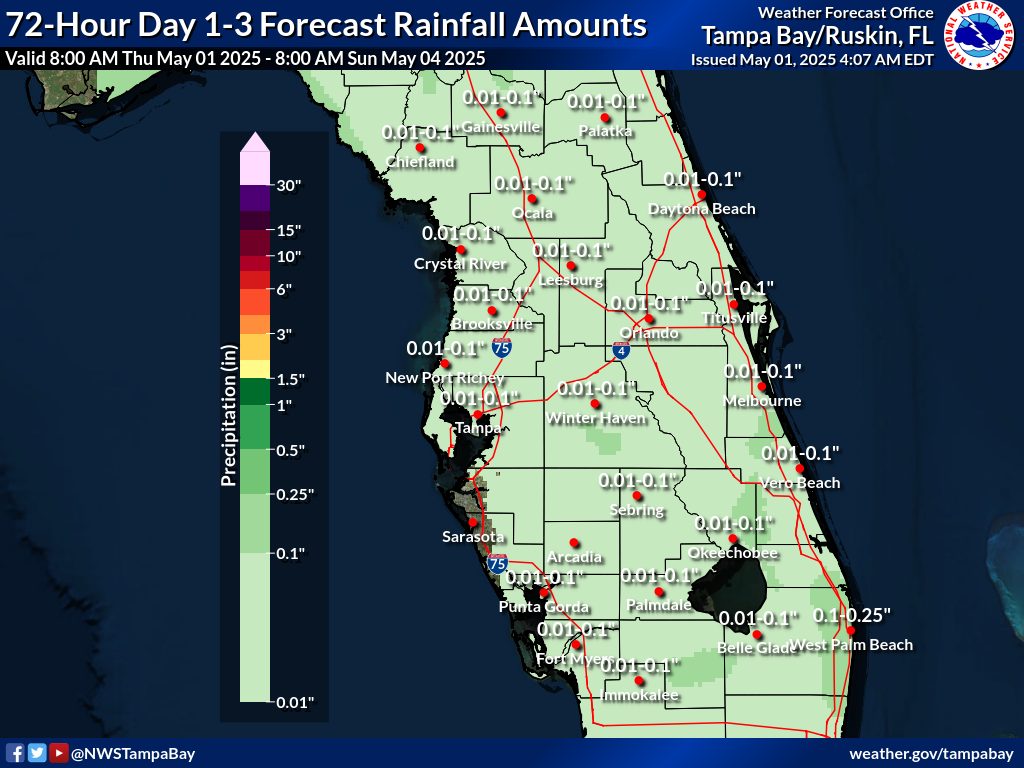
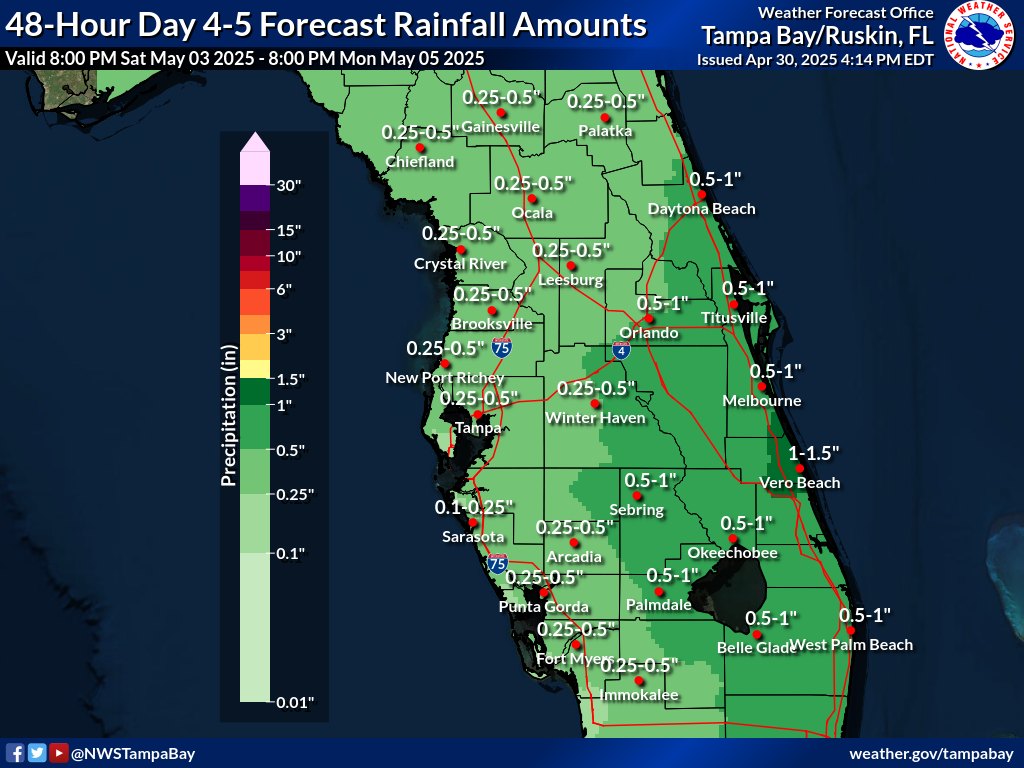
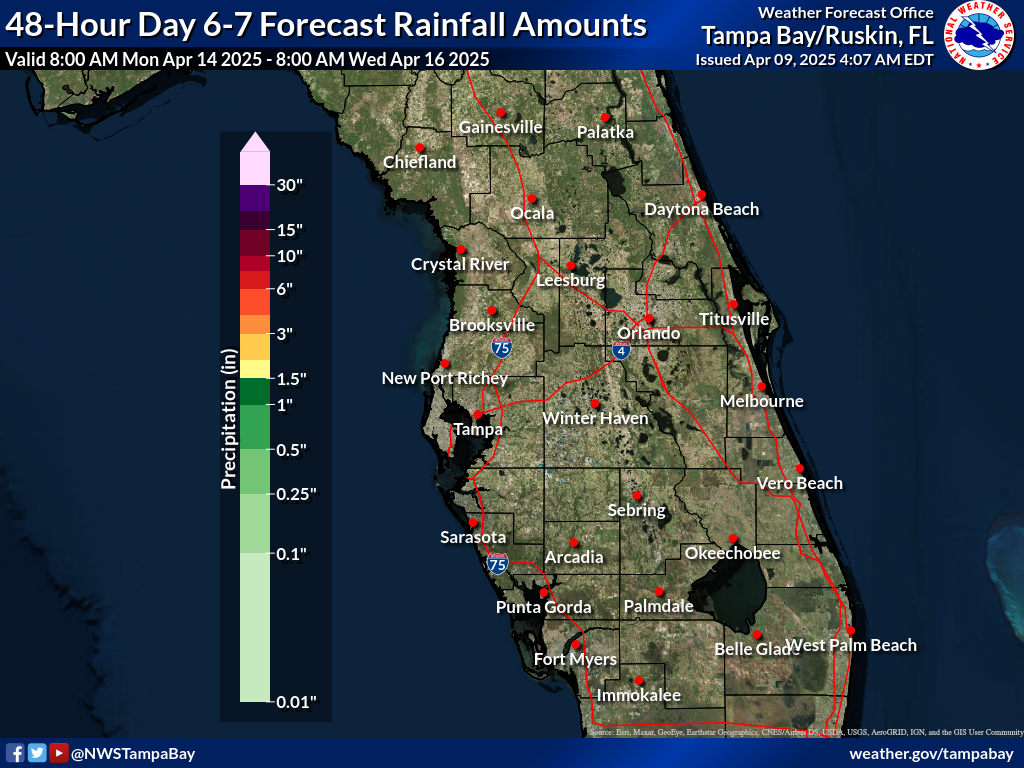
These maps are the official NWS rainfall forecast in inches during the time period shown on the graphic. These rainfall amounts are determined by NWS forecasters to be the most likely outcome based on evaluation of data from computer models, satellite, radar, and other observations.
Day 1-2
Day 1-3
Day 1-5
Day 1-7
Day 2-3
Day 3-4
Day 4-5
Day 6-7
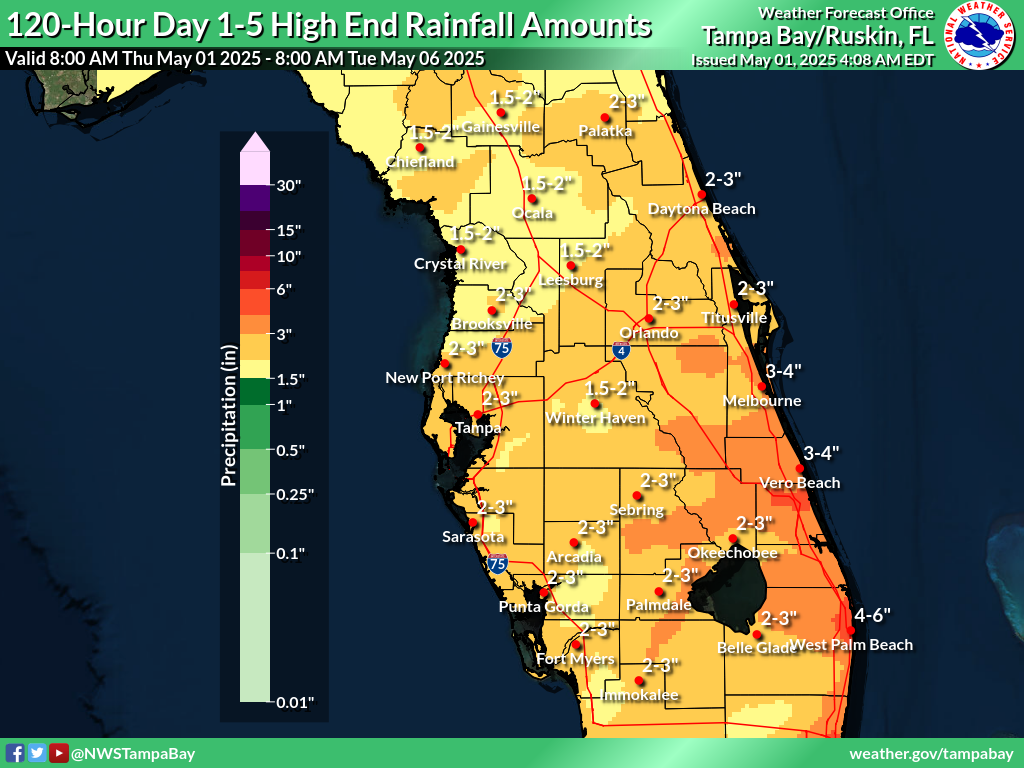
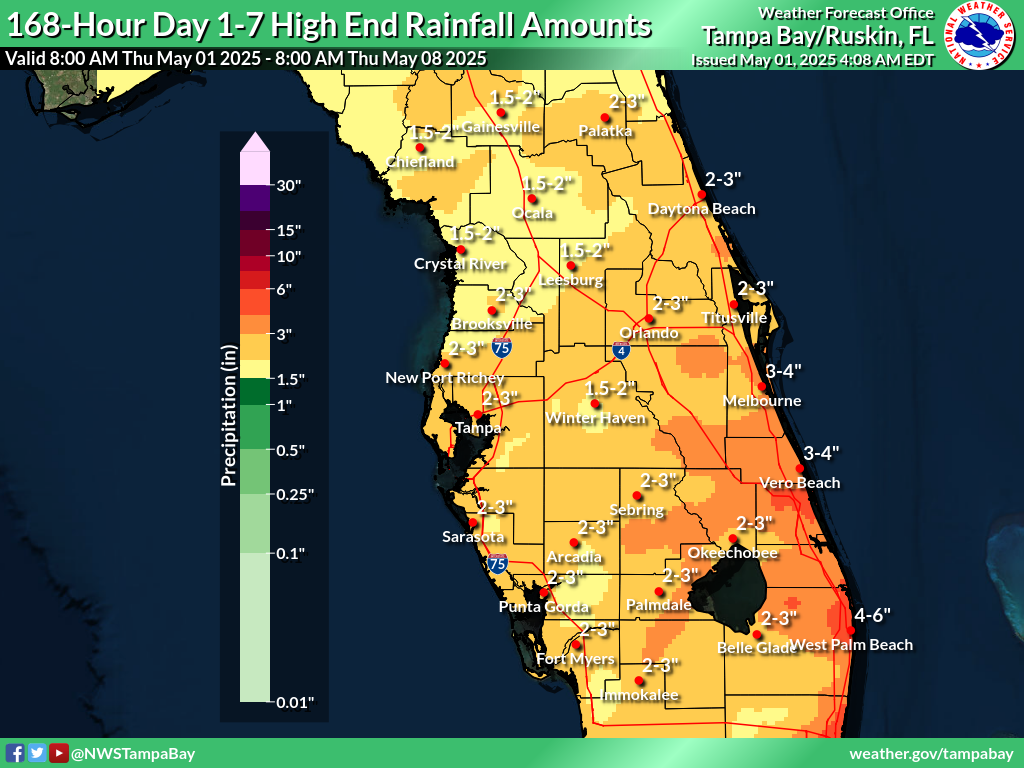
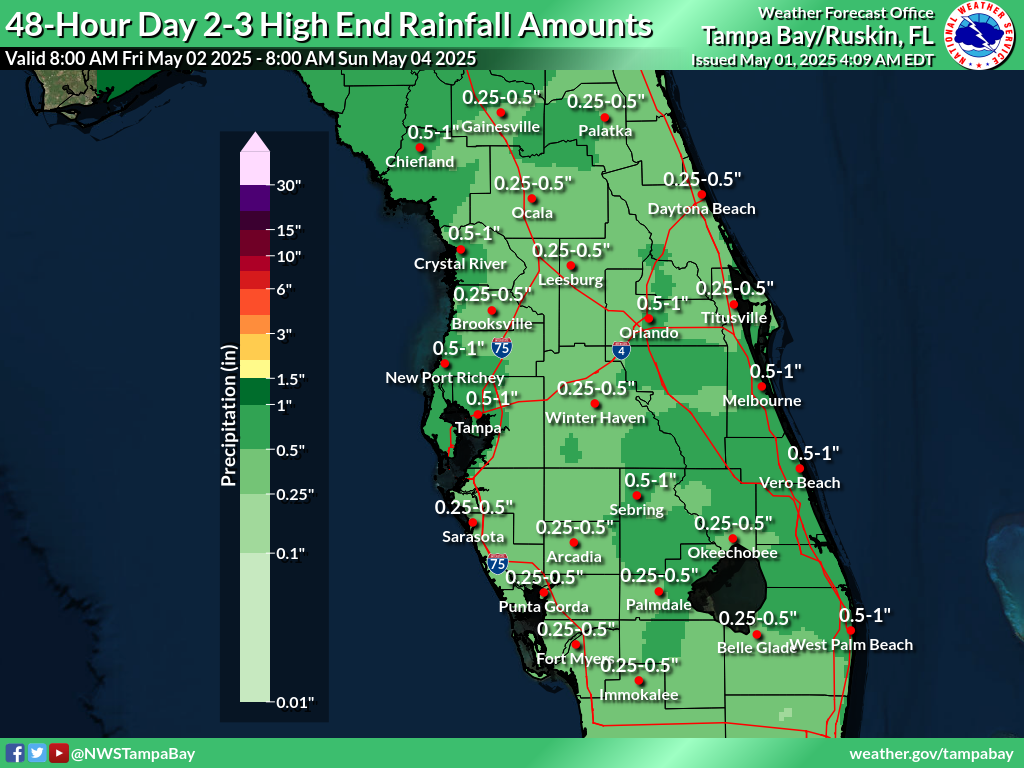
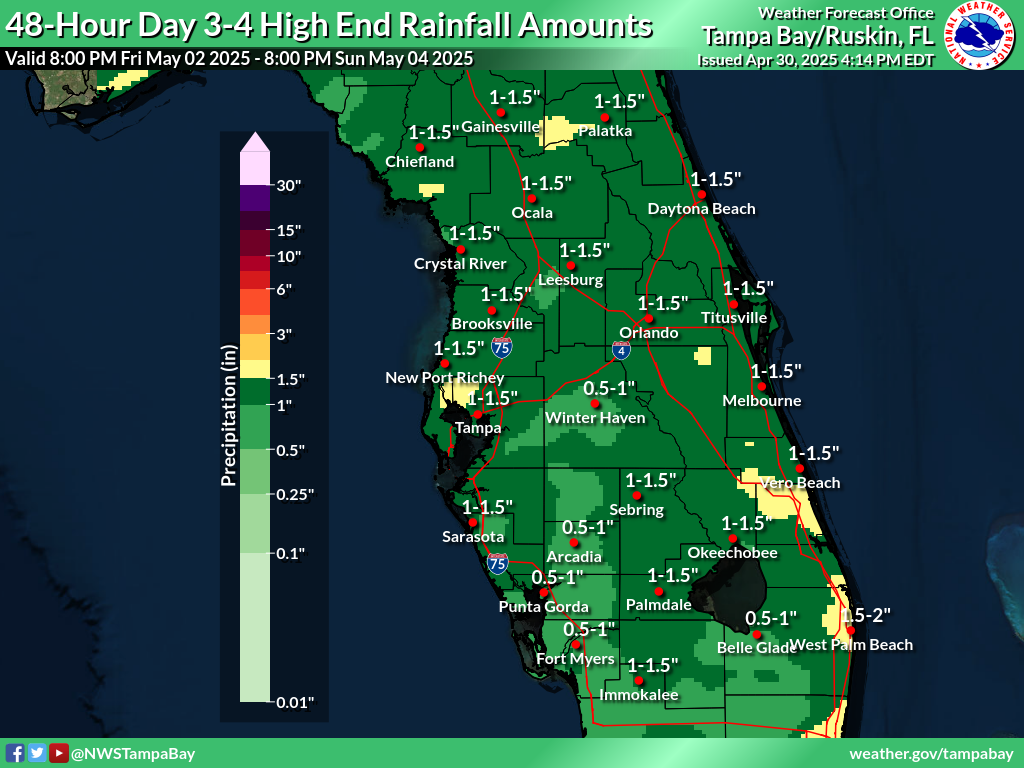
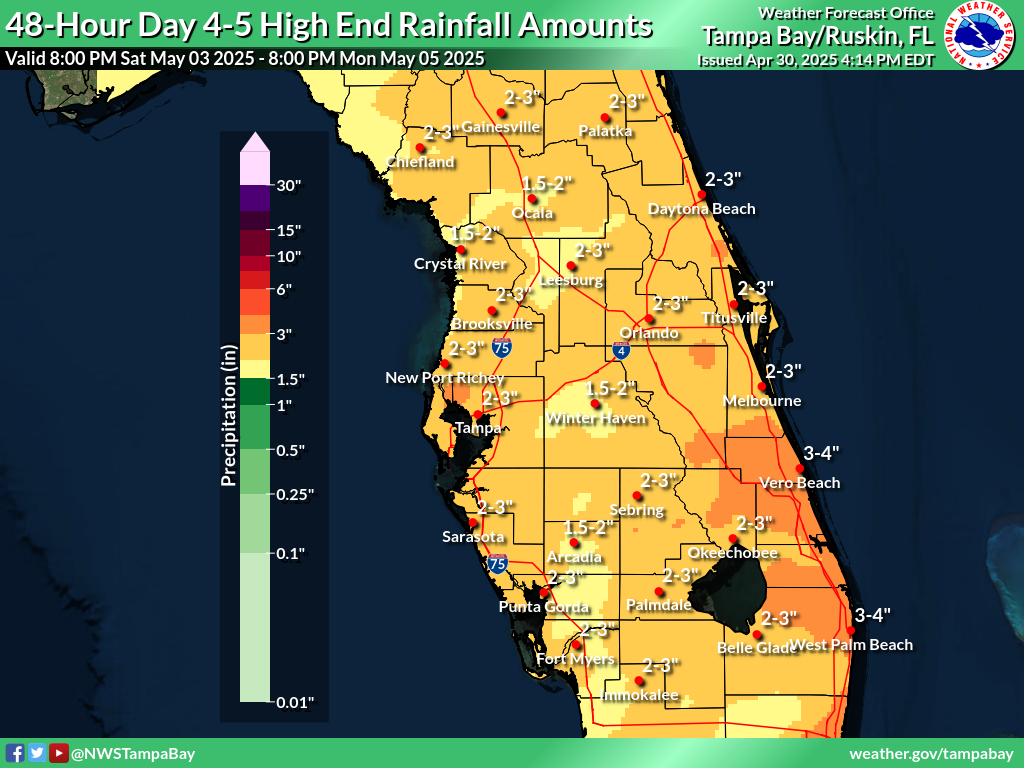
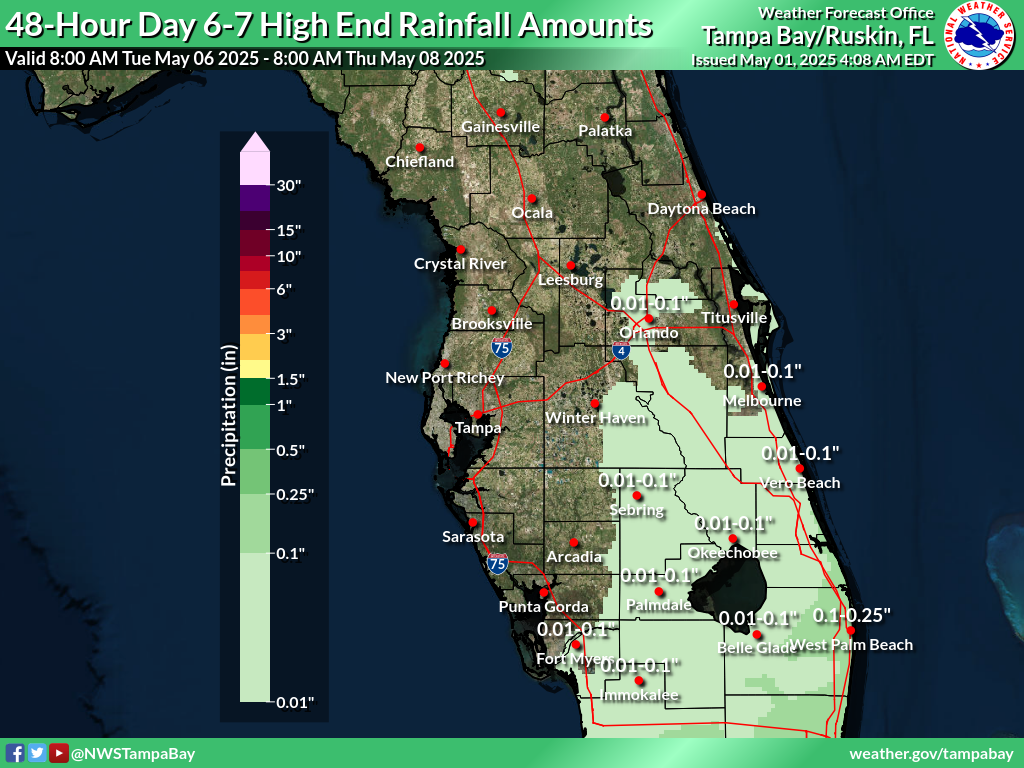
Greatest Possible Rainfall (in.)
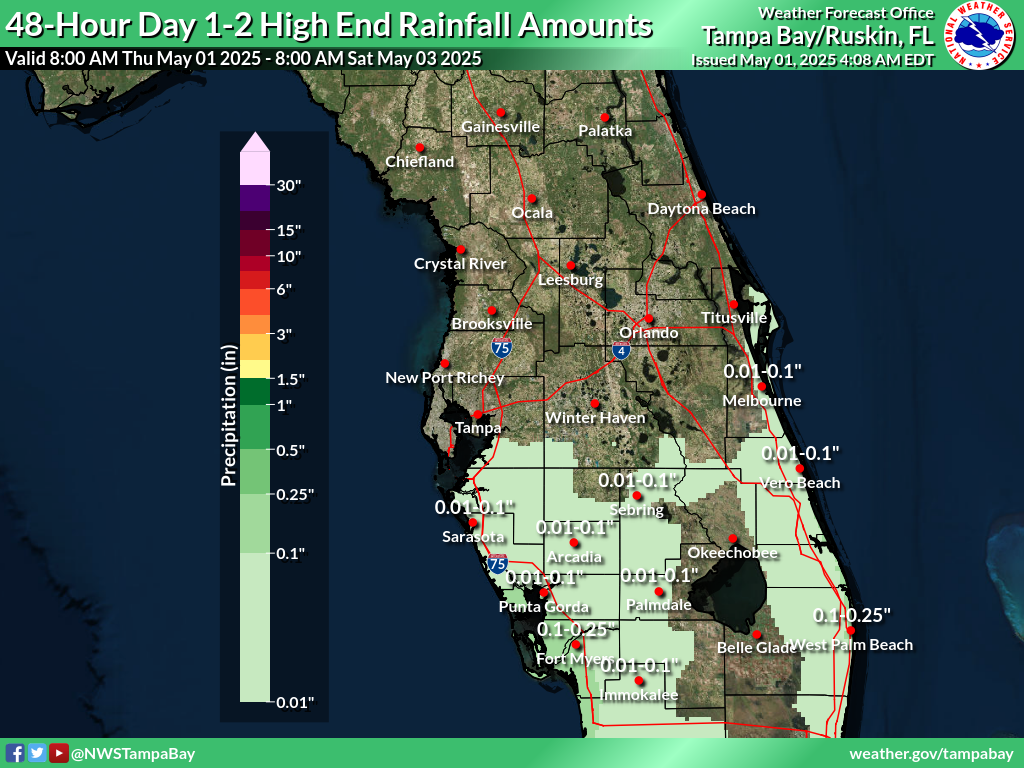
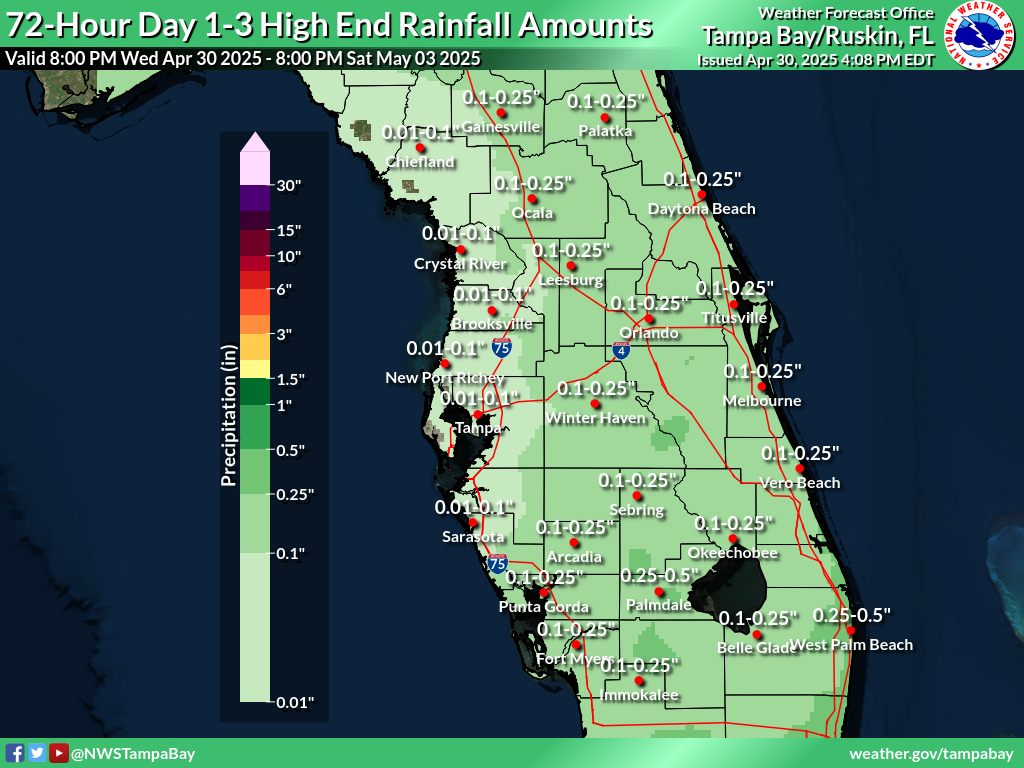
These maps depict a reasonable upper-end rainfall amount for the time period shown on the graphic, based on many computer model simulations of possible rainfall totals. These higher amounts are an unlikely scenario, with only a 1 in 10, or 10% chance that more rain will fall, and a 9 in 10, or 90% chance that less rain will fall. These amounts can help serve as an upper-end scenario for planning purposes.
Day 1-2
Day 1-3
Day 1-5
Day 1-7
Day 2-3
Day 3-4
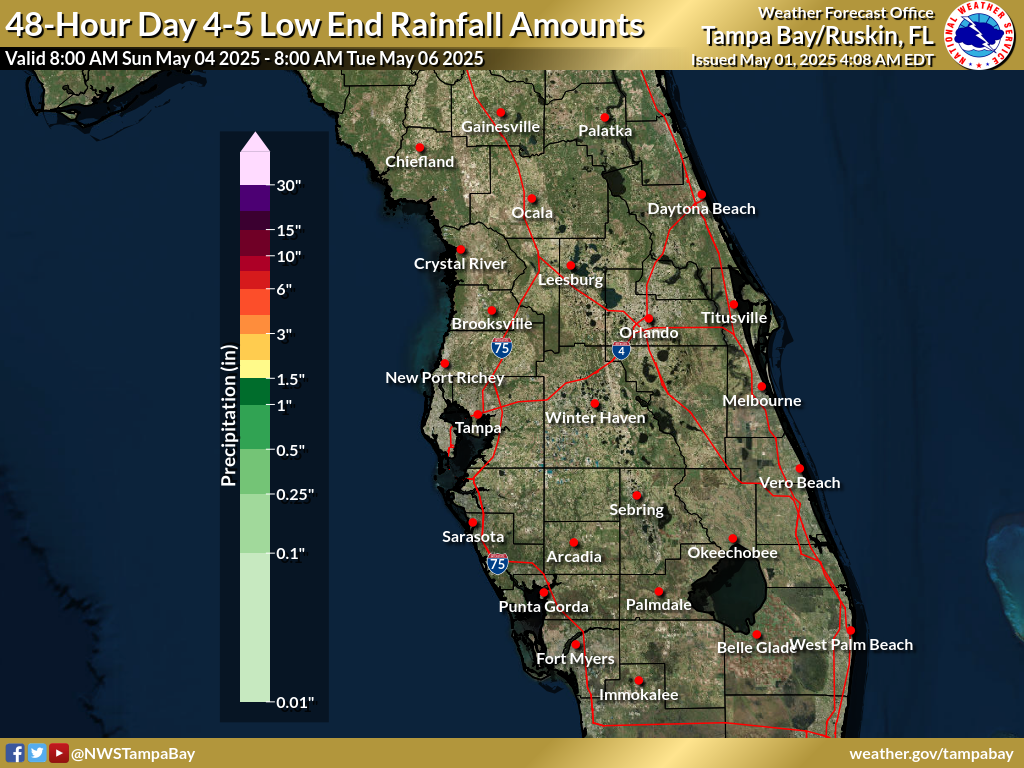
Day 4-5
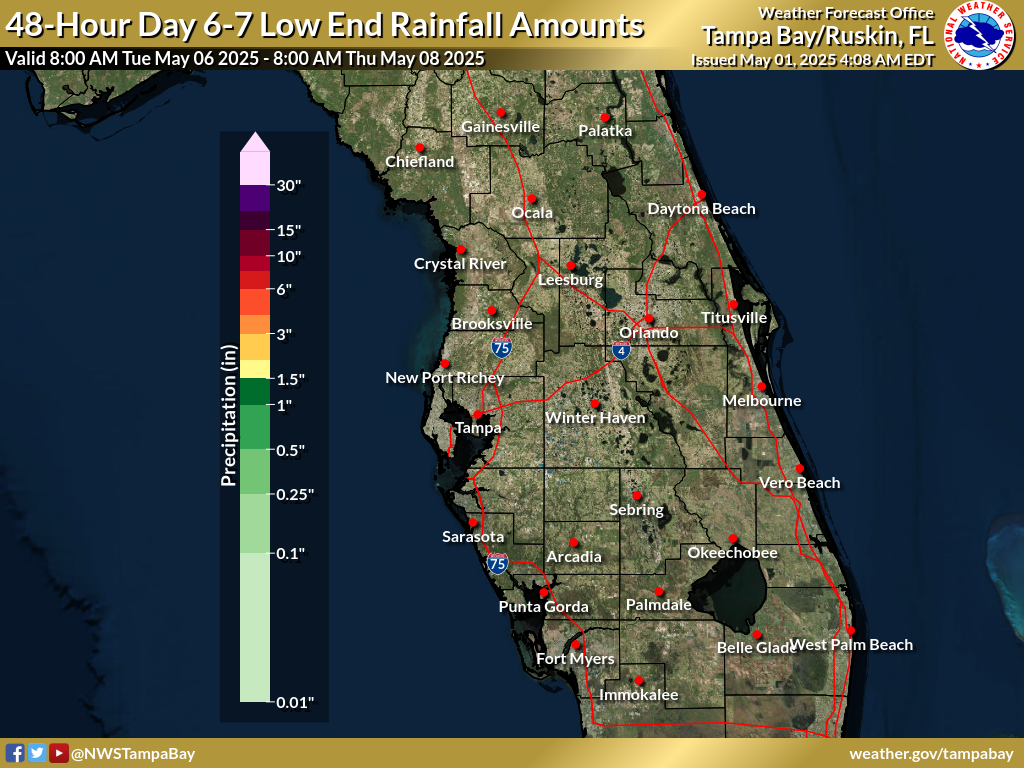
Day 6-7
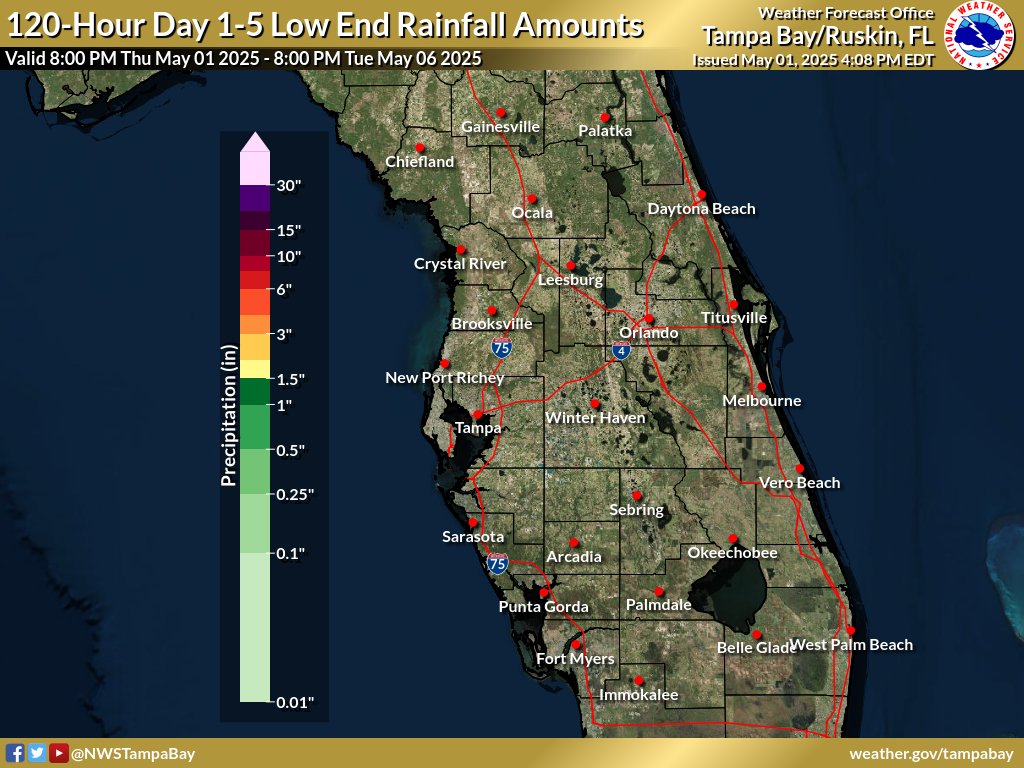
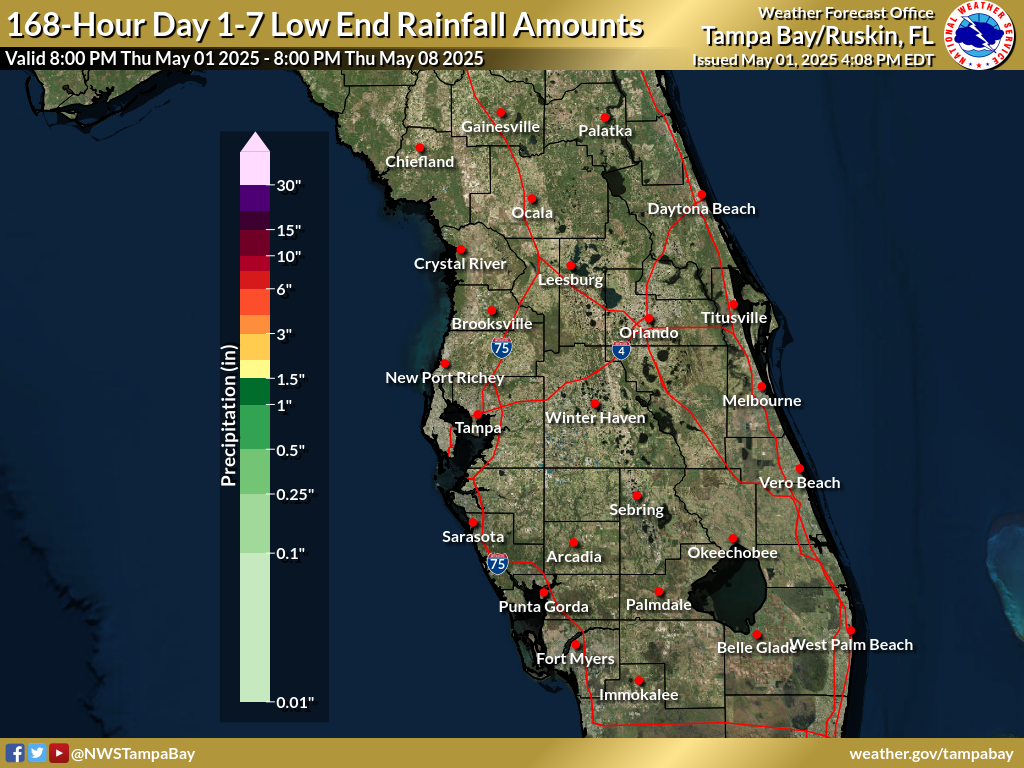
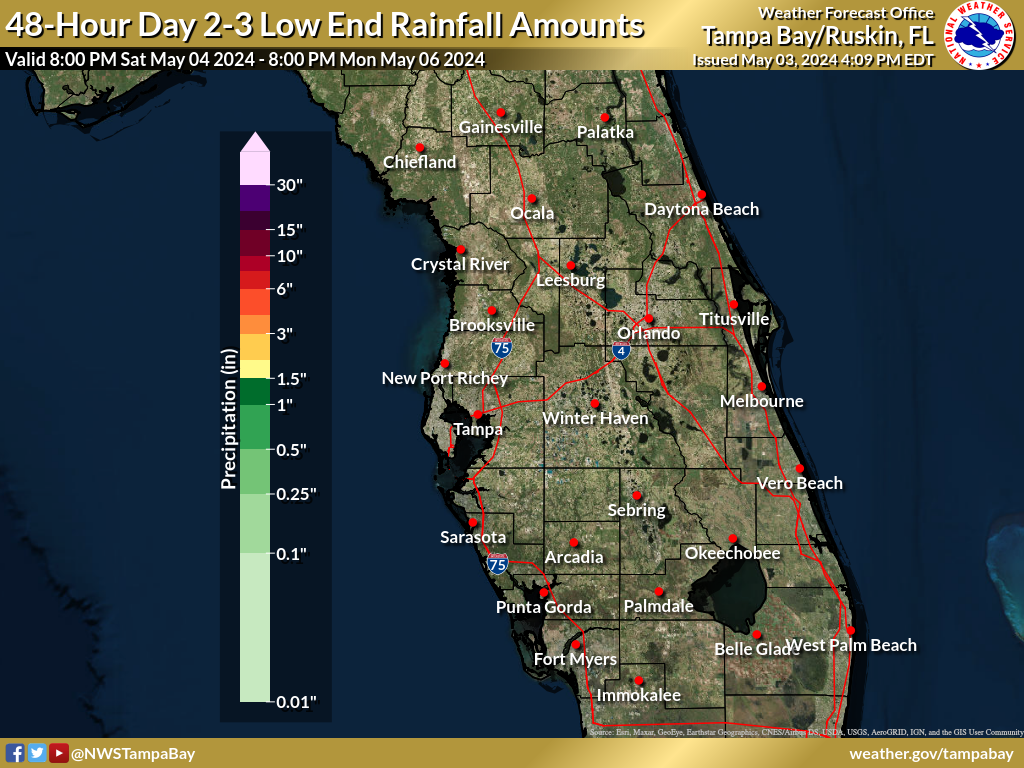
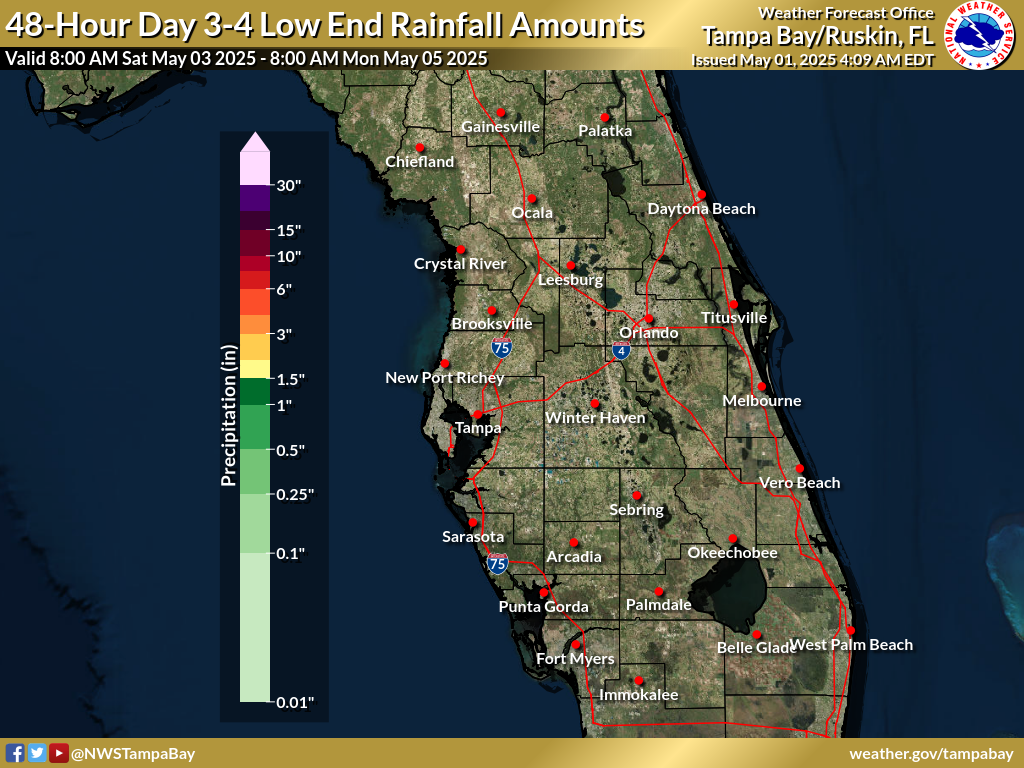
Least Possible Rainfall (in.)
These maps depict a reasonable lower-end rainfall amount for the time period shown on the graphic, based on many computer model simulations of possible rainfall totals. These lower amounts are an unlikely scenario, with a 9 in 10, or 90% chance that more rain will fall, and only a 1 in 10, or 10% chance that less rain will fall. These amounts can help serve as a lower-end scenario for planning purposes. On many occasions these graphics will be blank, which depicts that the low end is for no measurable rainfall.




.png)
.png)







 Follow us on X
 Follow us on Facebook
 Follow us on YouTube
 CRP RSS Feed