
Dangerous and extreme heat will remain across portions of the southern U.S. this week. Heavy rainfall may bring significant flash flooding across portions of the Mid-Atlantic and Northeast through the night, and additional flash flooding concerns across New England on Wednesday. Monsoonal thunderstorms will bring a flash flood risk to the Four Corners region, especially in burn scar areas Read More >
It has been fifty years since Hurricane Celia blasted the Coastal Bend. On August 3rd 1970, Hurricane Celia made landfall near Aransas Pass as a major Category 4 hurricane on the Saffir-Simpson scale with sustained winds of 140 mph. Hurricane Celia was the third major hurricane to impact the Middle Texas coast in a 9-year period (Carla in 1961 and Beulah in 1967). Hurricane Celia caused 15 fatalities in South Texas and 466 injuries. Celia's life cycle consisted of two rapid intensification periods, but most interesting was the explosive damaging wind gusts in the western semi-circle of the eye wall, in addition to the typical damaging eastern half of the center
Hurricane Celia formed into a tropical depression in the northwest Caribbean Sea, west of the Cayman Islands, on July 30th 1970. The tropical depression clipped the northern portion of Cuba and became Tropical Storm Celia (winds greater than or equal to 39 mph) during the morning of August 1st when it entered the Gulf of America. Celia quickly intensified into a major hurricane by late afternoon with sustained winds measured at 115 mph and a central pressure drop of 25 millibars (mb) over an 8-hour period. The intensification was brief as winds decreased to 90 mph during the morning of August 2nd (see map below).
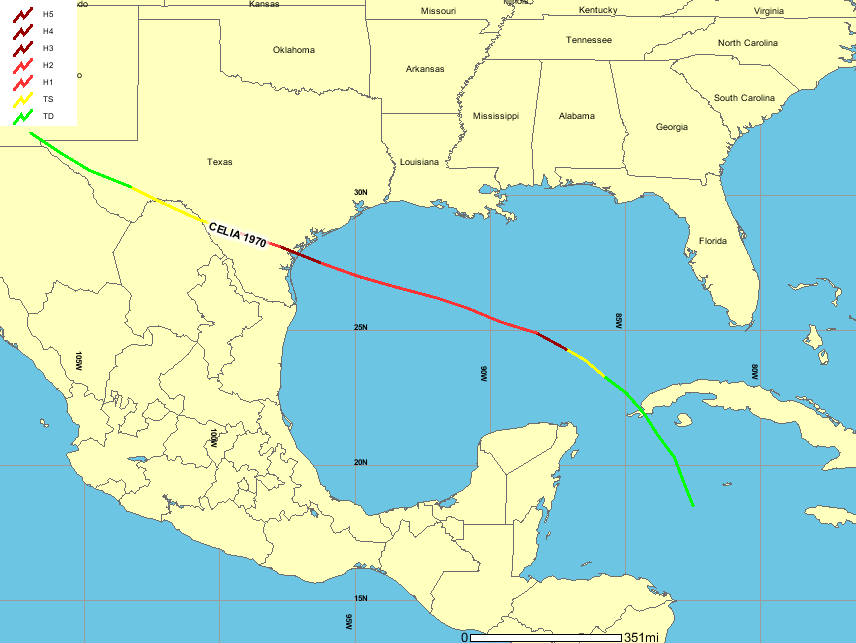
Although Celia remained on a west-northwest course, the forecast anticipated a turn to the right prior to landfall in Texas. Hurricane warnings were issued for the Upper Texas Coast during the morning of August 2nd. However, Celia stayed on track for a direct hit on Corpus Christi. Hurricane warnings were issued on the morning of August 3rd for Corpus Christi for a high end category 1 or low end category 2 storm (90 to 100 mph sustained winds). For residents and visitors that waited, there was limited time to make proper preparations or evacuate before Celia made landfall. Conditions worsened quickly as Celia underwent rapid intensification prior to landfall. The central pressure dropped 44 mb in 15 hours, plummeting to 944 mb or 27.88 inches of mercury (measured at Ingleside) at landfall during the afternoon of August 3rd. Celia was a category 4 storm with sustained winds of 140 mph, measured at Corpus Christi International Airport and 130 mph at Aransas Pass. The tropical cyclone weakened down to a tropical storm by the time it reached interior Texas near Cotulla, but remained tropical storm strength as it passed Del Rio, producing a million dollars of damage to the city. Celia weakened to a tropical depression when it reached the Big Bend of Texas and remained similar intensity through El Paso Texas before weakening.
A persistent upper level high pressure system was over the southern Rockies eastward into the Southeast United States on July 31st (upper left quadrant below). When Celia moved into the southern Gulf of America on August 1st (upper right quadrant), the high pressure steered the storm to the west-northwest. The forecasts at the time expected Celia to make a turn to the northwest and impact the upper Texas Coast. However, as seen in the lower right quadrant below, the high pressure did not shift to the east until the evening of August 3rd, when Celia was making landfall in South Texas. Celia moved northwest to about El Paso Texas when it was a tropical depression by August 5th.
 |
 |
| 0000 UTC 1 August 1970 500-mb winds (~20,000 ft). | 0000 UTC 2 August 1970 500-mb winds. |
 |
 |
| 0000 UTC 3 August 1970 500-mb winds. | 0000 UTC 4 August 1970 500-mb winds. |
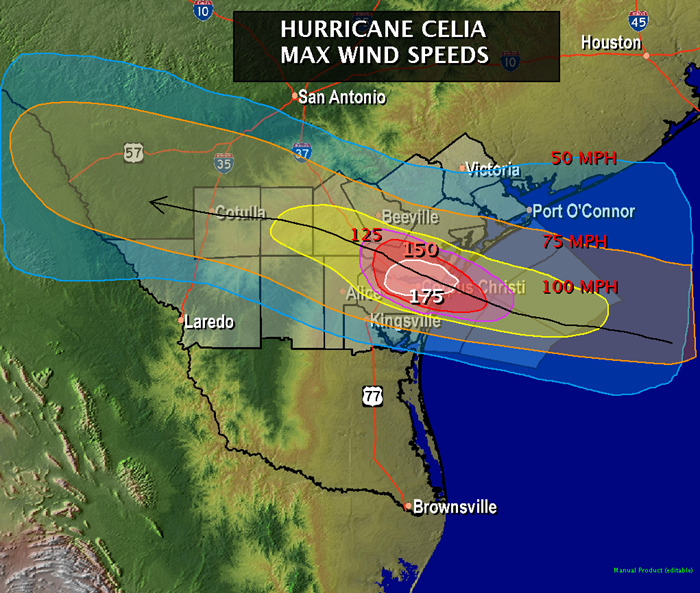
Most hurricanes produce significant damage from the storm surge as water piles up ahead of the cyclone. However, Celia caused the most impact from extreme winds across a metropolitan area. When the eye of storm moved across Corpus Christi Bay, sustained winds of 110 to 140 mph occurred in Nueces County (including the city of Corpus Christi) north into the southern portion of Refugio County. The strongest winds occurred in less than 30 minutes across Corpus Christi but caused the most significant damage. Most notable were the wind gusts which were 30 to 40 mph stronger than the sustained winds. The highest estimated wind gust was 180 mph at Aransas Pass and Robstown.
|
Location |
Maximum Sustained Winds (direction and mph) |
Maximum Wind Gusts (direction and mph) |
|
Aransas Pass |
NNE 130 |
SW 180 mph* |
|
NWS Corpus Christi |
SW 125 |
SW 161 |
|
Port Aransas Coast Guard |
NNE 104 |
NNE 127 |
|
Gregory (Reynolds Plant) |
NNW 128 |
NNW 138 |
|
Refugio 3 south |
NNE 120 |
NNE 160* |
|
Bayside |
E 110 |
ESE 140* |
|
Portland/Odem |
|
N and S 160* |
|
Robstown |
|
WSW 180* |
|
Mathis |
N 100* |
N 150* |
*- estimated
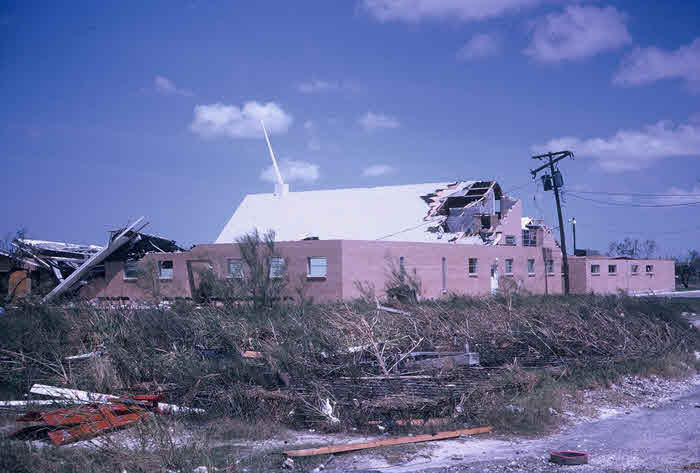
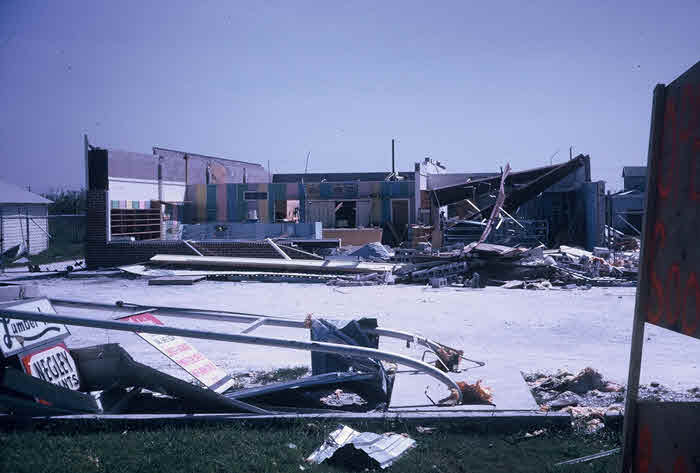
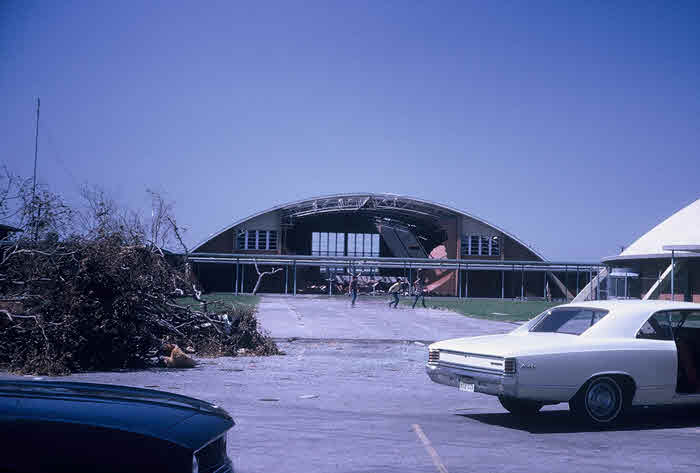
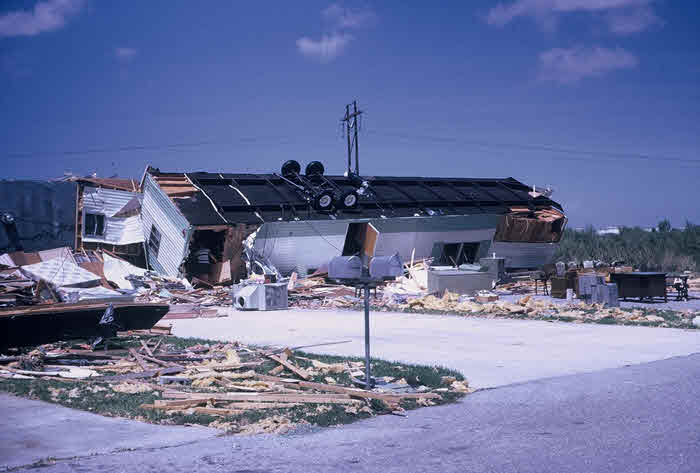
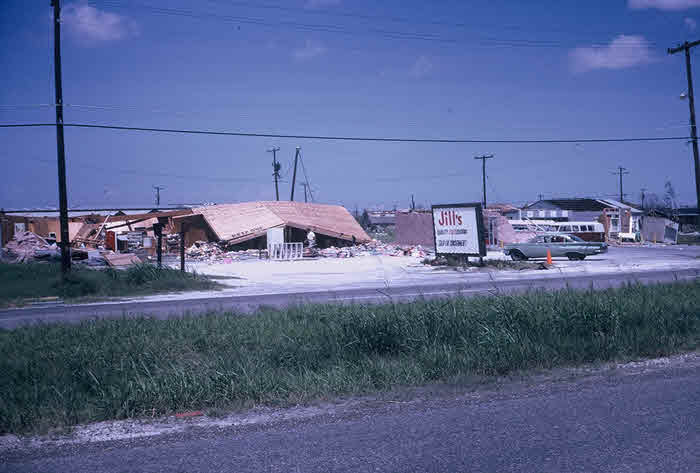
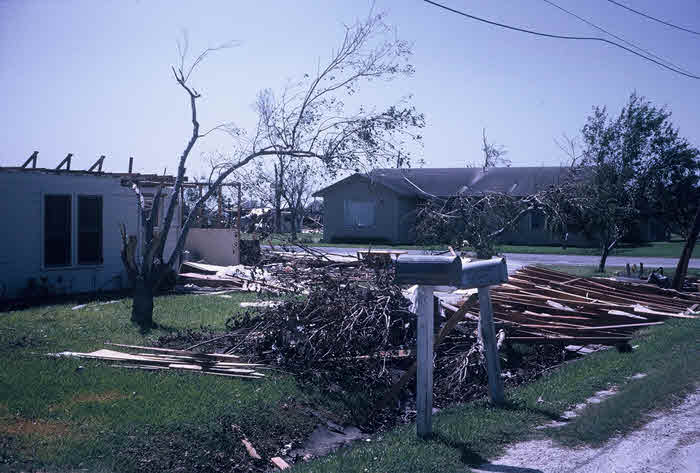
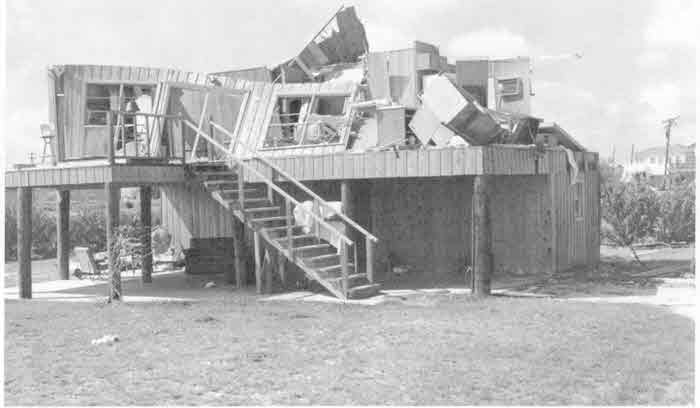
Most of the destruction appeared to be similar to what is usually associated with a tornado, but site surveys did not show any circulation within the damage areas. Tornado damage referenced in the Fujita scale would indicate widespread EF-2 damage with pockets of EF-3/EF-4 damage across the Coastal Bend. The damage was peculiar since some homes were untouched in the devastated areas. Dr. Robert Simpson, then the director of the National Hurricane Center and cofounder of the Saffir-Simpson scale in 1971, surveyed the damage in Corpus Christi from aircraft. He described the damage as "a succession of long streaks of heavy damage...as small pockets of high energy winds radially spaced from north to south at interval lengths of a mile or more, raked across Corpus Christi from west to east."
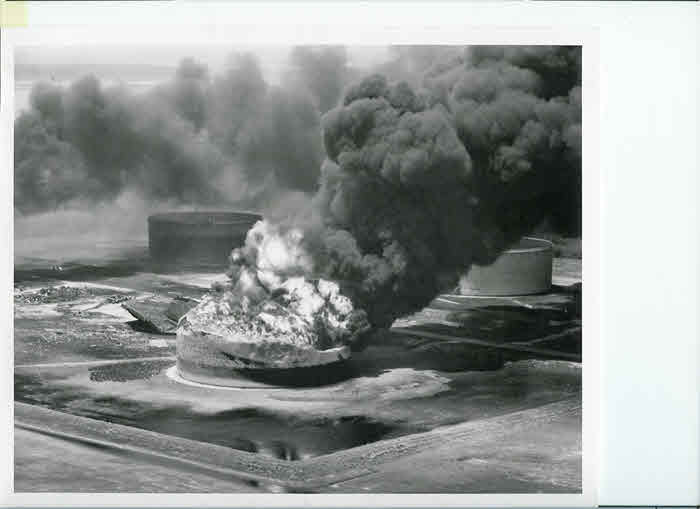
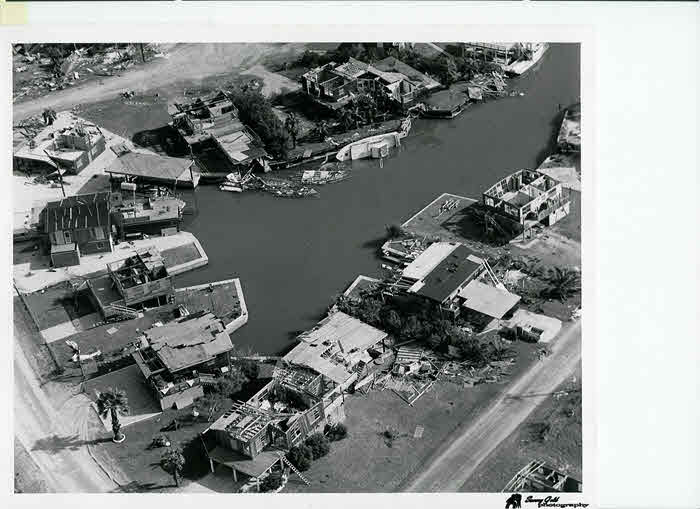
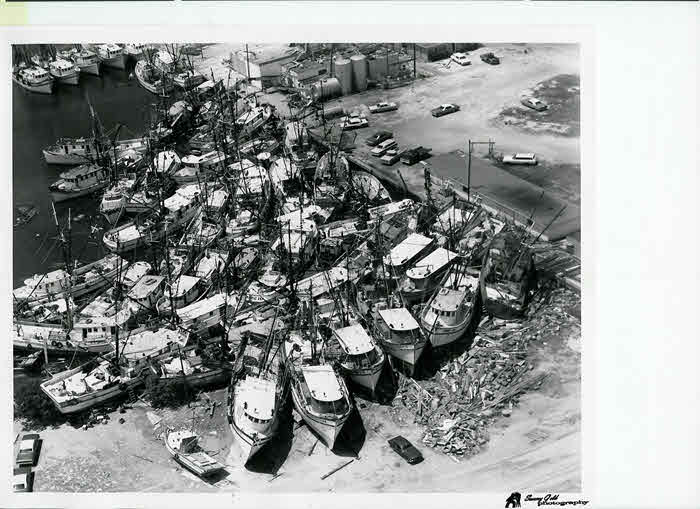
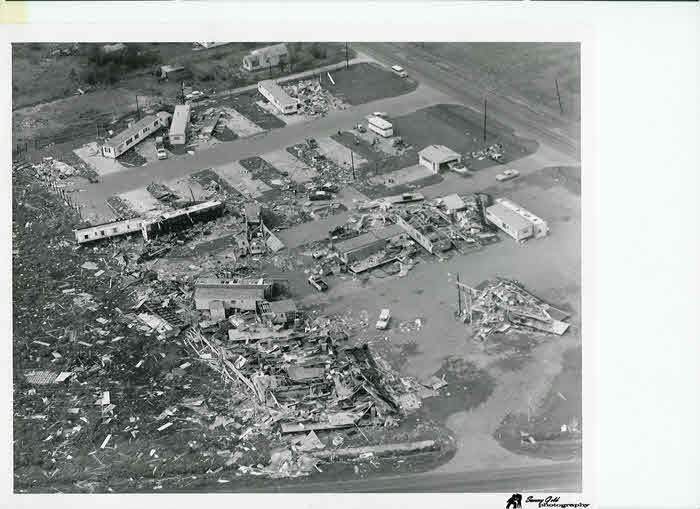
The extreme winds from Hurricane Celia produced staggering property damage to the Coastal Bend community. Damage was most significant in the counties of Nueces, San Patricio, and Aransas, generally around Corpus Christi Bay. The hardest hit areas included the Corpus Christi metro area, Port Aransas, Aransas Pass, Robstown, and Portland. In Corpus Christi, 70 percent of residences suffered some damage. For Portland and Port Aransas, 90 and 75 percent respectively suffered home and business damages respectively. About 9,000 homes were destroyed in the Coastal Bend, 13,850 homes suffered major damage, and 41,800 homes had at least minor damage. Commercial losses included 252 businesses destroyed, 331 boats lost, and 310 farm buildings damaged from the Hurricane. Over 3,000 power poles were knocked down and mobile homes were shredded and were a total loss. The total property and crop damages were estimated at $453.8 million ($3.1 billion in 2020 dollars). Celia was the costliest storm to hit Texas at the time, surpassing Hurricane Carla, a category 4 storm in 1961.
Due to Hurricane Celia's late intensification just prior to landfall and its compact size, the storm surge was not significant. The highest storm surge occurred at Port Aransas where the tides reached 9.2 feet on the beach and 9.0 feet at the jetty. There was only minor damage in Port Aransas from the storm surge impact. The tides ranged from 3 to 5 feet from Corpus Christi north to Baytown and Galveston Texas.
|
Location |
Highest Surge (feet) |
|
Port Aransas Beach |
9.2 |
|
Mustang Island |
7.9 |
|
Lavaca Bay Park - |
5.8 |
|
Baytown |
5.3 |
|
Rockport |
5.0 |
|
Corpus Christi Bayfront |
4.9 |
|
Freeport - |
4.9 |
|
La Porte |
4.8 |
Hurricane Celia produced several tornadoes that affected various parts of South Texas. The number of tornadoes was much less than what occurred in 1967 from Hurricane Beulah. One of the eight tornadoes killed a man near Lake Corpus Christi and caused 2 injuries. The eight tornadoes occurred in the following locations: Port O'Connor, Lake Corpus Christi to 1 mile north of Sandia, 4 miles southeast of Refugio, near Yoakum in DeWitt County, 10 miles west of Dilley in Frio County, north of Katy in Harris County, and Alvin in Brazoria County.
Celia also differed from Hurricane Beulah in 1967, which was a slow and large cyclone that produced widespread flooding across South Texas. Beulah produced record flood levels on the Nueces River basin. Since Hurricane Celia was compact and fast moving when it crossed the Coastal Bend rainfall amounts only ranged from 5 to 7 inches, with a maximum of 7.26 inches at Robstown.
Satellite imagery was coming out of its infancy in 1970, but there were several visible satellite images taken of Hurricane Celia. The image below depicts the life cycle of the Hurricane from July 30th to August 6th.
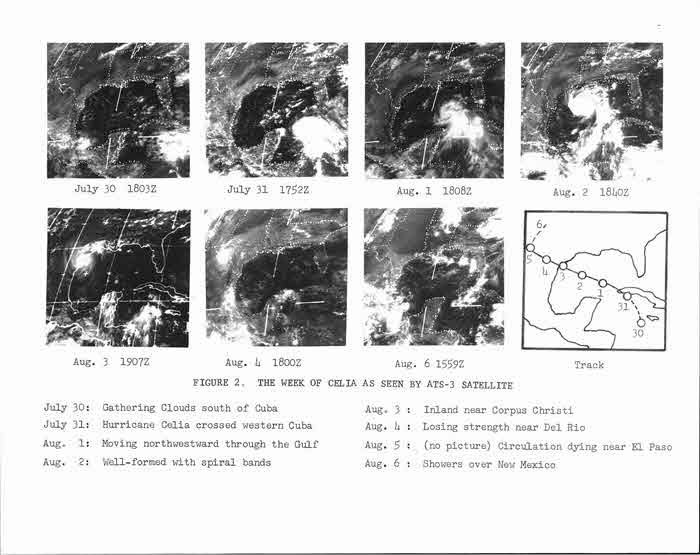
The visible image most notable was when Hurricane Celia was making landfall on the south Texas Coast on the afternoon of August 3rd and the eye of the storm can been seen near Port Aransas.
The National Weather Service (NWS) issued several local statements for Hurricane Celia. The statements updated the hazardous situation when Celia approached the coast. The statements indicated the "ESSA Weather Bureau" in Corpus Christi, since at the time the NWS was under the parent agency named the Environmental Science Services Administration (ESSA), which was later reorganized to become the National Ocean and Atmospheric Administration (NOAA).
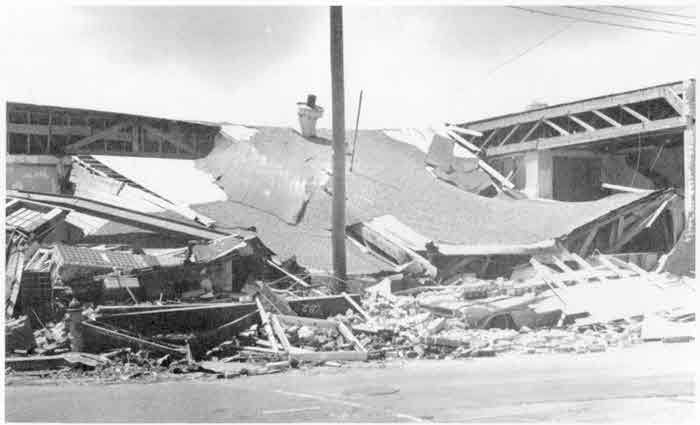
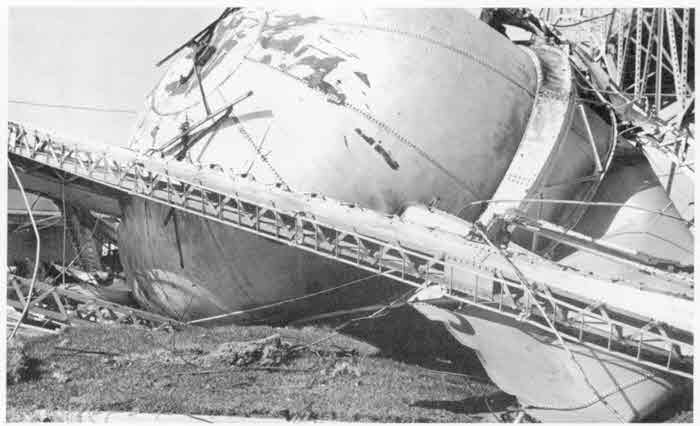
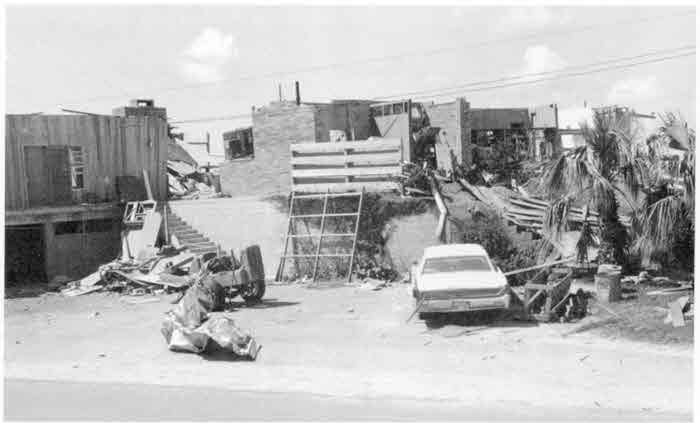
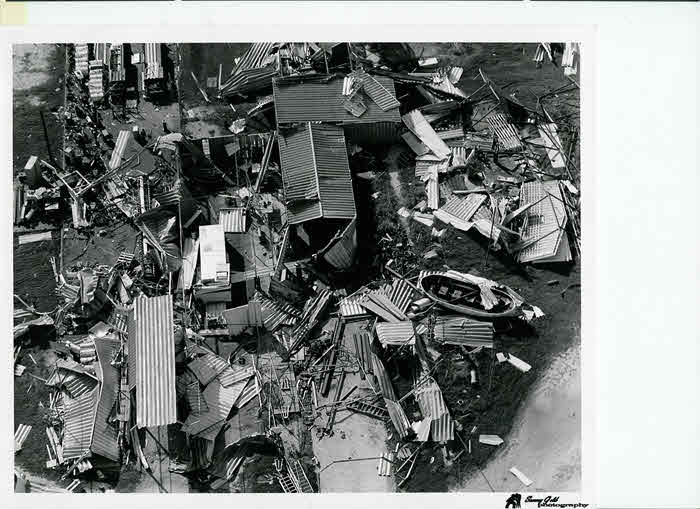
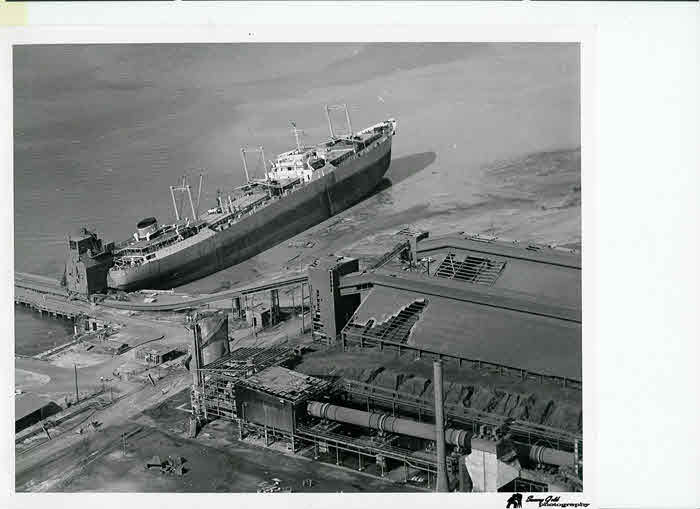
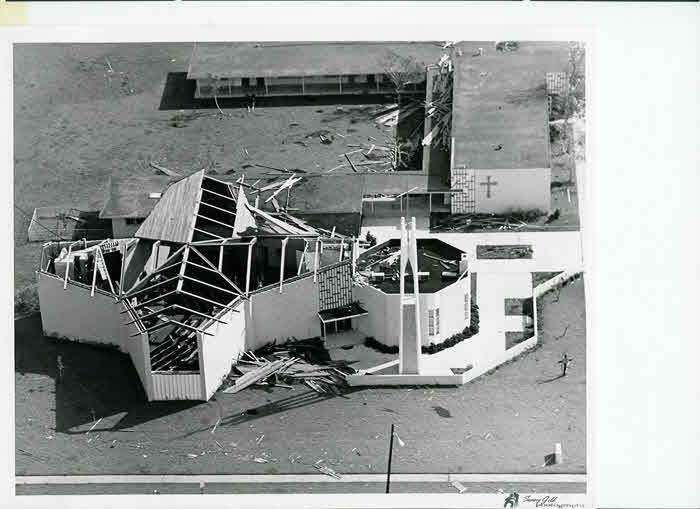
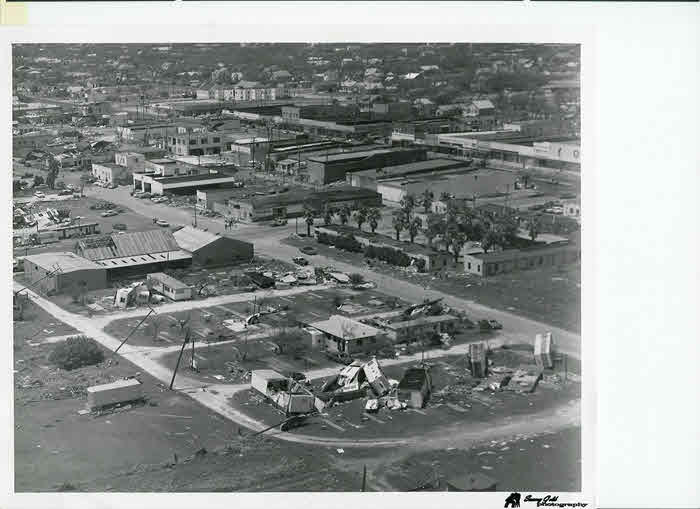
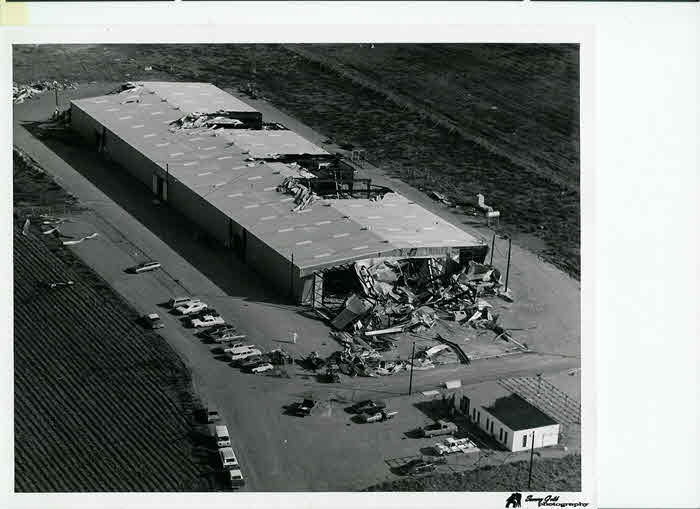
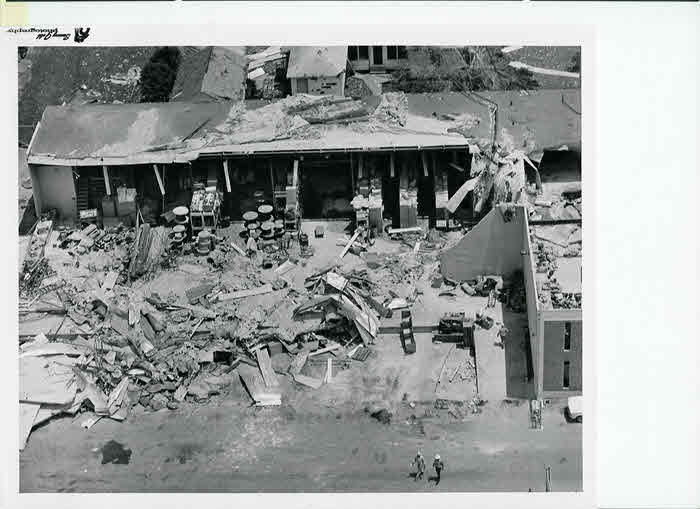
The images below in color were taken in the Annaville area. The black and white photos were selected from a variety of areas across the Coastal Bend of Texas.
 |
 |
 |
 |
 |
 |
 |
 |
 |
 |
 |
 |
 |
 |
 |
 |
 |
 |
 |
 |
 |
 |
 |
 |

