Overview
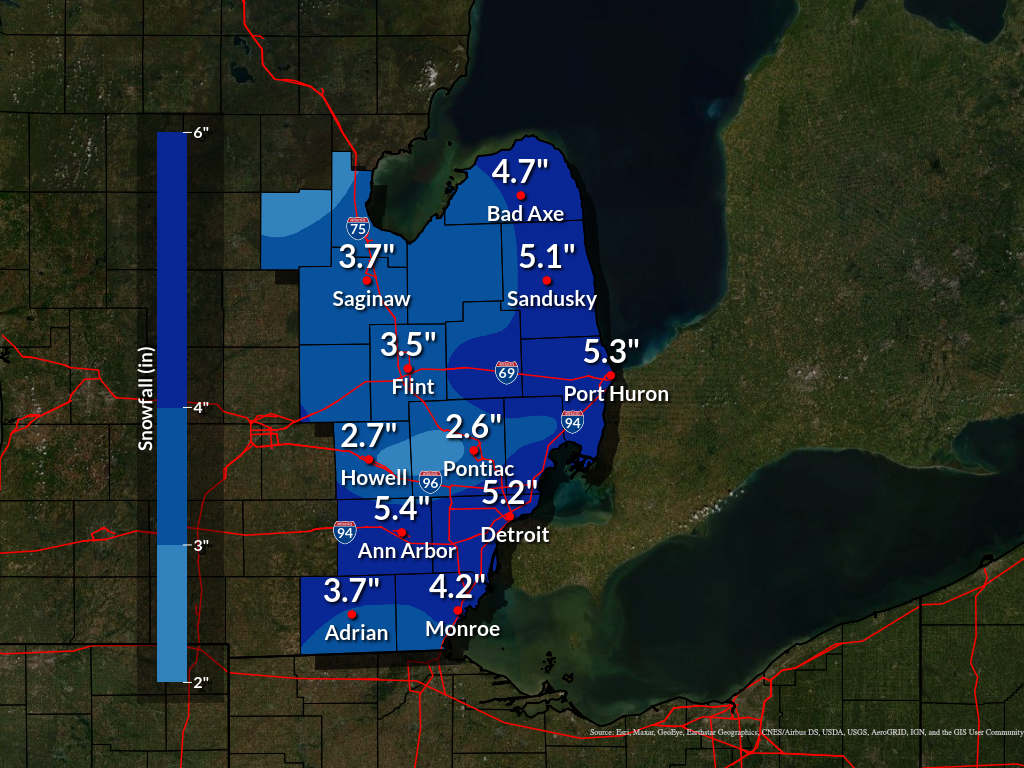
A winter storm impacted southeast Michigan mainly during the morning and mid-day hours of March 10th, 2023. This system produced widespread snow accumulations of 2 to 5 inches with locally higher amounts in excess of 5 inches concentrated south of I-94 and near the Lake Huron shoreline. Just to our west in Grand Rapids, localized accumulations up to a foot were reported likely due to a robust snowband on the leading edge of the precipitation shield. Snow to liquid ratios favored typical snowflake characteristics for early March, resulting in a drier/fluffier snow in comparison to the March 3rd, 2023 winter storm. A notable feature of this system was the substantial melting that occurred throughout the day, owing to the March sun angle and daytime temperatures rising into the mid 30s.
Snow Totals
PUBLIC INFORMATION STATEMENT...STORM TOTALS
NATIONAL WEATHER SERVICE DETROIT/PONTIAC MI
616 PM EST FRI MAR 10 2023


...PRELIMINARY STORM TOTAL SNOW REPORTS...

LOCATION                  SNOWFALL     DURATION
                          (INCHES)      (HOURS)        LAT       LON

...BAY COUNTY...
   3 NW BAY CITY           M   3.1            6     43.62N    83.92W

...GENESEE COUNTY...
   5 SSW FLINT             M   2.0           12     42.97N    83.74W
   LINDEN                  M   2.0            5     42.82N    83.78W
   4 N BURTON              M   3.5            6     43.05N    83.62W

...HURON COUNTY...
   BAD AXE                 M   1.2            6     43.80N    83.00W
   PORT AUSTIN             M   2.0            6     44.04N    83.00W

...LAPEER COUNTY...
   LAPEER                  M   4.0            6     43.05N    83.32W
   5 W LAPEER              M   4.5            6     43.05N    83.42W

...LENAWEE COUNTY...
   ADDISON                 M   3.0            5     41.99N    84.35W
   MORENCI                 M   3.4            7     41.72N    84.22W

...LIVINGSTON COUNTY...
   1 NE HOWELL             E   2.7           15     42.62N    83.92W

...MACOMB COUNTY...
   CHESTERFIELD TOWNSHIP   M   3.5            9     42.68N    82.82W
   EASTPOINTE              M   3.5           11     42.47N    82.96W
   ST. CLAIR SHORES        M   3.5           12     42.49N    82.89W
   SHELBY TOWNSHIP         M   4.0            9     42.67N    83.03W
   4 W NEW BALTIMORE       M   4.5           12     42.69N    82.82W

...OAKLAND COUNTY...
   FARMINGTON              M   1.6            6     42.46N    83.38W
   4 E WHITE LAKE          M   2.3           12     42.65N    83.43W
   2 WSW WOLVERINE LAKE    M   2.7            8     42.55N    83.51W
   TROY                    M   4.0            9     42.58N    83.14W
   MADISON HEIGHTS         M   4.5            8     42.50N    83.10W

...SAGINAW COUNTY...
   CHESANING               M   2.8            6     43.18N    84.12W
   8 NW SAGINAW            M   3.3            6     43.50N    84.06W
   1 N SAGINAW             M   3.5            5     43.43N    83.95W
   FRANKENMUTH             M   3.5           12     43.33N    83.74W
   SAGINAW                 M   3.7            8     43.42N    83.95W

...SHIAWASSEE COUNTY...
   1 N OWOSSO              M   3.3            9     43.01N    84.18W

...TUSCOLA COUNTY...
   CASS CITY               M   1.4            4     43.60N    83.18W
   VASSAR                  M   1.7            6     43.37N    83.58W

...WASHTENAW COUNTY...
   4 ENE ANN ARBOR         M   5.2           15     42.30N    83.66W
   3 SE ANN ARBOR          M   5.4           15     42.24N    83.69W
   MANCHESTER              M   5.5           15     42.15N    84.04W
   SALINE                  M   5.6            7     42.18N    83.78W

...WAYNE COUNTY...
   GROSSE POINTE FARMS     M   2.0            7     42.40N    82.89W
   CANTON                  M   2.5            5     42.31N    83.48W
   GARDEN CITY             M   4.3           12     42.33N    83.33W
   1 SE ROMULUS            M   5.2           12     42.21N    83.35W
   WYANDOTTE               M   5.3           12     42.21N    83.16W


M = MEASURED
E = ESTIMATED

$$
 |
|
Storm Total Snowfall |
Radar
|
|
|
Radar: NEXRAD mosaic base reflectivity radar loop from 730 PM Mar 9, 2023 through 12 PM Mar 10, 2023.
|
Environment
Widespread accumulating snowfall was observed across the Great Lakes as an occluding surface low pressure system tracked across the Ohio Valley during the morning hours of March 10th, 2023 (Figure 1). Further north the parent upper level disturbance lagged behind, becoming negatively tilted as it rotated into southeast Michigan that morning with a nearly 100 knot jetstreak rounding the base of the 500 MB trough (Figure 2). This resulted in a broad area of synoptic-scale ascent across the Great Lakes, setting the stage for widespread accumulating snowfall. Smaller-scale, mesoscale processes were also at play in this event, albeit more prominent over western lower Michigan than locally. As the precipitation shield crossed southern Lake Michigan, an increasingly robust deformation axis developed which led to the development of a pronounced NW-SE oriented snow band near Grand Rapids. Plan view 700 MB Petterssen frontogenesis (Figure 3) depicts this process nicely at 03z, with the mosaic radar loop (see radar tab) featuring some 30+ dBZ radar echoes between about 9 PM - 1 AM local time (02z-06z). Hence the localized accumulations of nearly a foot in the Grand Rapids CWA.
By the time precipitation overspread most of the DTX CWA (09z or so), this FGEN had substantially weakened along with its banded response (Figure 4) though the larger scale forcing was still firmly in place keeping broad precipitation coverage over the area. Accumulating snow was initially slow to get going with quite a bit of dry air in place between the 850-700 MB layer, per the 00z DTX sounding (Figure 5). By 12z, however, the sounding depicted a deeply saturated column up to 500 MB with nearly moist adiabatic lapse rates (3-6 km lapse rates of 6.6 C/km, see Figure 6). This corresponded to the peak snowfall period for most of southeast Michigan. Snow character was normal to powdery in character, owing to the cooler thermal profiles and saturation throughout an approximately 3 kft dendritic growth zone. The weakly stable environment was certainly helpful as well. All of these characteristics are depicted in Figure 6.
This system was quite progressive, with the main snowfall event occurring between a roughly six to nine hour period and peaking around the time of the morning commute. Overall snow totals ranged from 2 to 5 inches with locally higher amounts both south of I-94 and along the Lake Huron shoreline. For areas south of I-94, this just corresponded to better moisture quality (quantitatively seen per precipitable water) further south and closer proximity to the surface low (Figure 7). Lakeshore communities experienced a much longer residence time of this system, with the post-frontal northerly flow contributing to lakeshore convergence and lingering lake effect snow showers through the evening of March 10th. Many areas saw significant melting throughout the daylight hours as snow depth succumbed to the March sun angle and mid-30s temperatures. For reference, snow depth at Detroit Metro Airport dropped from 5 inches at 18z to 3 inches by 00z.
 |
 |
 |
|
Figure 1: WPC Surface Analysis Valid Mar 10 2023 06 UTC |
Figure 2: SPC Mesoanalysis 500 MB Upper Air Chart Valid Mar 10 2023 12 UTC |
Figure 3: SPC Mesoanalysis 700 MB Pettersson Frontogenesis Valid Mar 10 2023 03 UTC |
 |
 |
 |
|
Figure 4: SPC Mesoanalysis 700 MB Pettersson Frontogenesis Valid Mar 10 2023 09 UTC |
Figure 5: DTX Upper Air Sounding Valid Mar 10 2023 00 UTC |
Figure 6: DTX Upper Air Sounding Valid Mar 10 2023 12 UTC |
 |
||
|
|
Figure 7: SPC Mesoanalysis Precipitable Water Valid Mar 10 2023 06 UTC |
|
 |
Media use of NWS Web News Stories is encouraged! Please acknowledge the NWS as the source of any news information accessed from this site. |
|