National Weather Service United States Department of Commerce

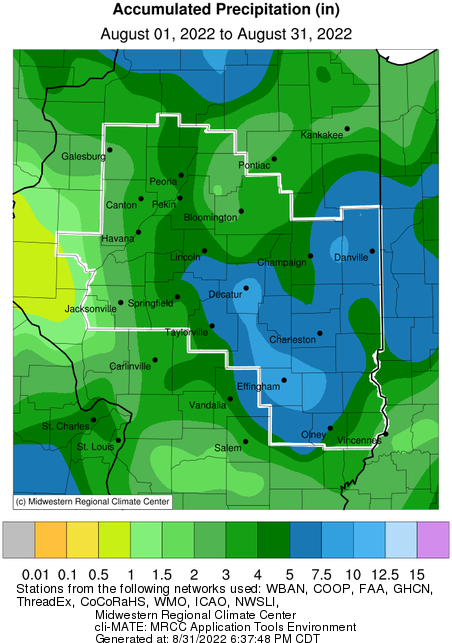
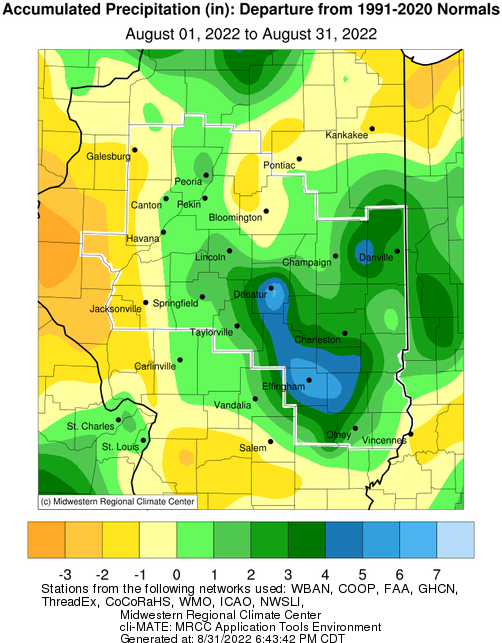
August Precipitation Highlights:

  • August got off to a wet start. Multiple rounds of rainfall brought 2-5" to central and southeast Illinois between August 1st and 3rd, with localized amounts over 10" estimated across Richland and Jasper counties.
  • Several strong storms produced hail and locally heavy rain, including a supercell that produced 3" diameter hail in Washington, on August 20.
  • Additional heavy rainfall occurred in east central Illinois between August 28th and 29th when over 5" fell across Champaign and Vermillion counties.
  • Not all portions of central Illinois received abundant rainfall in August, though, with a 1-3" deficit noted across far west central Illinois.  

August 2022 Precipitation Records:

  • Lincoln set a daily rainfall record on 8/2 with 2.10".  This broke the old daily record of 1.78" set back on 8/2/1921.
Aug 2021 Precipitation Central IL Aug 2021 Precipitation Departure from Normal Central IL


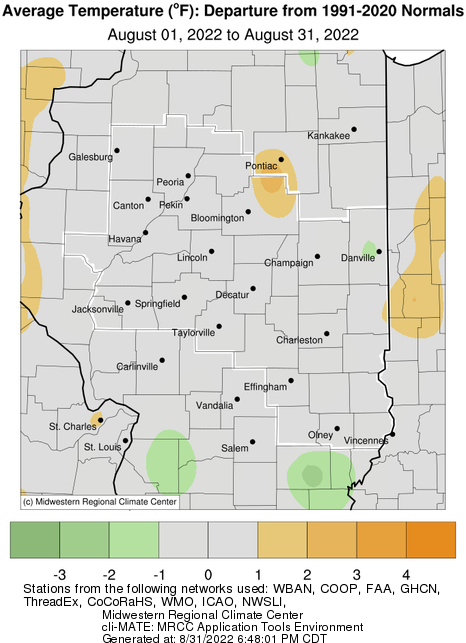
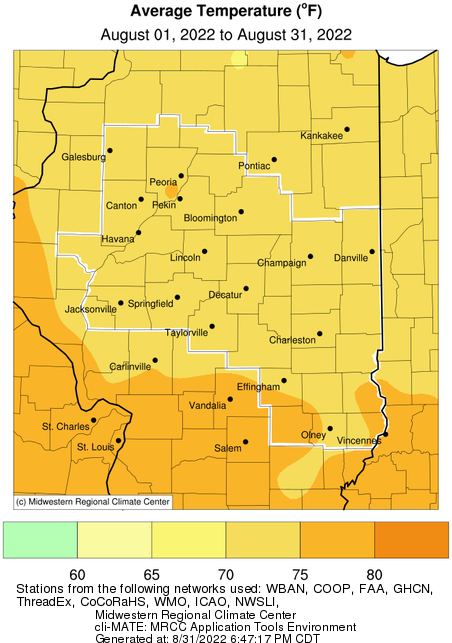
August Temperature Highlights:

  • The first week of August was the hottest part of the month when afternoon temperatures reached into the 90s and heat index values reached triple digits. 
  • The average temperature was on target for August with most of central Illinois coming in between 72-75 °F.  If anything, August highs were a little cooler than normal while evening lows were a little warmer than normal.

August 2022 Temperature Records:

  • No daily or monthly temperature records occurred during August 2022.
Aug 2021 Average Temperature Central IL

Aug 2021 Average Temperature Departure from Normal Central IL

Aug 2021 Average High Temperature Central ILAug 2021 Average High Temperature Departure from Normal Central IL

Aug 2021 Average Low Temperature Central ILAug 2021 Average Low Temperature Departure from Normal Central IL


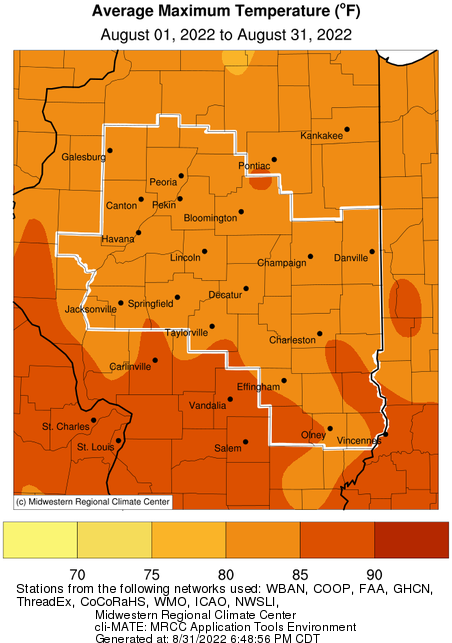
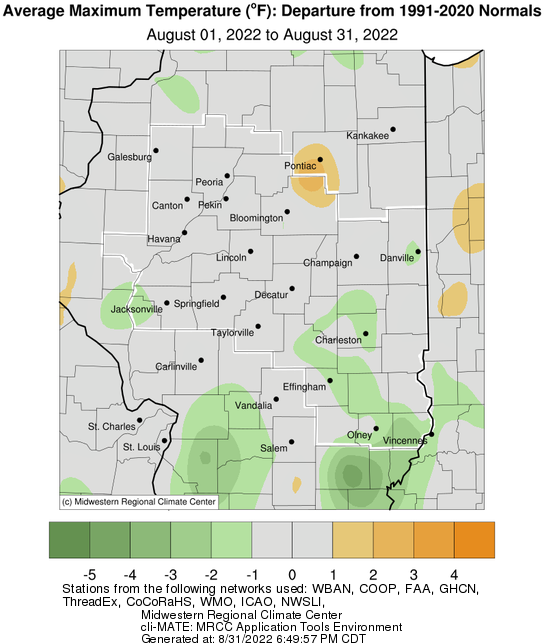
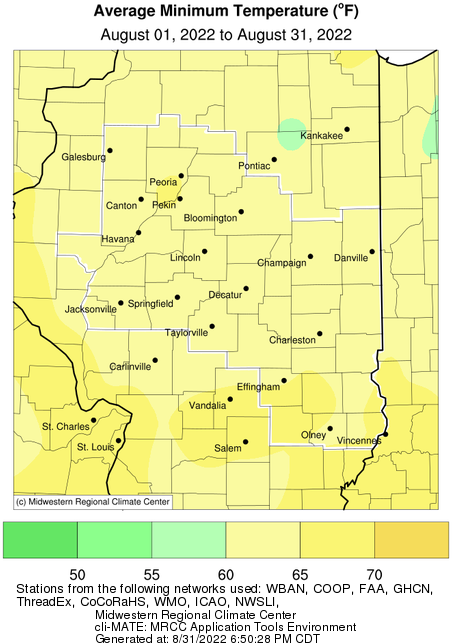
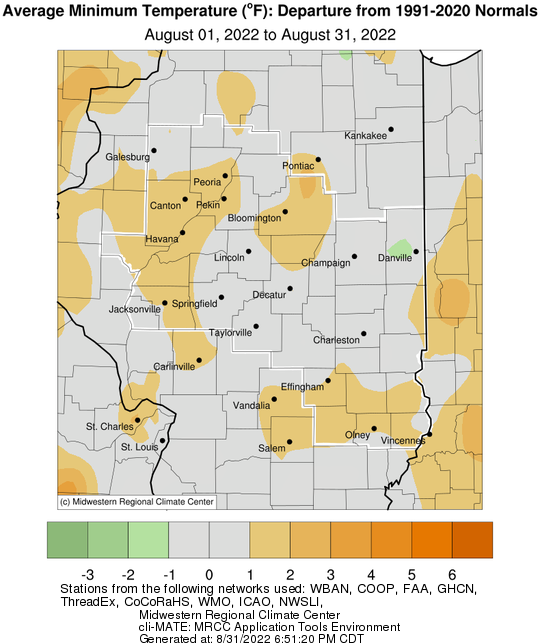
Aug 2022 Climate Statistics:

Site Precipitation (inches) Departure from Normal Temperature (F) Departure from Normal
Charleston 2.86 -0.08 74.3 -1.2
Danville 5.29 1.98 71.3 -2.2
Decatur 8.63 5.13 74.3 0.1
Effingham 9.86 6.67 N/A N/A
Galesburg 2.76 -1.13 72.9 0.1
Jacksonville 2.52 -0.87 74.2 0.8
Lincoln 4.90 1.43 72.5 -0.1
Normal 3.49 -0.34 72.6 0.0
Olney 4.68 1.49 75.0 0.2
Paris 3.71 0.14 73.2 0.9
Peoria 3.45 0.14 75.4 0.9
Springfield 5.39 2.02 74.6 -0.3
Taylorville 3.66 -0.26 N/A N/A
Urbana 4.94 1.40 73.9 0.1


The following links are the monthly climate summaries for area cities. Only the summaries for Peoria, Springfield, and Lincoln are considered "official", meaning they are the station of record for their respective locations. The other summaries are "supplemental", meaning another location in the area is the official climate station for the city.

  • Peoria -- Peoria International Airport
  • Springfield -- Abraham Lincoln Capital Airport
  • Lincoln -- National Weather Service Office
  • Champaign -- University of Illinois-Willard Airport
  • Decatur -- Decatur Airport
  • Lawrenceville -- Lawrenceville-Vincennes International Airport
  • Mattoon -- Coles County Memorial Airport

Climate data for other cities is available at http://w2.weather.gov/climate/xmacis.php?wfo=ilx
 

September Look Ahead:

  • The Climate Prediction Center suggests that temperatures for the month of September will lean above normal for central Illinois, while their precipitation forecast exhibits equal chances of being above or below normal.
US Temperature Outlook Sep 2021 US Precipitation Outlook Sep 2021


---------------------------------------------------------------------------------------------------------------------------------------------------------

Summer Season Overview

  • The I-74 corridor across central Illinois, particularly from Bloomington to Champaign, was notably dry this summer. There, the precipitation deficit was between 3-5" below climatological normal which proved detrimental to agriculture.  Elsewhere, precipitation values were near or above normal.  Locations in between Springfield and Lawrenceville picked up the most rainfall this summer, with the Effingham area receiving over 25".

Summer Season: Precipitation, Temperature and Departure from Normal Maps

Summer 2021 Precipitation in Central IL Summer 2021 Precipitation Departure from Normal


Summer 2021 Average Temperature Central IL Summer 2021 Average Temperature Departure from Normal Central IL


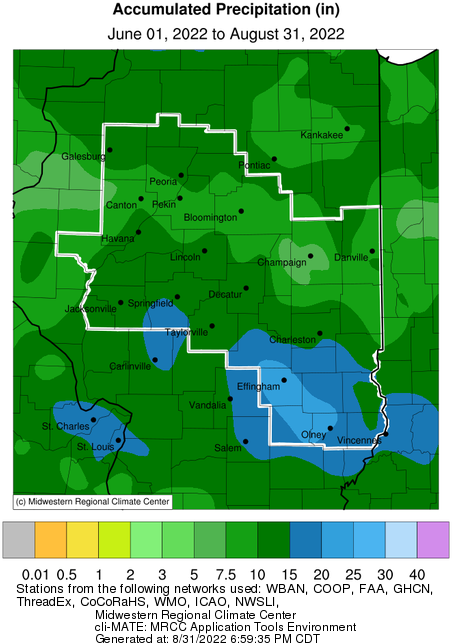
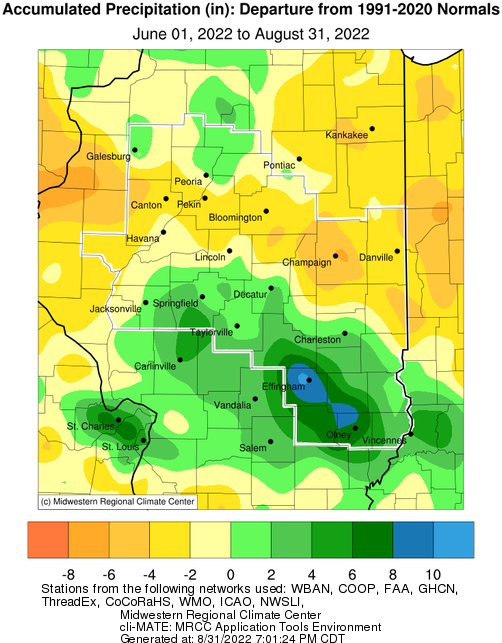
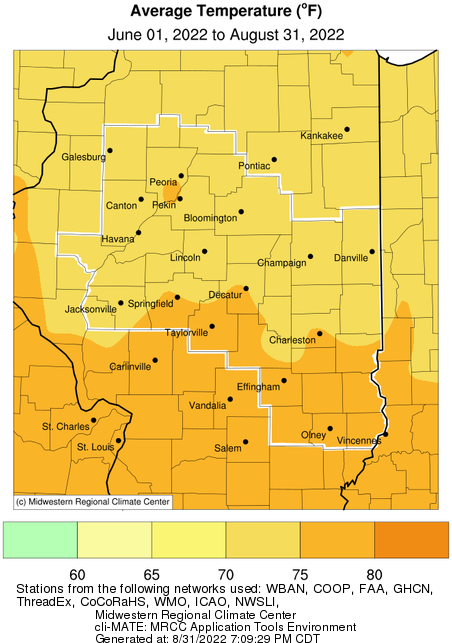
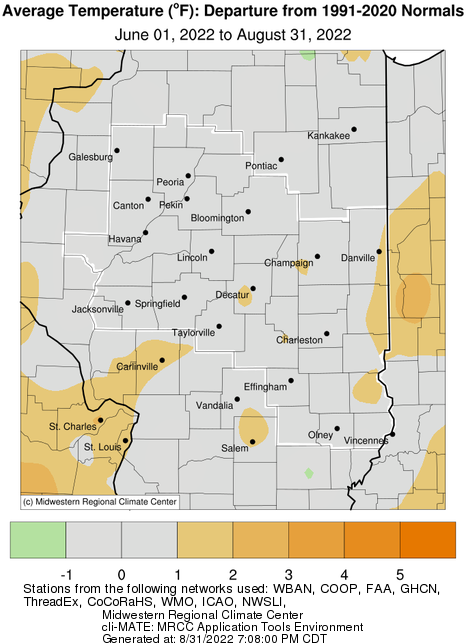
Summer (Jun-Aug) 2022 Climate Statistics:

Site Precipitation (inches) Departure from Normal Temperature (F) Departure from Normal
Charleston 15.34 3.16 75.3 -0.3
Danville 10.29 -2.54 72.7 -0.9
Decatur 13.14 0.91 75.4 1.3
Effingham 25.63 13.28 N/A N/A
Galesburg 13.85 1.34 73.2 0.2
Jacksonville 14.18 1.94 74.5 0.9
Lincoln 10.93 -1.61 73.0 -0.2
Normal 8.44 -3.59 73.2 0.3
Olney 19.76 6.82 75.6 0.8
Paris 9.37 -3.05 73.7 1.2
Peoria 7.74 -2.83 75.4 0.9
Springfield 15.11 3.28 75.0 0.0
Taylorville 13.65 1.74 N/A N/A
Urbana 8.17 -4.44 74.8 1.0


Links below are the seasonal climate summaries for area cities. Only the summaries for Peoria, Springfield and Lincoln are considered "official", meaning they are the station of record for their respective locations. The other summaries are "supplemental", meaning another location in the area is the official climate station for that city.

  • Peoria -- Peoria International Airport
  • Springfield -- Abraham Lincoln Capital Airport
  • Lincoln -- Lincoln NWS office
  • Champaign -- University of Illinois - Willard Airport
  • Decatur -- Decatur Airport
  • Lawrenceville -- Lawrenceville-Vincennes International Airport
  • Mattoon -- Coles County Airport

Climate data for other area cities is available at http://w2.weather.gov/climate/xmacis.php?wfo=ilx