Overview
February was a relatively mild weather month across central and southeast Illinois with temperatures averaging 2-4 degrees above normal. Snowfall amounts varied from 3 to 7 inches, though as little as 2 inches in Olney to as much as 10 inches in Paris. Liquid equivalent precipitation was below normal again in February across central IL (half to 1 inch below normal for most areas), while far southeast IL south of I-70 had near or even above normal precipitation. Peoria and Jacksonville had around 0.60 inches of precipitation while Flora had 3.35 inches. Arctic airmasses did produce a week stretch of temperatures below freezing from Feb 8-15th. Wind chills were down to 10-20 below zero at times over central and northern IL Feb 9-10th and Feb 12-14th. Record warmth occurred on Feb 20th and 28th with highs in the upper 60s to mid 70s. Springfield reached 74 degrees on Feb 20th and 71 degrees on Feb 28th, and the last time it reached the 70s in February was on Feb 25th, 2000 when it was 72 degrees. Only 8 years since 1879 has Springfield had at least two days in the 70s during February. Very windy conditions prevailed on Feb 19th, 24th and 28th with wind advisories posted across the area.
Significant Events
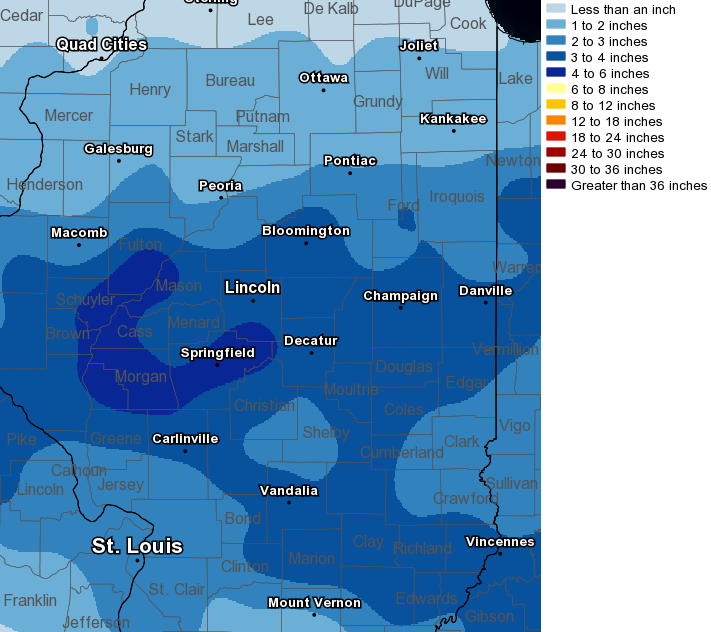 |
| February 14 Snowfall |
Precipitation


Snowfall


Temperatures


Climate Data
The table below summarizes January liquid equivalent precipitation, snowfall, and temperature, and departure from normal for selected cities across central and southeast Illinois. Data from Peoria and Springfield are from ASOS sites, while others are from NWS Cooperative Observers.
| Site |
Precipitation |
Departure from Normal | Snowfall | Departure from Normal | Average Temperature |
Departure from Normal |
|
Charleston |
1.50" | -1.01" | 6.3" | +1.9 | 35.4 | +2.3 |
| Danville |
0.82" |
-1.23" | 5.4" | -0.5" | 34.1 | +2.7 |
| Decatur |
0.98" |
-1.02" | 8.5" | +4.3" | 33.4 | +1.2 |
| Effingham |
1.71" |
-0.63" | 5.1" | +0.3 | 36.1 | +3.1 |
|
Flora |
3.35" | +0.71" | 4.0" | +2.4 | 36.7 | +2.9 |
| Galesburg |
0.70" |
-0.93" | 4.2" | -1.7" | 28.8 | +2.7 |
|
Havana |
0.54" | -1.56" | 4.0" | -3.1" | N/A | N/A |
|
Jacksonville |
0.61" | -1.08" | 3.4" | -1.2" | 35.5 | +5.0 |
| Lincoln |
1.25" |
-0.57" | 5.7" | -0.1" | 33.4 | +3.0 |
|
Mattoon |
1.96" | -0.18" | 8.5" | -5.5" | N/A | N/A |
|
Normal |
1.54" |
-0.39" | 6.5" | +0.4" | 31.5 | +3.6 |
|
Olney |
2.61" | -0.12" | 1.9" | -1.4" | 35.7 | +2.5 |
|
Paris |
2.15" | -0.19" | 10.2" | +4.3 | 33.1 | +2.8 |
| Peoria |
0.62" |
-1.17" | 2.8" | -3.4" | 33.3 | +3.8 |
| Springfield |
1.24" |
-0.57" | 8.3" | +2.8" | 35.4 | +4.2 |
|
Tuscola |
0.98" | -1.22" | 7.0" | +2.6" | 33.1 | +4.0 |
| Urbana |
1.22" |
-0.91" | 6.8" | +1.0" | 33.2 | +4.3 |
Links below are the monthly climate summaries for area cities. Only the summaries for Peoria, Springfield and Lincoln are considered "official", meaning they are the station of record for their respective locations. The other summaries are "supplemental", meaning another location in the area is the official climate station for that city.
Climate data for other area cities is available at http://www.nws.noaa.gov/climate/xmacis.php?wfo=ilx

