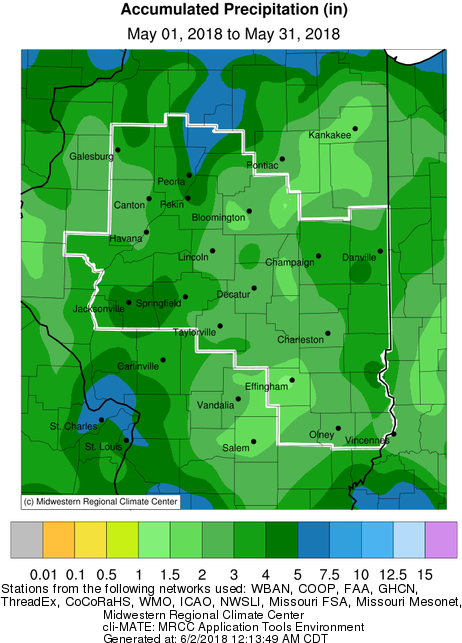
May Precipitation Highlights:
​May 30: The remnants of Tropical Storm Alberto tracked northward along the Illinois/Indiana border. Widespread moderate rain fell east of I-57 through mid-afternoon, with total rainfall amounts of 1.50 - 2.00". Further northwest, a persistent band of moderate to heavy rain developed overnight into the early morning near the Illinois River. This band dropped impressive rainfall amounts of 2 to 4 inches, with localized amounts as much as 5 inches from just northwest of Springfield northward to near Peoria and Henry. This caused flash flooding in portions of Tazewell, Woodford, and Marshall counties.
 |
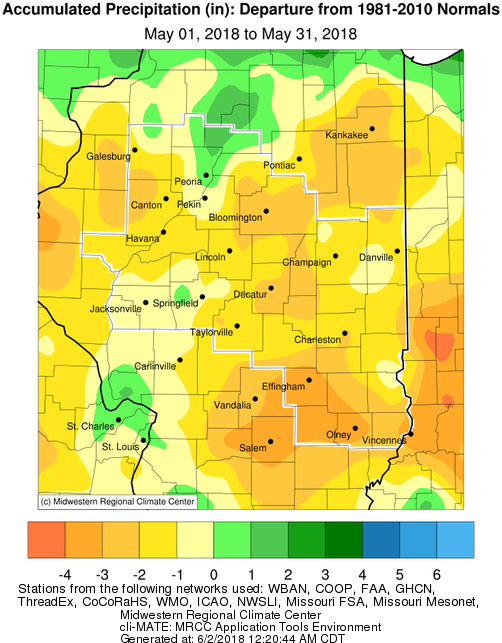 |
| May Precipitation | May Precipitation Departure from Normal |
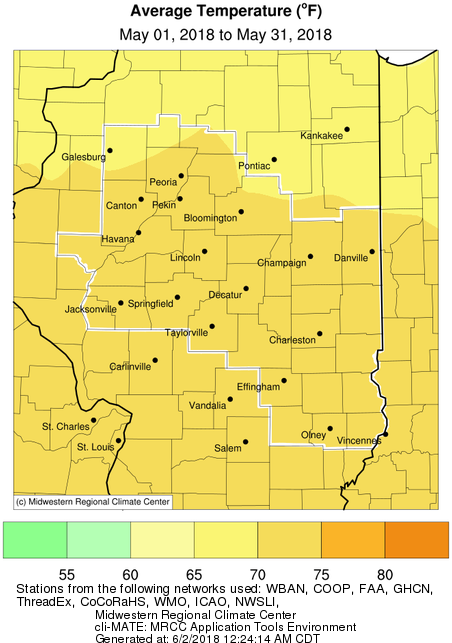
May Temperature Highlights:
 |
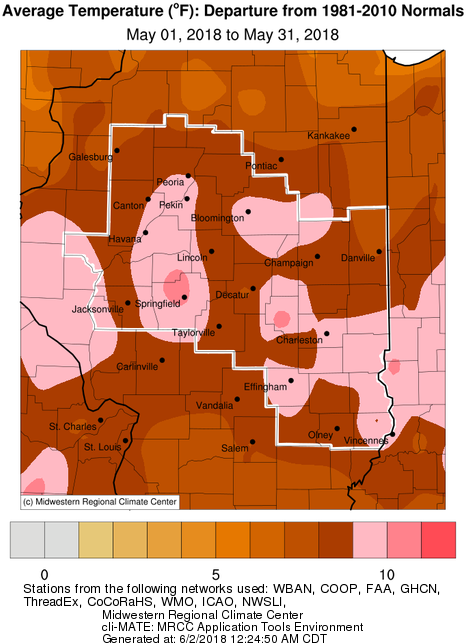 |
| May Mean Temperature | May Temperature Departure from Normal |
May Climate Data:
|
Site |
Precipitation |
Departure from Normal | Average Temperature |
Departure from Normal | Notes |
|
Charleston |
4.09" | -0.53" | 73.6 | +9.4 | Warmest May; 2 days below normal |
| Danville |
3.76" |
-0.98" | 70.9 | +7.8 | 2nd warmest May; 0 days below normal |
| Decatur |
2.21" |
-2.58" | 72.0 | +7.8 | Warmest May; 0 days below normal |
| Effingham | 1.11" | -4.16" | 73.0 | +9.6 | Warmest May; 1 day below normal |
|
Flora |
2.27" | -2.95" | 73.4 | +8.9 | Warmest May; 1 day below normal |
| Galesburg |
2.56" |
-1.89" | 69.3 | +7.9 | Warmest May; 3 days below normal |
|
Havana |
2.72" | -2.07" | NA | NA | NA |
|
Jacksonville |
4.95" | +0.44" | 72.4 | +8.5 | Warmest May; 0 days below normal |
| Lincoln | 2.99" | -1.17" | 71.3 | +8.3 | Tied warmest May; 0 days below normal |
|
Normal |
2.75" |
-1.89" | 70.0 | +8.9 | 3rd warmest May; 1 day below normal |
|
Olney |
2.18" | -3.65" | 72.2 | +8.4 | 2nd warmest May; 2 days below normal |
|
Paris |
4.89" | +0.44" | 70.1 | +7.1 | 5th warmest May; 0 days below normal |
| Peoria |
4.06" |
-0.27" | 71.7 | +9.3 | Tied warmest May; 0 days below normal |
| Springfield |
2.84" |
-1.40" | 74.5 | +10.8 | Warmest May; 0 days below normal |
|
Tuscola |
3.38" | -0.80" | 72.1 | +8.9 | 2nd warmest May; 0 days below normal |
| Urbana |
3.45" |
-1.44" | 71.1 | +8.6 | Warmest May; 0 days below normal |
The following links are the monthly and seasonal climate summaries for area cities. Only the summaries for Peoria, Springfield, and Lincoln are considered "official", meaning they are the station of record for their respective locations. The other summaries are "supplemental", meaning another location in the area is the official climate station for the city.
Climate data for other cities is available at http://w2.weather.gov/climate/xmacis.php?wfo=ilx

