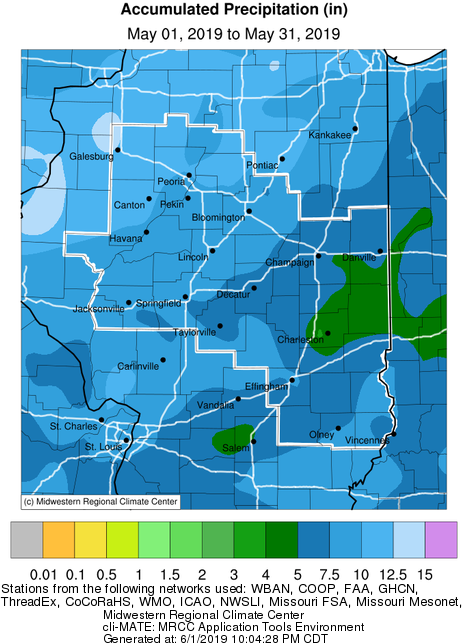
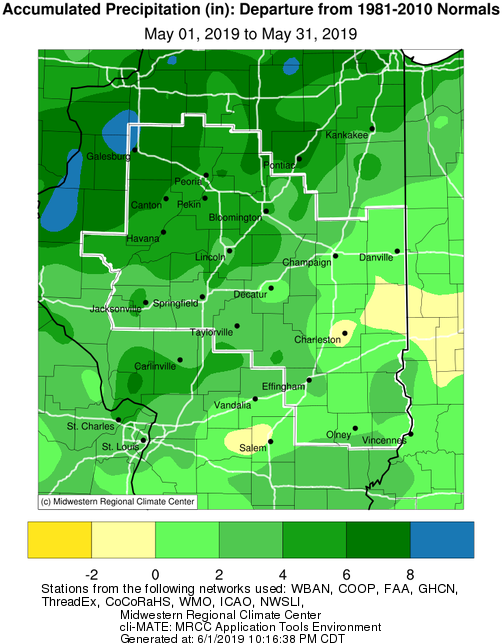
May 2019 Precipitation Highlights:
 |
 |
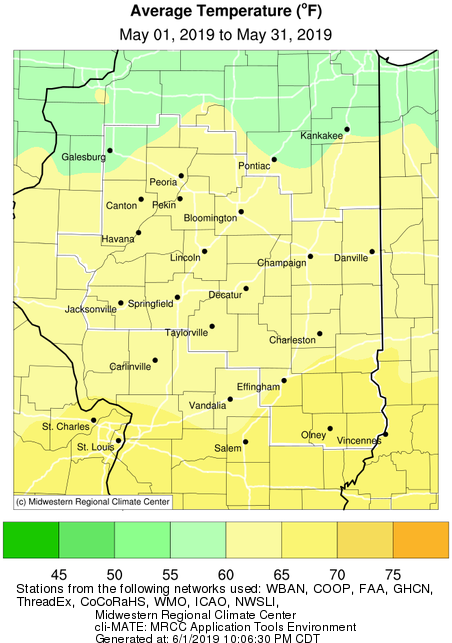
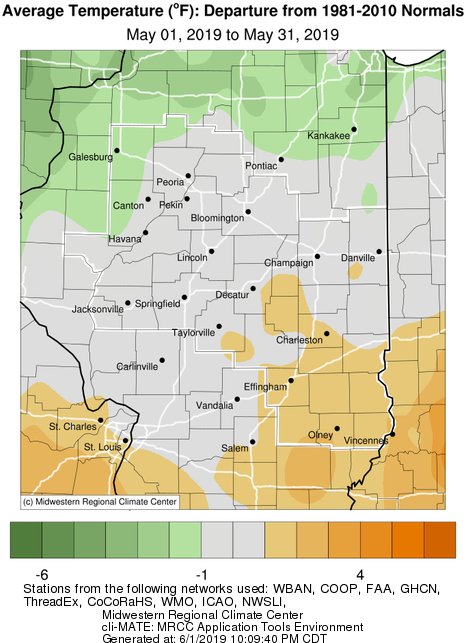
May 2019 Temperature Highlights:
 |
 |
May 2019 Climate Statistics:
|
City |
Precipitation |
Departure from Normal | Average Temperature |
Departure from Normal |
|
Charleston |
5.02" | +0.40" | 66.4 | +2.0 |
| Danville |
5.71" |
+0.97" | 64.2 | +1.1 |
|
Decatur |
5.30" | +0.51" | 63.6 | -0.6 |
| Effingham |
7.39" |
+2.12" | 64.9 | +1.5 |
|
Flora |
7.12" | +1.90" | 66.5 | +2.0 |
|
Galesburg |
13.00" | +8.55" | 59.3 | -2.1 |
|
Havana |
10.64" | +5.85" | N/A | N/A |
|
Jacksonville |
8.80" | +3.99" | 62.0 | -0.1 |
|
Lincoln |
6.84" | +2.68" | 63.4 | +0.4 |
|
Normal |
9.37" |
+4.73" | 61.9 | +0.8 |
|
Olney |
7.86" | +2.03" | 65.7 | +1.9 |
|
Paris |
3.81" | -0.74" | 62.4 | -0.6 |
|
Peoria |
8.26" | +3.93" | 62.3 | -0.1 |
| Springfield |
6.32" |
+2.08" | 64.3 | +0.6 |
|
Tuscola |
6.41" | +2.23" | 64.0 | +0.8 |
|
Urbana |
6.01" | +1.12" | 62.9 | +0.4 |
The following links are the monthly climate summaries for area cities. Only the summaries for Peoria, Springfield, and Lincoln are considered "official", meaning they are the station of record for their respective locations. The other summaries are "supplemental", meaning another location in the area is the official climate station for the city.
Climate data for other cities is available at http://w2.weather.gov/climate/xmacis.php?wfo=ilx
Spring 2019 Precipitation, Snowfall & Temperature Maps:
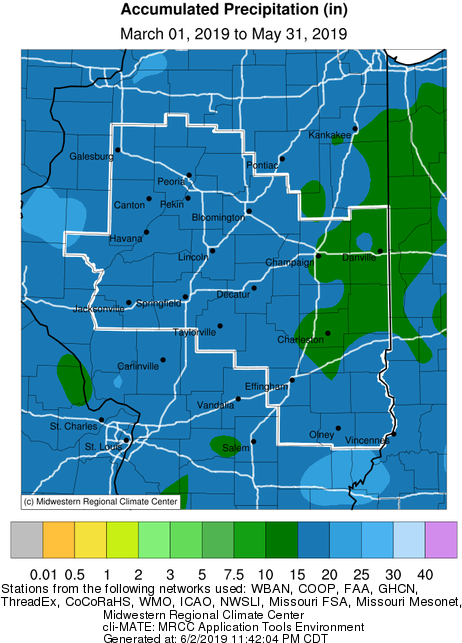
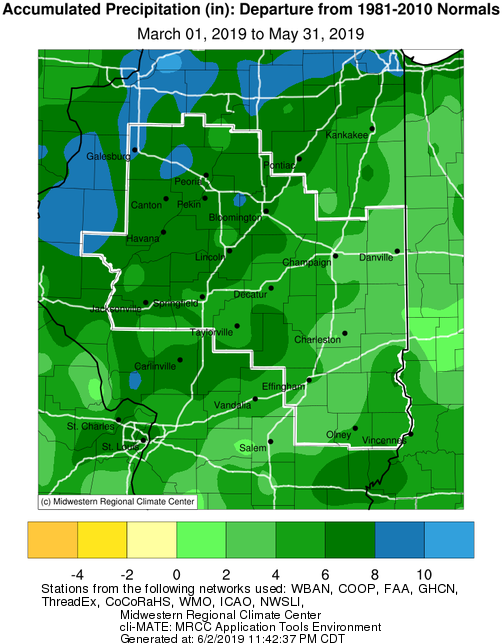
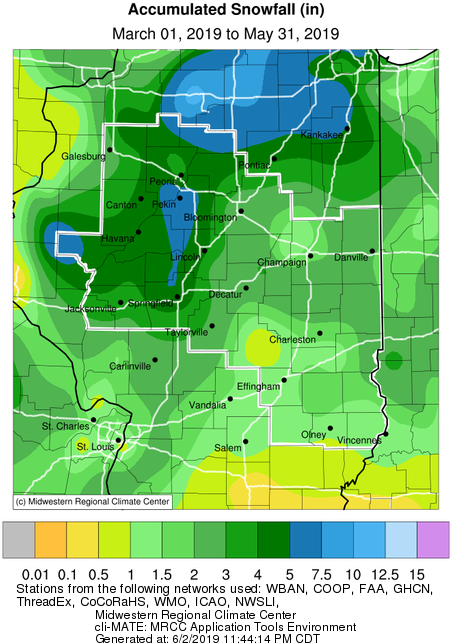
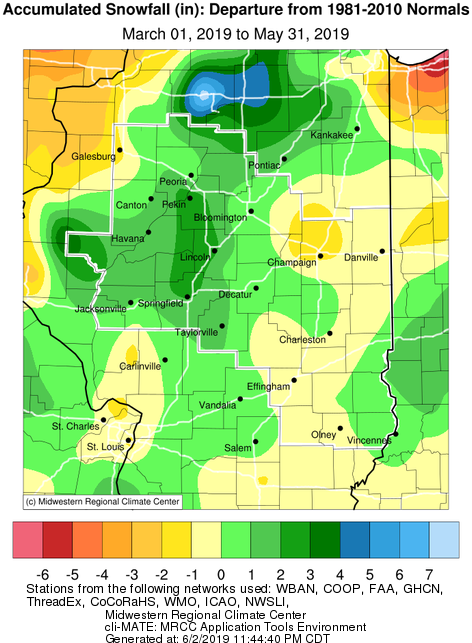
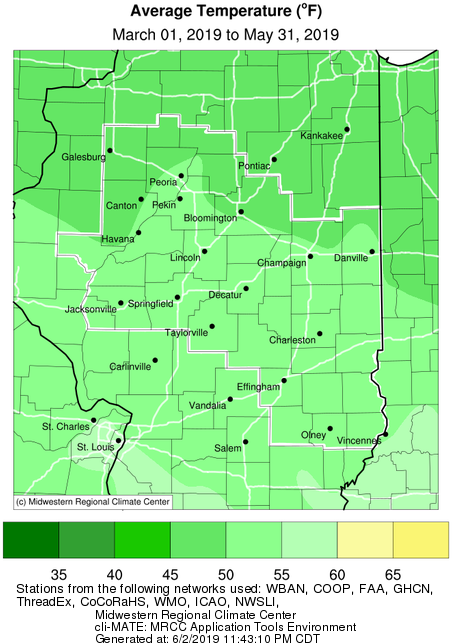
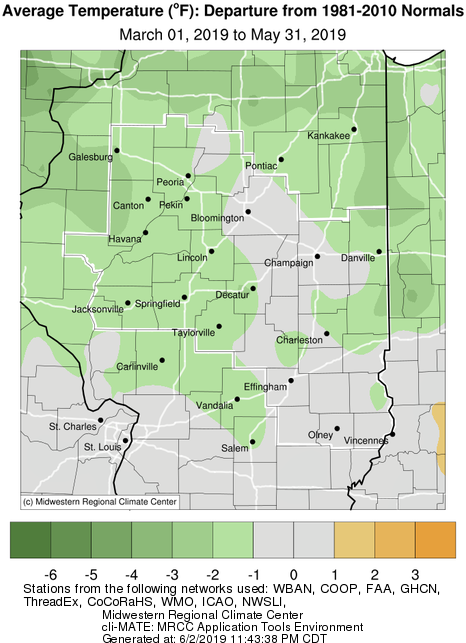
Spring 2019 (Mar-May) Climate Statistics:
|
City |
Precipitation |
Departure from Normal | Snowfall | Departure from Normal |
Average Temperature |
Departure from Normal |
|
Charleston |
16.20" | +4.4" | 6.1" | +4.2" | 54.0 | -0.1 |
| Danville |
15.42" |
+3.68" | Trace | -2.7" | 51.7 | -1.2 |
|
Decatur |
15.75" | +4.70" | 2.6" | +0.7" | 51.4 | -2.4 |
| Effingham |
16.47" |
+3.92" | 1.4" | -0.4" | 52.7 | -0.3 |
|
Flora |
16.58" | +3.19" | 1.2" | N/A | 53.9 | -0.4 |
|
Galesburg |
19.88" | +8.95" | Trace | -2.1" | 47.8 | -2.3 |
|
Havana |
18.01" | +6.76" | N/A | N/A | N/A | N/A |
|
Jacksonville |
18.27" | +6.71" | 3.3" | +0.7" | 50.2 | -1.4 |
|
Lincoln |
17.72" | +7.35" | 4.4" | +2.4" | 51.1 | -1.1 |
|
Normal |
17.91" |
+6.89" | 2.3" | +0.1" | 49.3 | -0.5 |
|
Olney |
19.21" | +4.71" | 1.0" | -0.1" | 53.2 | -0.4 |
|
Paris |
13.81" | +2.25" | 2.3" | -0.5" | 49.9 | -2.3 |
|
Peoria |
16.95" | +6.19" | 5.8" | +2.5" | 50.8 | -1.0 |
| Springfield |
17.08" |
+6.70" | 5.3" | +2.5" | 52.2 | -0.9 |
|
Tuscola |
16.54" | +5.40" | 3.0" | +1.0" | 50.8 | -1.2 |
|
Urbana |
16.06" | +4.63" | 2.1" | -0.9" | 50.8 | -0.7 |
Lincoln was tied for its 2nd wettest spring, Peoria had their 5th wettest spring & Springfield had their 9th wettest spring on record.
The following links are the spring season climate summaries for area cities. Only the summaries for Peoria, Springfield, and Lincoln are considered "official", meaning they are the station of record for their respective locations. The other summaries are "supplemental", meaning another location in the area is the official climate station for the city.

