July 11, 2020
A couple rounds of strong to severe thunderstorms impacted portions of central Illinois during the afternoon and evening of July 11th. The first round developed along an outflow boundary from previous convection that had tracked across northern Illinois around midday. These cells formed along the I-74 corridor and brought large hail and locally heavy rainfall during the late afternoon hours. The second round developed over eastern Iowa, then swept southeastward across much of the area during the evening bringing damaging wind gusts.
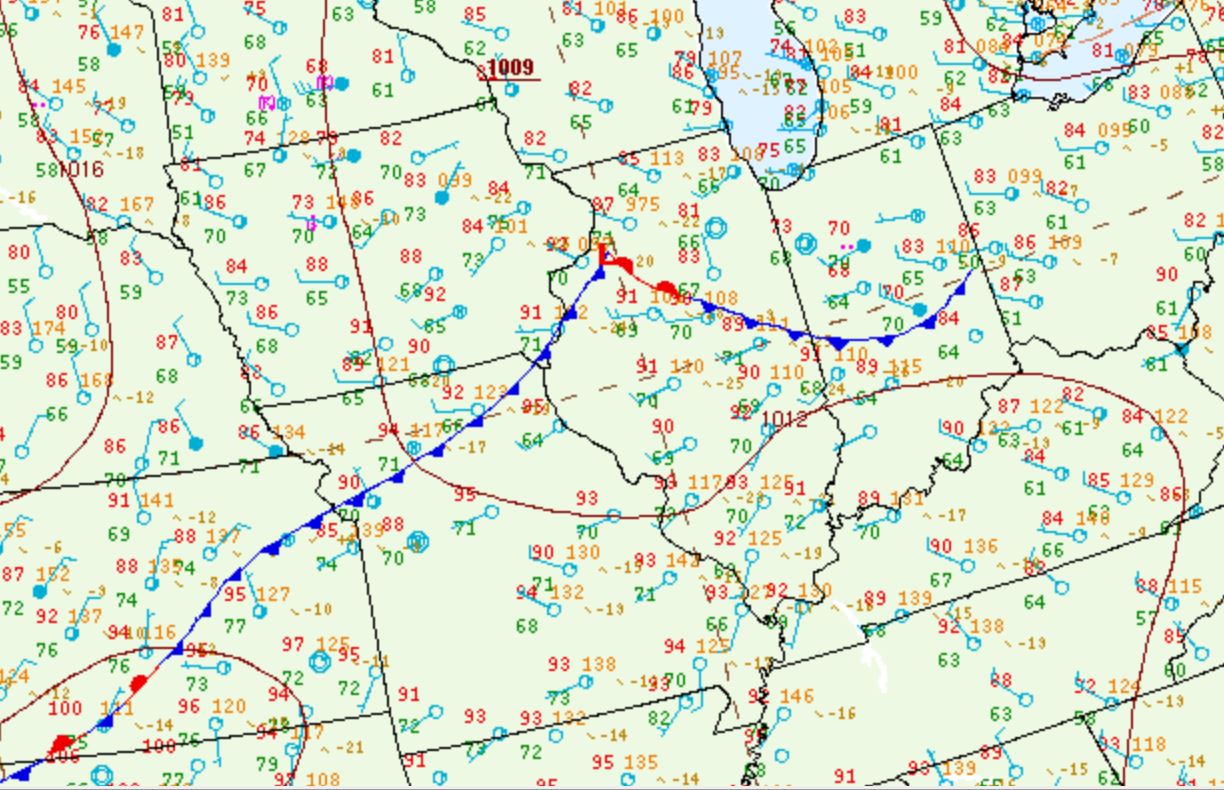
Surface analysis from the afternoon of July 11th showed a very warm and humid airmass in place across central Illinois with temperatures around 90 degrees and dewpoints in the upper 60s and lower 70s. A cold front was noted from southeast Iowa into Kansas, as a cooler and drier airmass was slowly advancing southward out of the Northern Plains where dewpoints across the Dakotas had dropped into the 50s. Meanwhile, an outflow boundary created by a cluster of thunderstorms that tracked across northern Illinois and Indiana earlier in the day had settled southward to near the I-74 corridor. Note temperatures only in the lower 80s and light northerly winds north of the boundary across much of northern Illinois on the map below.
SURFACE WEATHER MAP 4PM CDT JULY 11
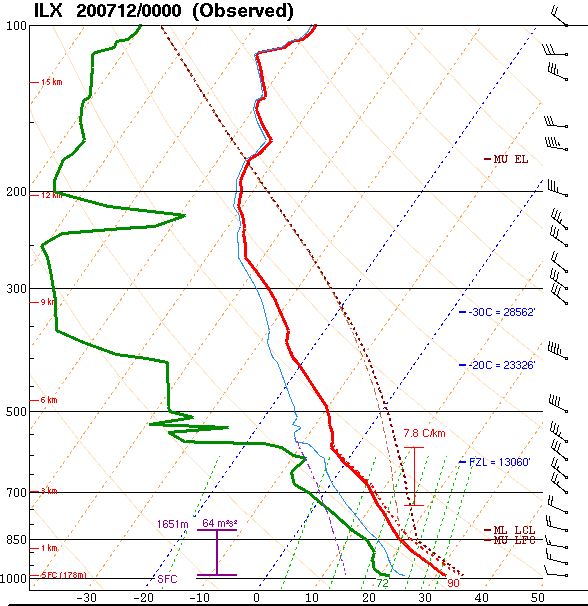
The 00z/7pm upper air balloon launch from National Weather Service Lincoln revealed a highly unstable and moderately sheared environment. Surface-based Convective Available Potential Energy (SBCAPE) values were around 4000J/kg, while 0-6km bulk shear was in the 30-35kt range.
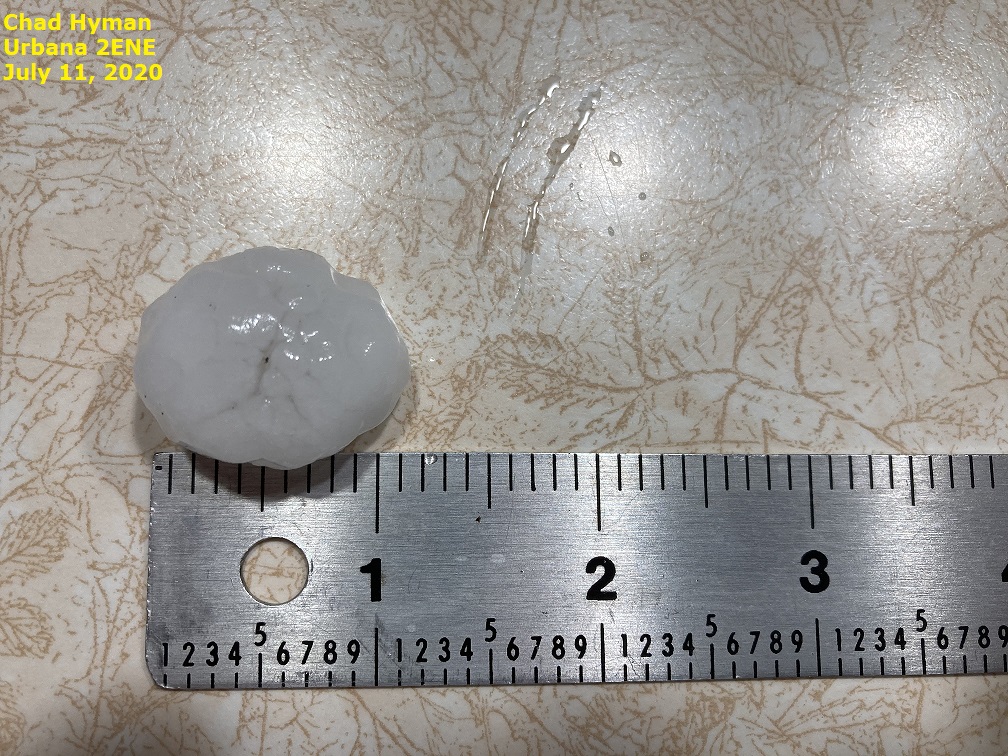
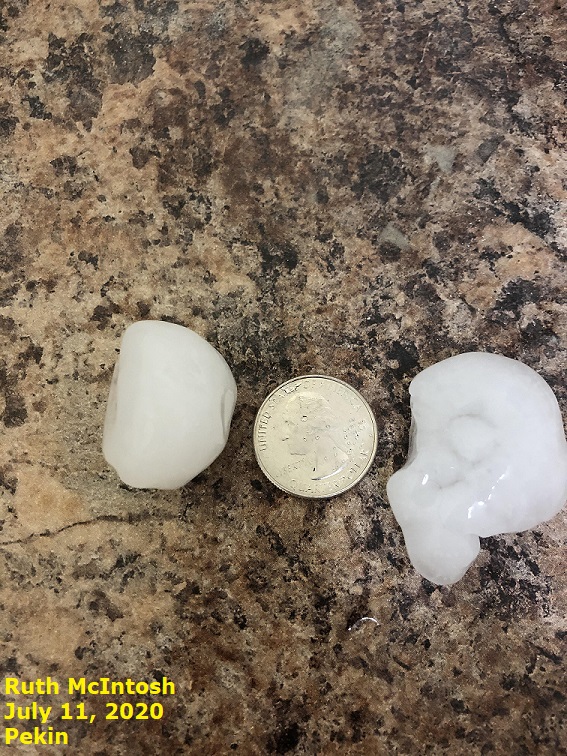
With sufficient moisture, instability, and shear in place...scattered thunderstorms blossomed along the I-74 corridor outflow boundary and were quickly able to develop vigorous updrafts and support large hail. One of the hardest-hit communities was Champaign-Urbana where numerous clusters of storms produced heavy rainfall and hailstones as large as golfballs in a few spots. Considerable property damage occurred to car dealerships in Savoy and siding and roof damage was reported on the east side of Urbana. Another thunderstorm cell that developed near the outflow boundary further northwest dropped tennis ball-sized (2.5" inch diameter) hail near Bartonville in Peoria County. Here are a couple pictures of the hailstones from the SWOP network.
 |
 |
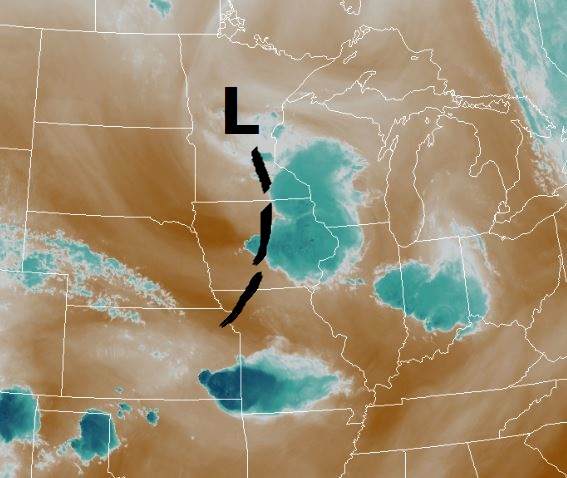
As the outflow boundary gradually dissipated, areal coverage of storms along I-74 decreased by early evening. Meanwhile further northwest, a pronounced upper-level disturbance noted on water vapor imagery over Minnesota began interacting with the cold front to produce several clusters of thunderstorms across eastern Iowa. Note the spin over Minnesota with a swath of drier air (denoted by the dark orange color) advecting around the system from the Dakotas into northwestern Iowa in the image below.
WATER VAPOR IMAGE 4PM CDT JULY 11
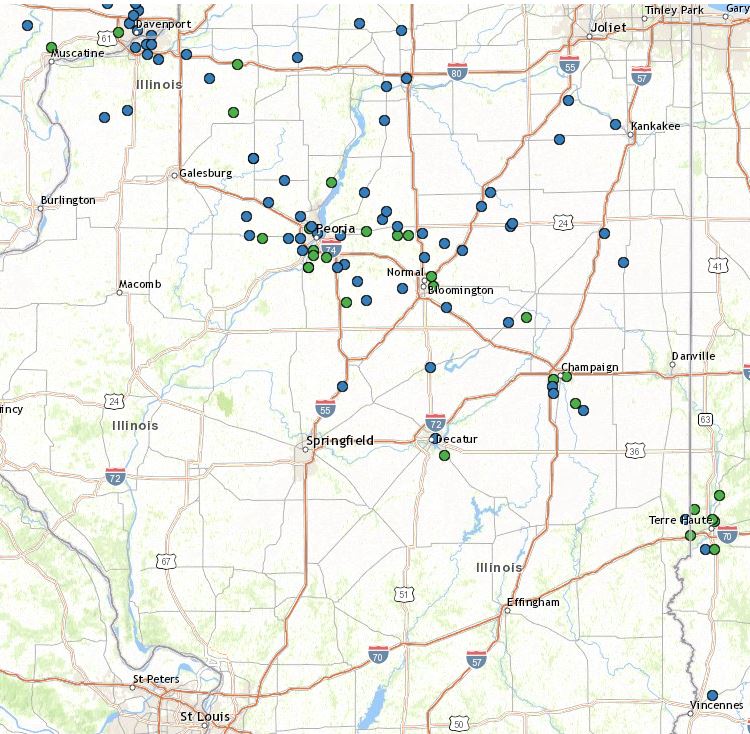
The additional lift provided by the upper wave helped spark a significant cluster of thunderstorms that surged east-southeastward along the old outflow boundary during the evening. As the storms crossed the Mississippi River, a wind gust of 80mph was measured at the Quad Cities Airport. While the main push of momentum from these storms remained mostly north of the National Weather Service Lincoln County Warning Area (CWA), additional cells forming along the new outflow boundary created 60-70mph winds across Stark, Marshall, Peoria, Tazewell, Woodford, and northern McLean counties. Numerous tree branches and power lines were blown down across this area, resulting in significant power outages. The storms congealed into a solid linear structure as they tracked southeastward later in the evening, with pockets of 60-70mph wind gusts and damage noted across Macon and DeWitt counties. With daytime instability waning and wind shear weakening further south, the storms steadily decreased in intensity as they reached the I-70 corridor by late evening. Here is a map of all damage reports received on July 11th. The green dots represent severe hail, while the blue dots denote wind damage.
STORM REPORTS FROM JULY 11