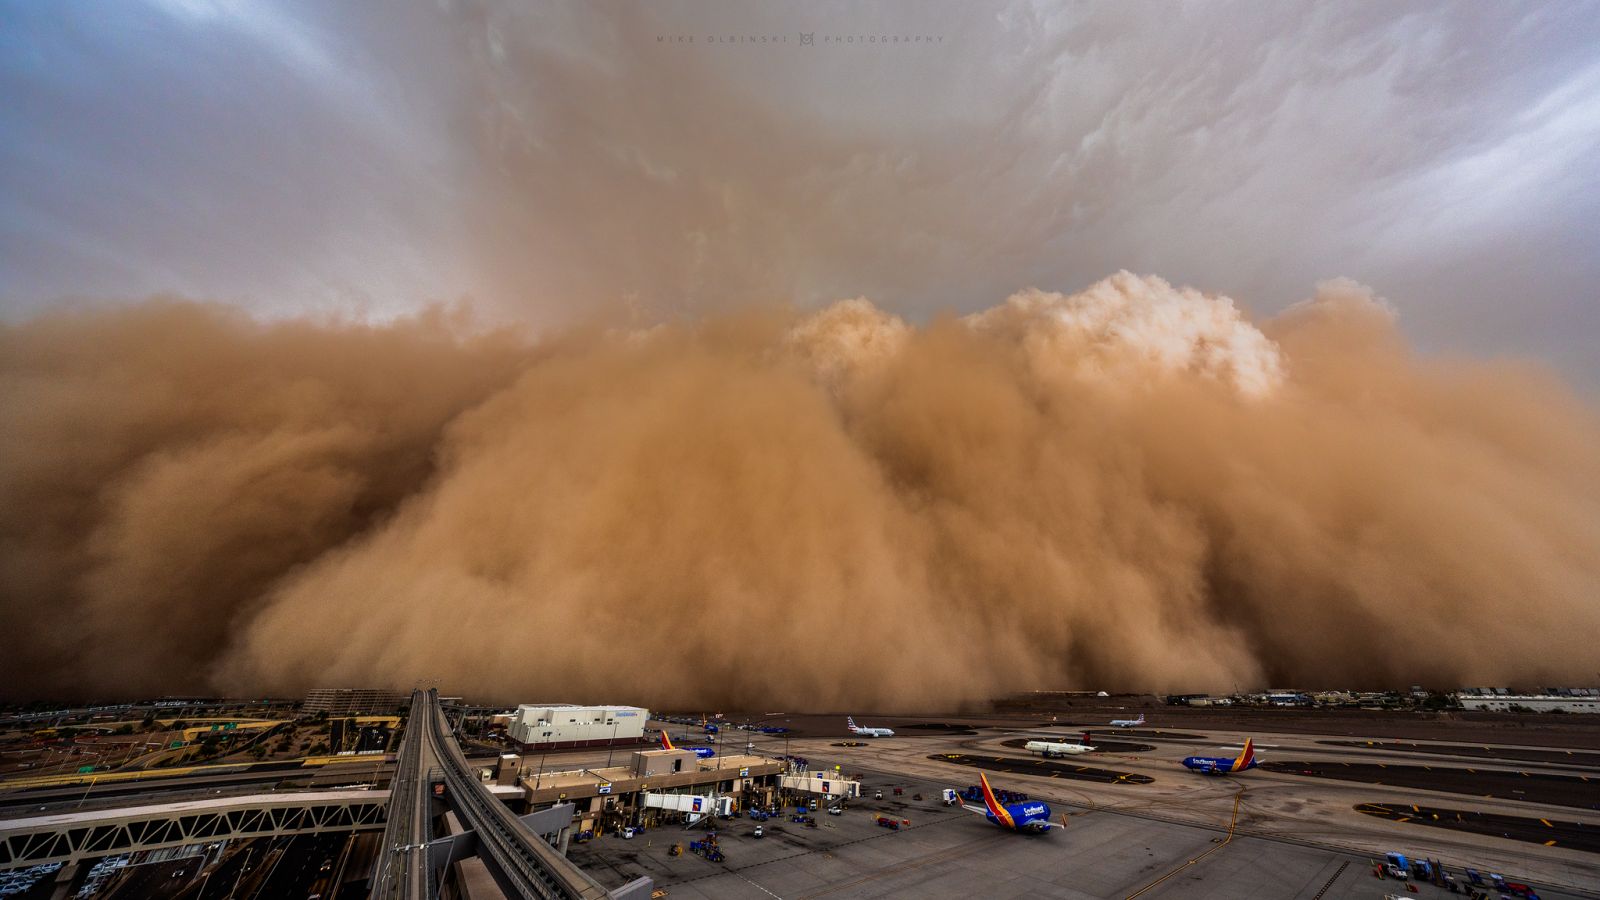

Fig. 1-2: Images of the dust storm moving through the Phoenix Metro Area. Top image: large wall of dust approaching Phoenix Sky Harbor Airport at around 5:30 PM MST (Photo credit: Mike Olbinski). Bottom Image: Dust storm completely engulfing Mountain America Stadium in Tempe, AZ (Image credit: ASU Football on X).
During the early afternoon hours of August 25th, a classic monsoon setup was in place with showers and thunderstorms initiating over southeastern Arizona (Fig. 3). As those initial storms began to merge and advance northwest through the I-10 corridor, images began to appear online of a massive wall of dust associated with an outflow boundary approaching areas in central Pinal County. As this outflow continued its northward push, locations such as Arizona City, Casa Grande, and Florence experienced visibilities rapidly deteriorating to near zero. Soon after, the Phoenix metro began to feel the effects of this dust storm with numerous reports and images of visibilities less than a ¼ of a mile and wind reports near 50-65 mph (Fig. 4-5). Heavy concentrations of dust on the leading edge of the dust storm was even enough to block out nearly all sunlight and made it eerily seem like nighttime (Fig. 2). The strong low-level forcing of this boundary continued to generate additional thunderstorms through the Phoenix metro with some instances of severe level gusts (> 58 mph) being observed. The outflow boundary, which originated in Pima County, persisted for an extended period. This resulted in a high concentration of dust being stirred up and transported as far north as southern Yavapai County, along I-17.
Fig. 3: Reflectivity loop from 1:12 PM to 9:20 PM MST on August 25th, 2025 from the KIWA (Phoenix, AZ) radar showing the complex of storms and the main outflow boundary traversing southeast and south-central AZ.
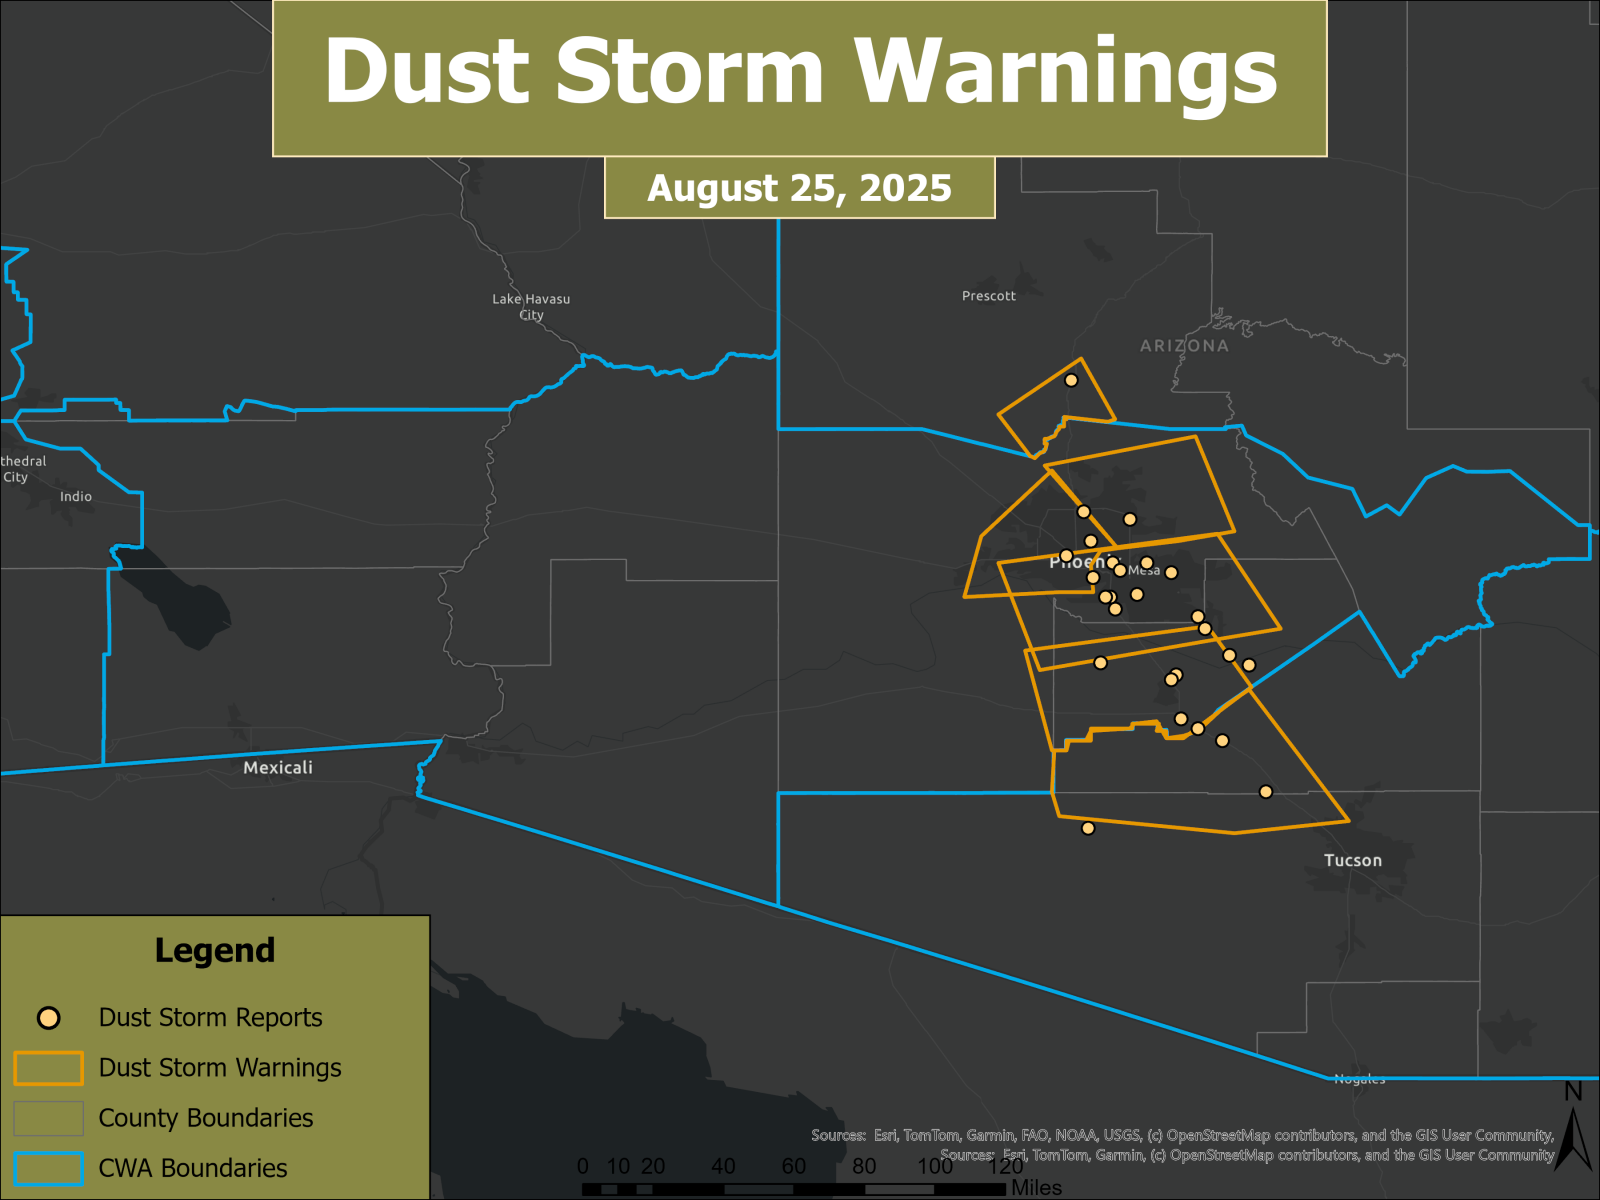
Fig. 4: Spatial extent of the Dust Storm Warnings issued by the NWS Offices in Phoenix, Tucson and Flagstaff. Locations of dust storm reports (visibilities ≤ 0.25 mile) are noted with the tan dots.
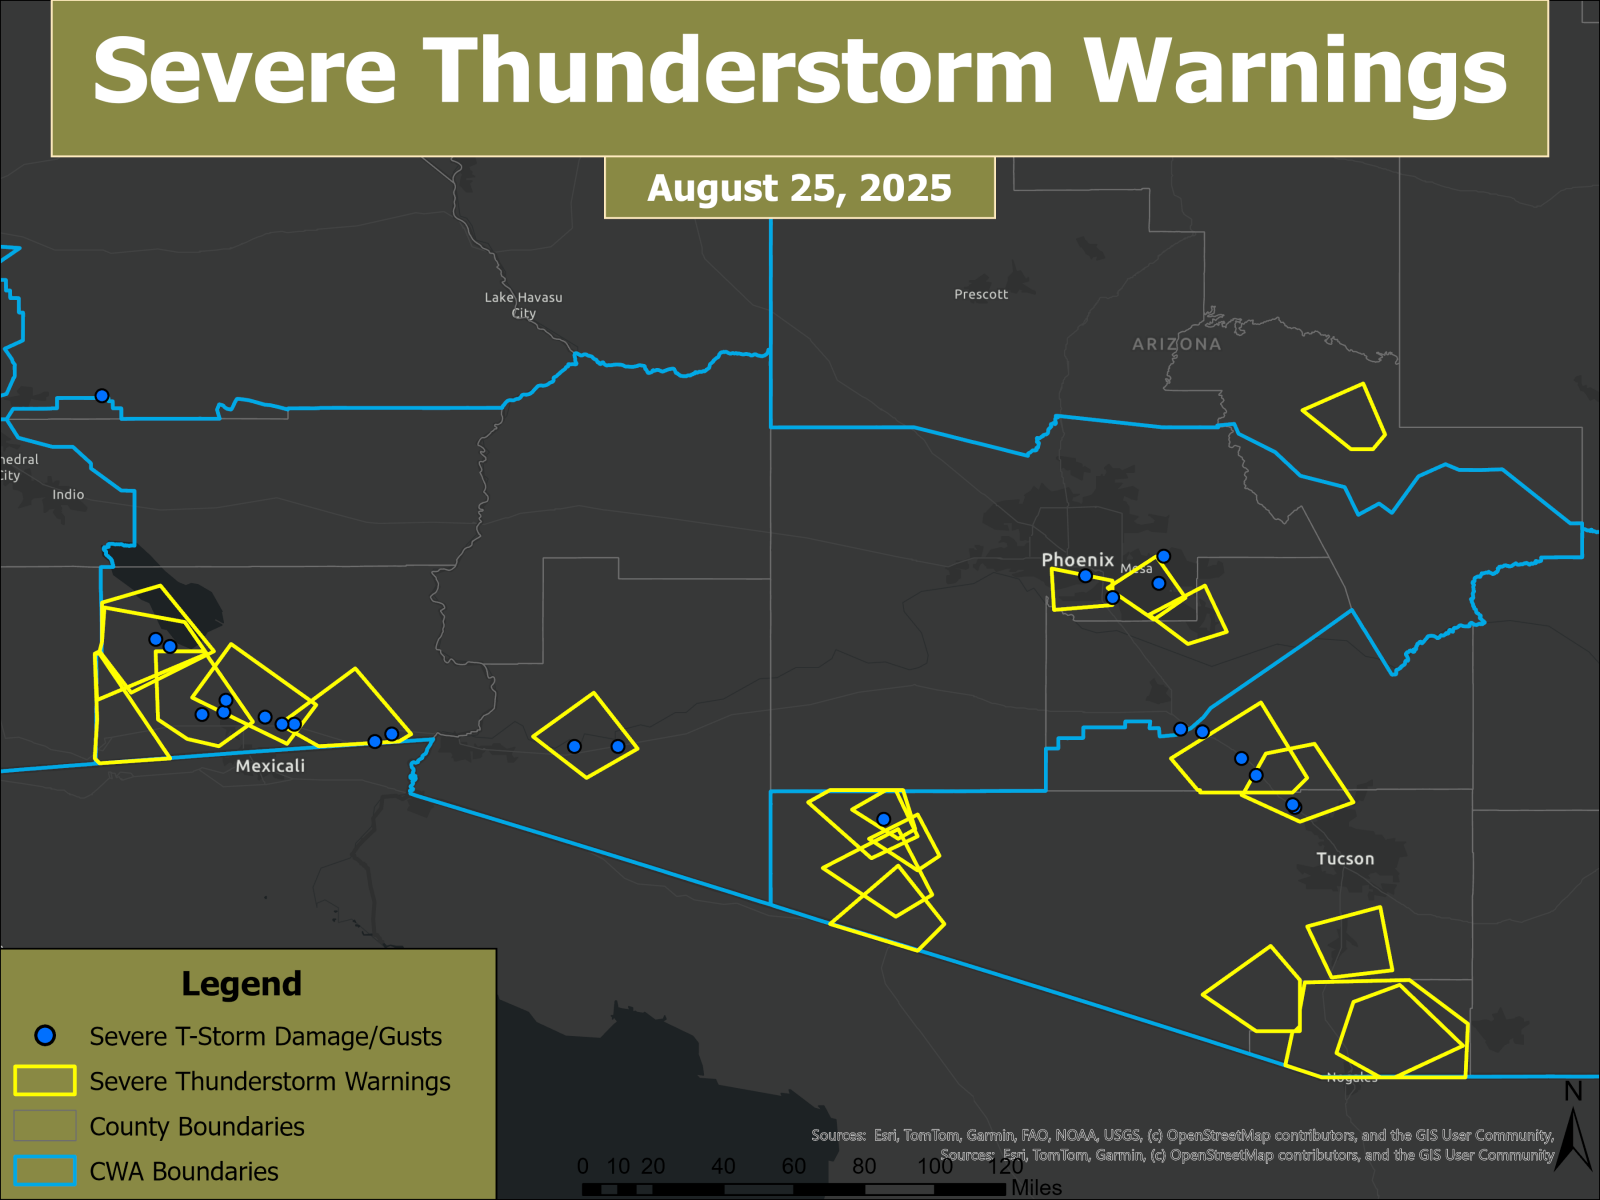
Fig. 5: Spatial extent of the Severe Thunderstorm Warnings issued by the NWS Offices in Phoenix, Flagstaff, and Tucson. Locations of thunderstorm wind damage/severe gusts (wind gusts ≥ 58 mph) reports are noted with the blue dots.
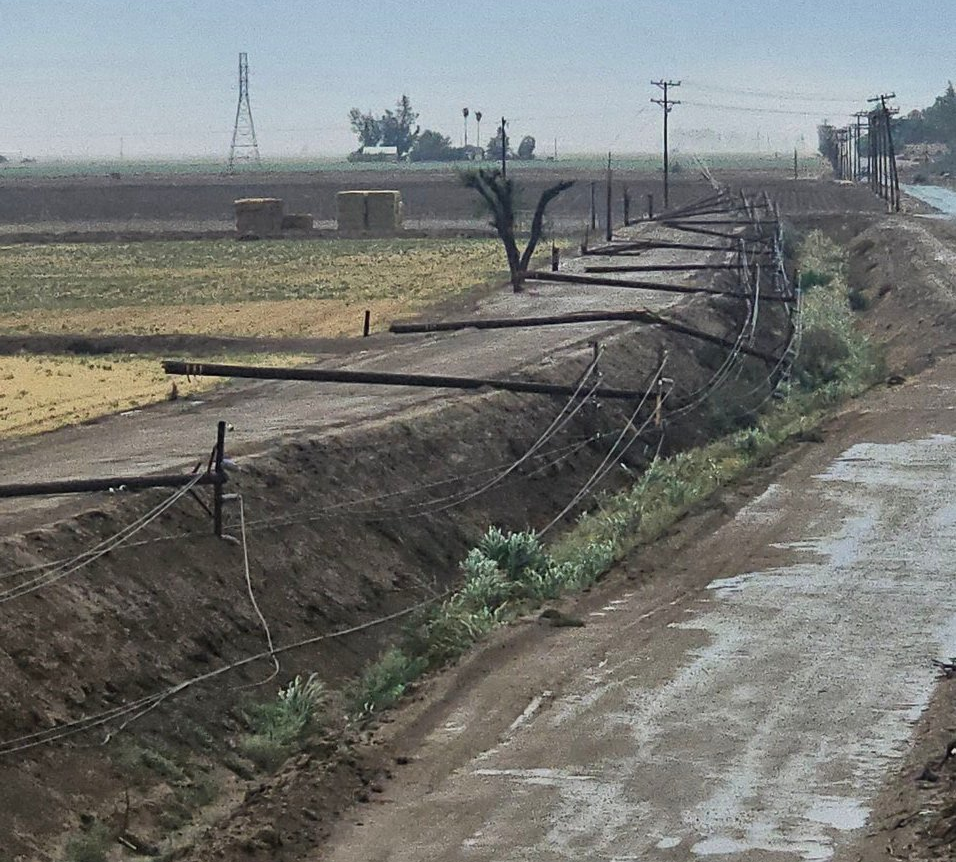
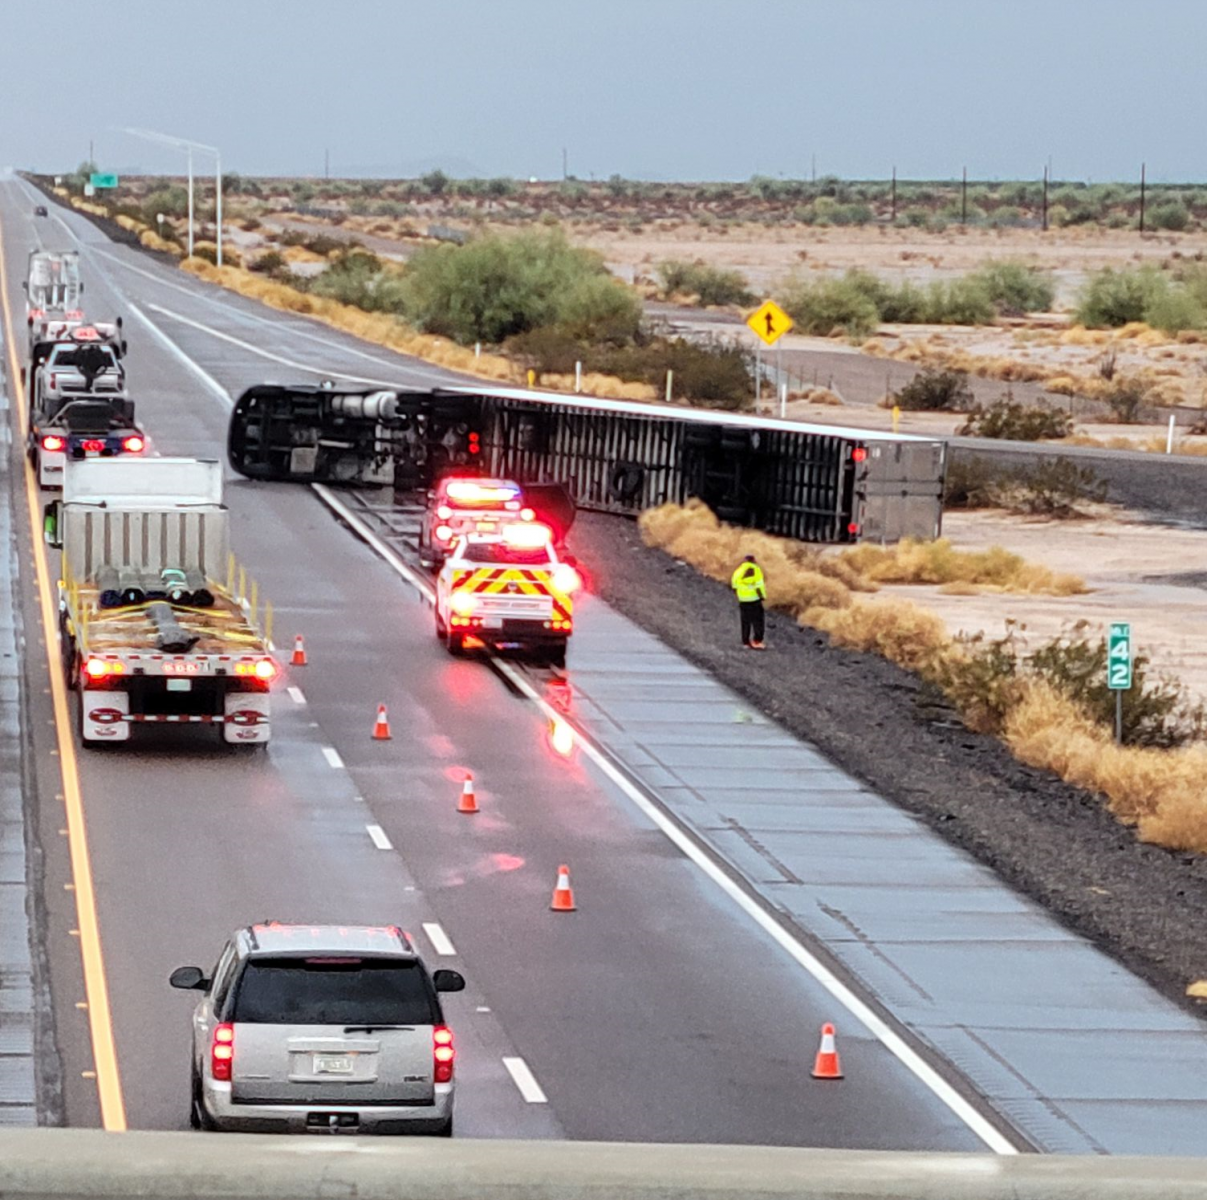
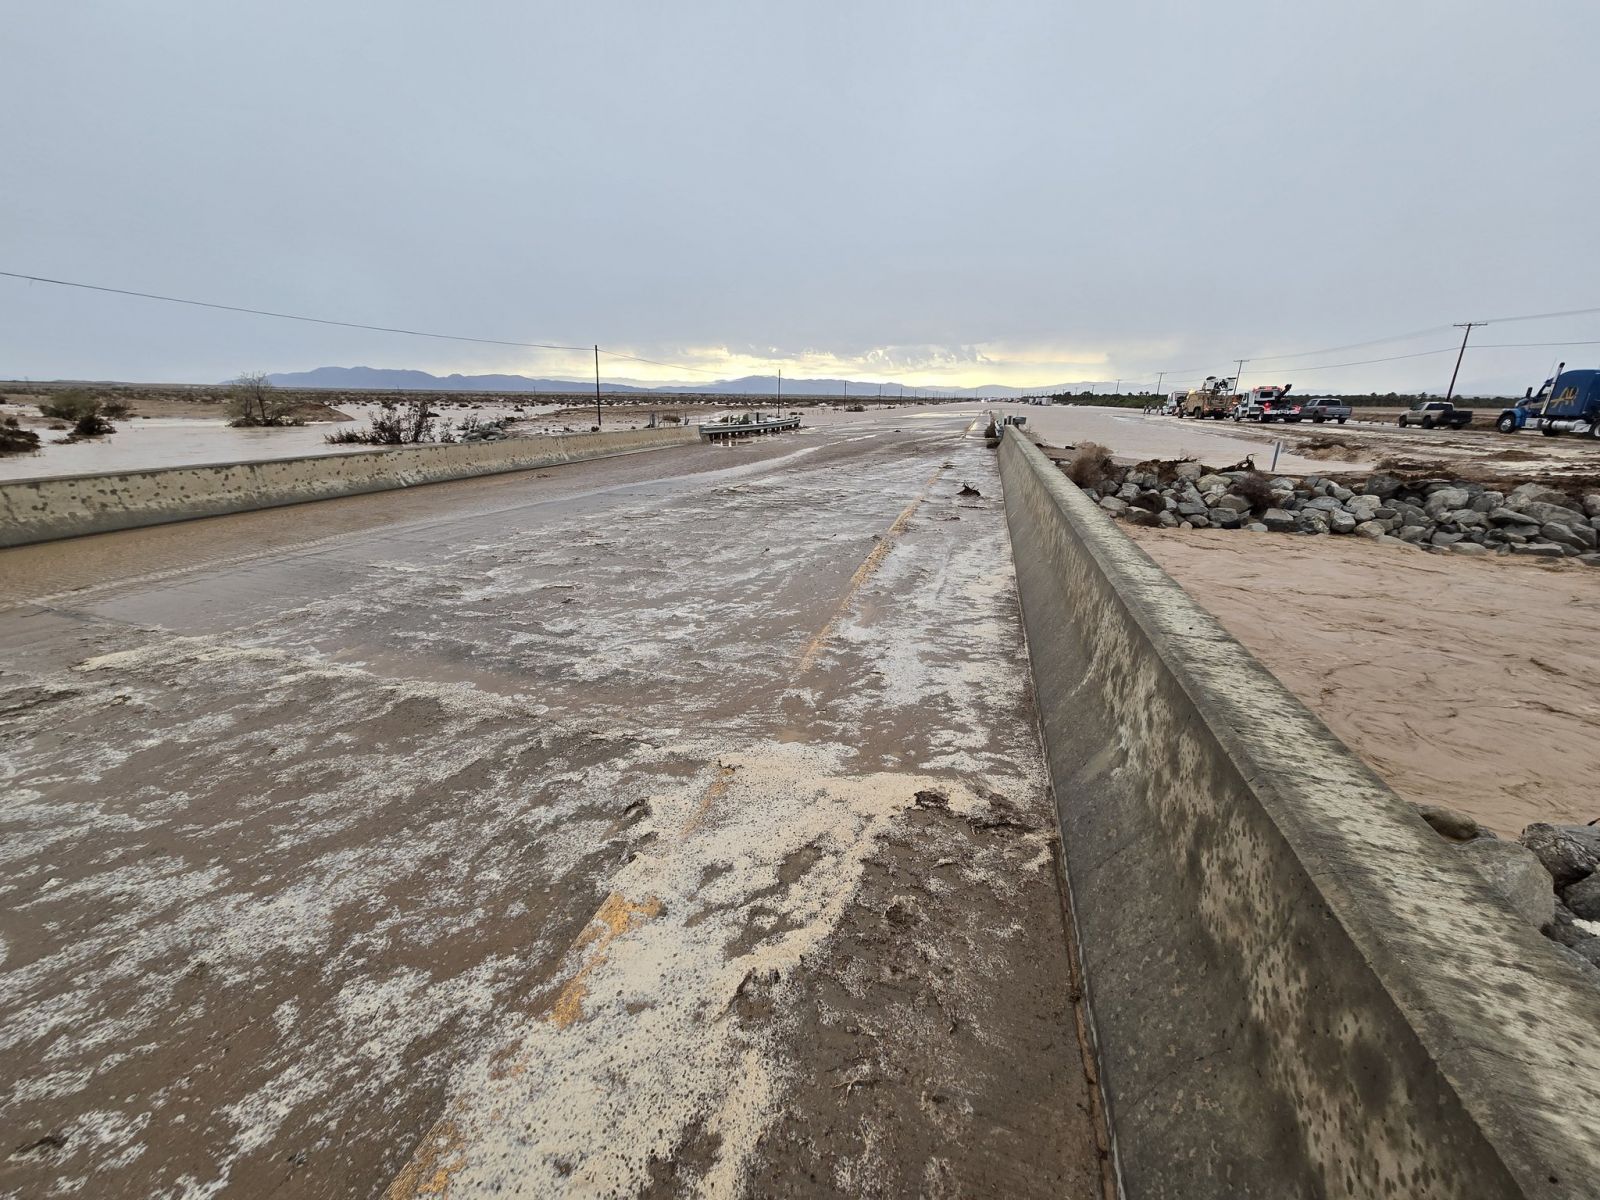
Monsoonal activity was not limited to just Pinal and Maricopa counties. Farther west, during the early afternoon hours, convection quickly initiated over the mountains of the northern Baja Peninsula, with new storms exploding over Imperial County, California and quickly becoming severe with additional severe storms developing eastward through Yuma County in southwest Arizona (Fig. 6). Soon after, damaging wind reports began to arrive with multiple instances of power poles being knocked over, and semi trucks being flipped over on I-8 near Tacna, AZ and California Highway 86 in Imperial County (Fig. 8-9). Over the next few hours, the impacts shifted to more of a hydrological threat as heavy rain continued over many of the same areas in Yuma and Imperial counties as radar estimates indicated 3 hour rain totals between 2-3” in some spots. To put some of these rain totals into perspective, a cooperative observing site in Tacna, AZ reported 1.9” of rain in an hour, which is ~50% of the yearly average for this station. The multiple inches of rain that fell in a very short amount of time resulted in significant flash flooding, especially across Imperial County, where there were multiple reports of overflowing washes that resulted in road closures and stranded vehicles, requiring numerous water rescues. One of the hardest hit spots was along CA Highway 86 from the Elmore Desert Ranch area to the CA Highway 78 interchange (Fig.10-11).
Fig. 6: Reflectivity loop from 10:11 AM to 9:11 PM MST/PDT on August 25th, 2025 from the KYUX (Yuma, AZ) radar showing the complex of storms traversing southeast CA and southwest AZ.
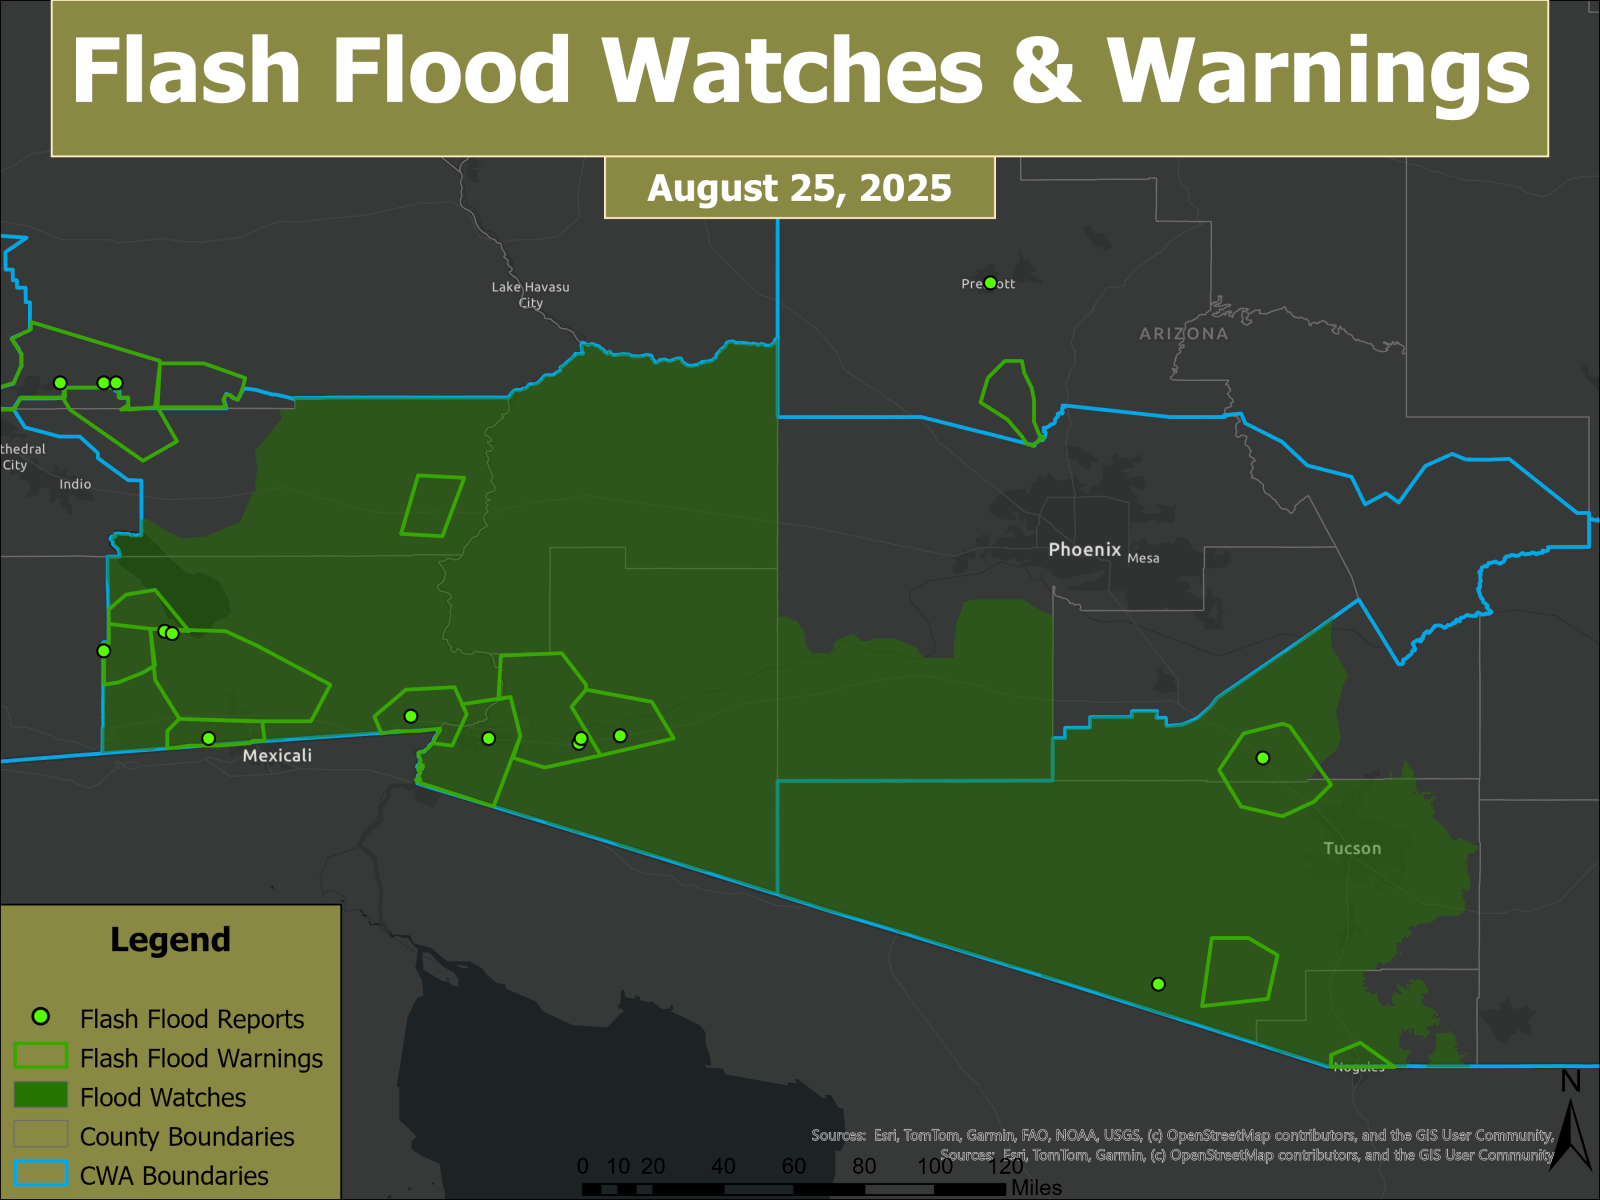
Fig. 7: Spatial extent of the Flood Watches and Flash Flood Warnings issued by the NWS Offices in Phoenix, Flagstaff, Tucson, and Las Vegas. Locations of flash flood reports are noted with the green dots.
 |
 |
 |
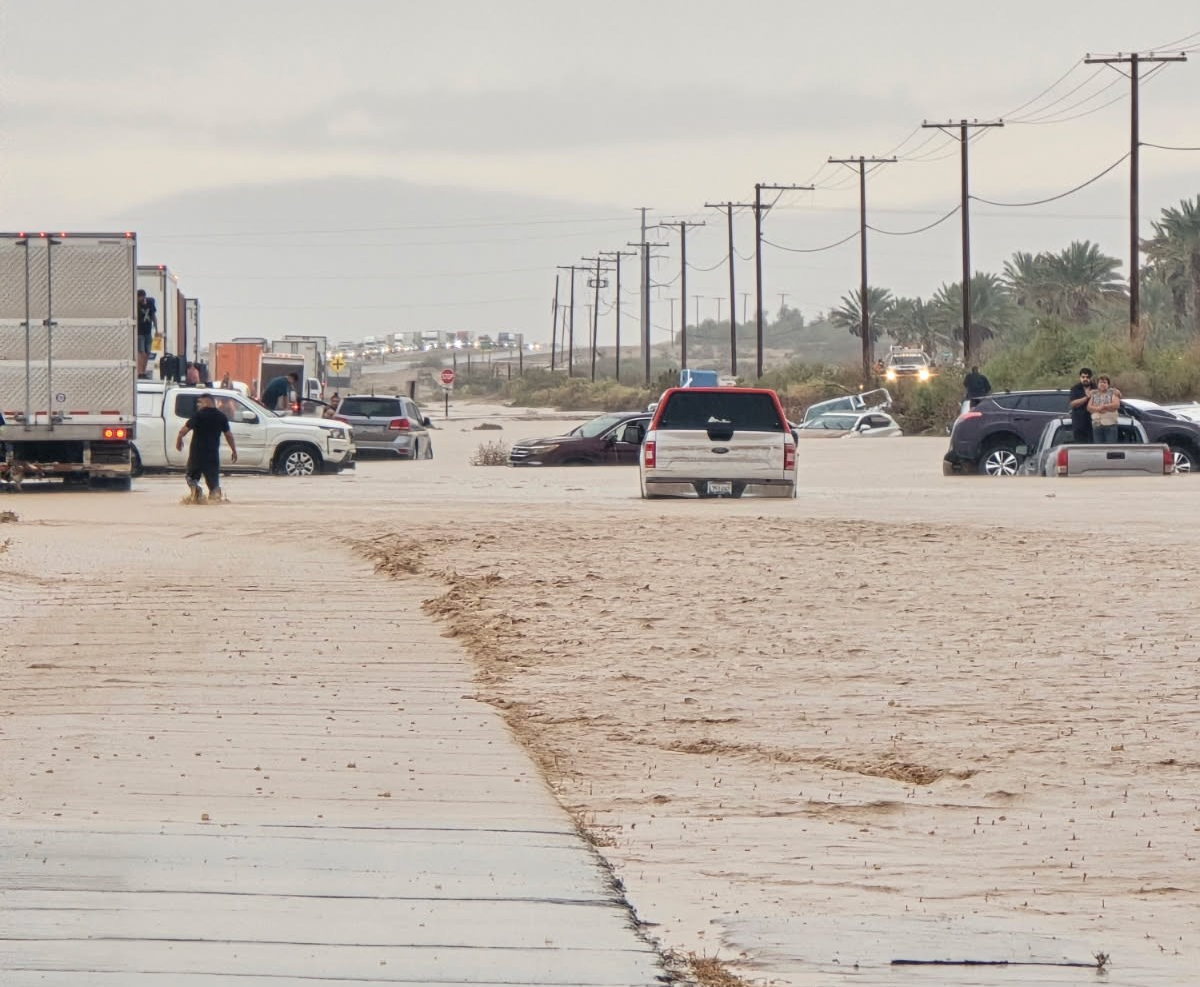 |
Fig. 8-11: Images of the wind and flood damage across Yuma and Imperial Counties. Image location and sources (Clockwise from top-left): Several downed power poles near Interstate 8 east of El Centro (@PezmanWx on X); Large semi-truck flipped on I-8 near Tacna (Lillian Tuffly on Facebook); Numerous vehicles stranded in flood waters along Highway 86 near Elmore Desert Ranch (Imperial County Office of Emergency Management); Residual debris from the flooding along Highway 86 near Elmore Desert Ranch (Christopher Jacobs on X).
Storm Environment:
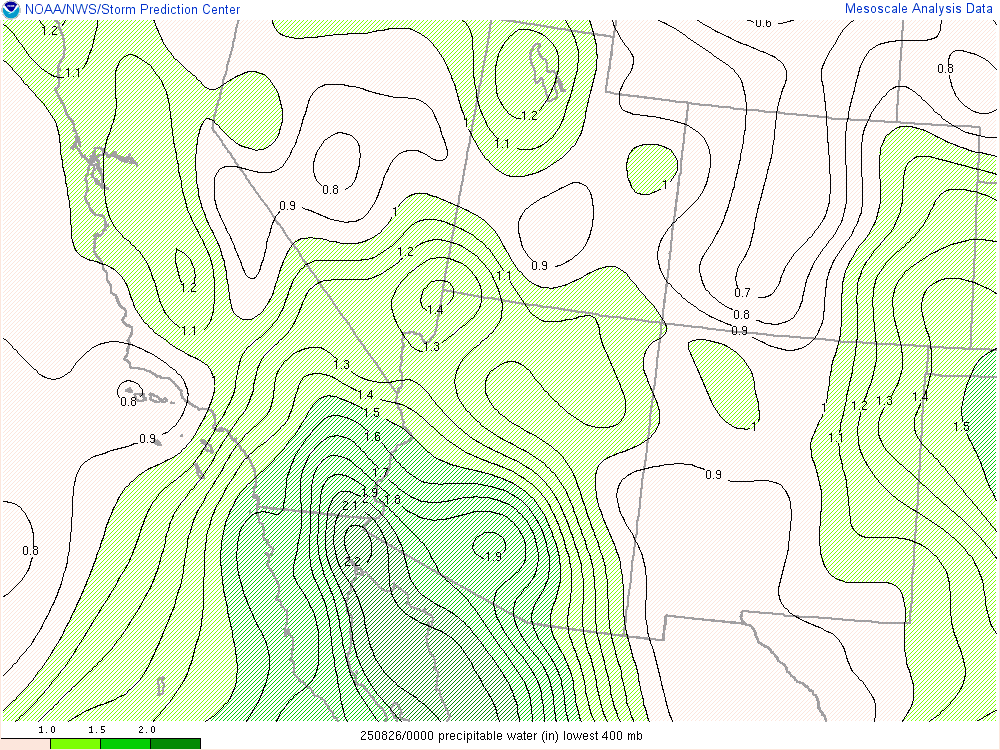
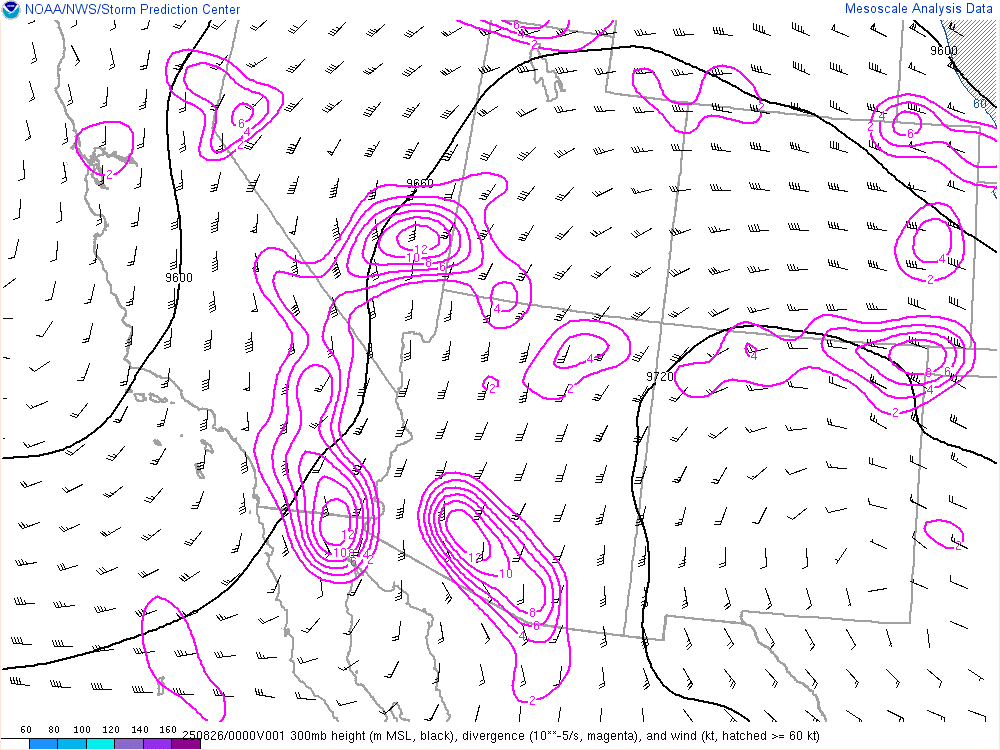
The environment was primed for heavy rainfall, especially out in the western portions of our forecast area where precipitable water values (PWATs) ranged between 1.7-2.1” (Fig.12). The abundance of moisture, distributed throughout the atmospheric column, translated to decent/robust instability (mixed layer convective energy, or MLCAPE) profiles with values ranging from a couple hundred J/kg over south-central AZ, to upwards of 2000 J/kg for southeast California (Fig. 13). Mesoscale analysis, along with morning weather balloon soundings from Phoenix and Yuma, did indicate a strong capping inversion for the region (mixed layer convective inhibition, or MLCIN >100 J/kg for some spots), but by the time the late morning/early afternoon hit, enough destabilization had occurred to allow for convective initiation. The overall dynamic setup was favorable for sustained thunderstorm activity with broad ascent thanks to approaching remnants of a Mesoscale Convective Vortex (MCV) from Northern Sonora, a Pacific trough off to the west, and upper-level wind speed divergence over the Desert Southwest (Fig. 14). Adding to the storm's sustenance and structure was the presence of effective bulk shear, which was greater in magnitude than what is typically observed during the monsoon, with values exceeding 25-30 knots (Fig. 15).
 |
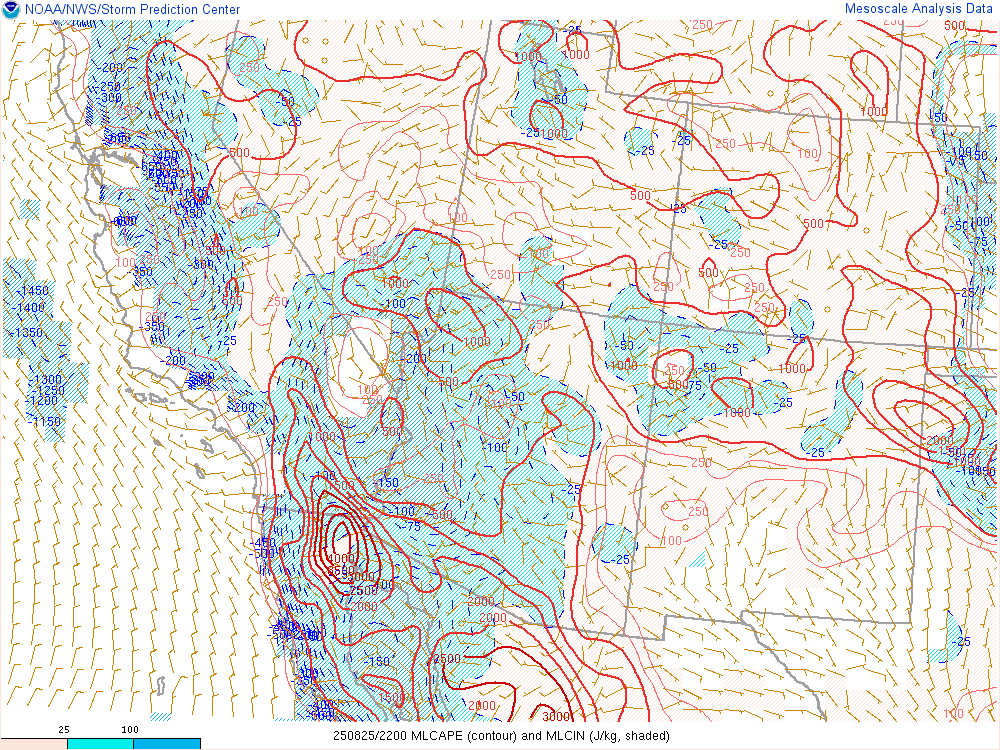 |
Fig. 12-13: (Left) Precipitable Water Values at 5 PM MST/PDT August 25, 2025; (Right) Mixed Layered Convective Available Potential Energy (MLCAPE) and Mixed Layer Convective Inhibition (MLCIN) at 3 PM MST/PDT August 25, 2025.
 |
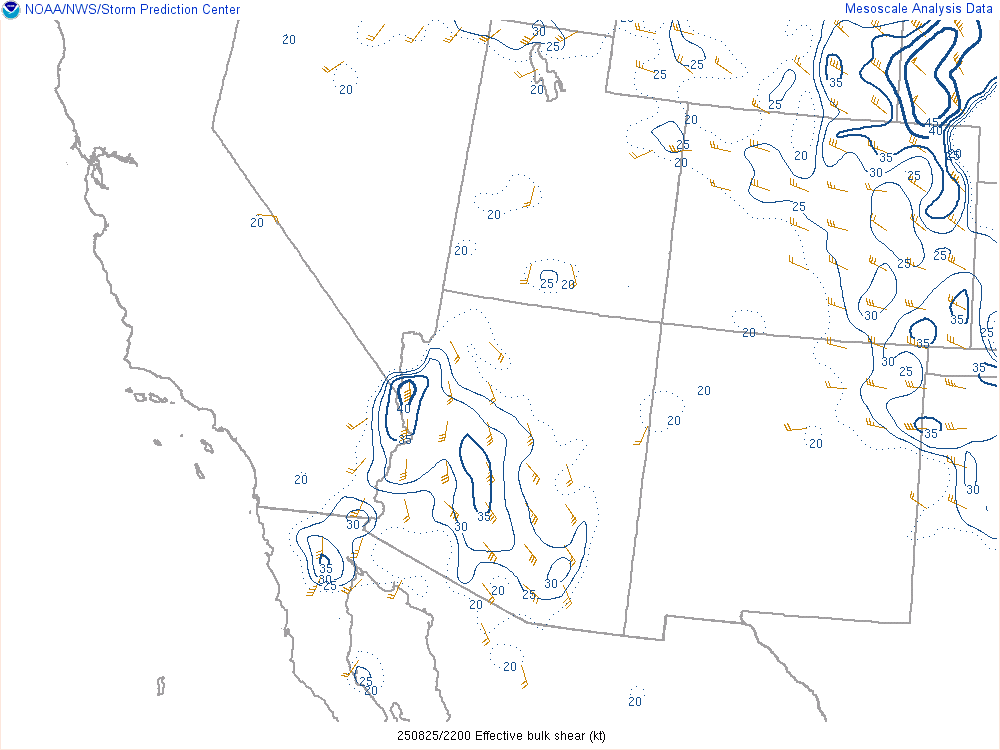 |
Fig. 14-15: (Left) 300 mb heights, divergence, and winds at 5 PM MST/PDT August 25, 2025; (Right) Effective Bulk Shear at 3 PM MST/PDT August 25, 2025.

