August 12, 2026: Damaging Winds, Dust Storm, and Flash Flooding
During the mid-to-late afternoon hours of Wednesday, August 12th, widespread shower and thunderstorm activity broke out across the western deserts, spanning from Imperial County in southeast California into southwest Arizona, particularly La Paz County (Fig. 1). A number of these storms reached severe levels, generating damaging winds and flash flooding. The most significant severe weather impacts were centered in the Imperial Valley and the town of Quartzsite in La Paz County.
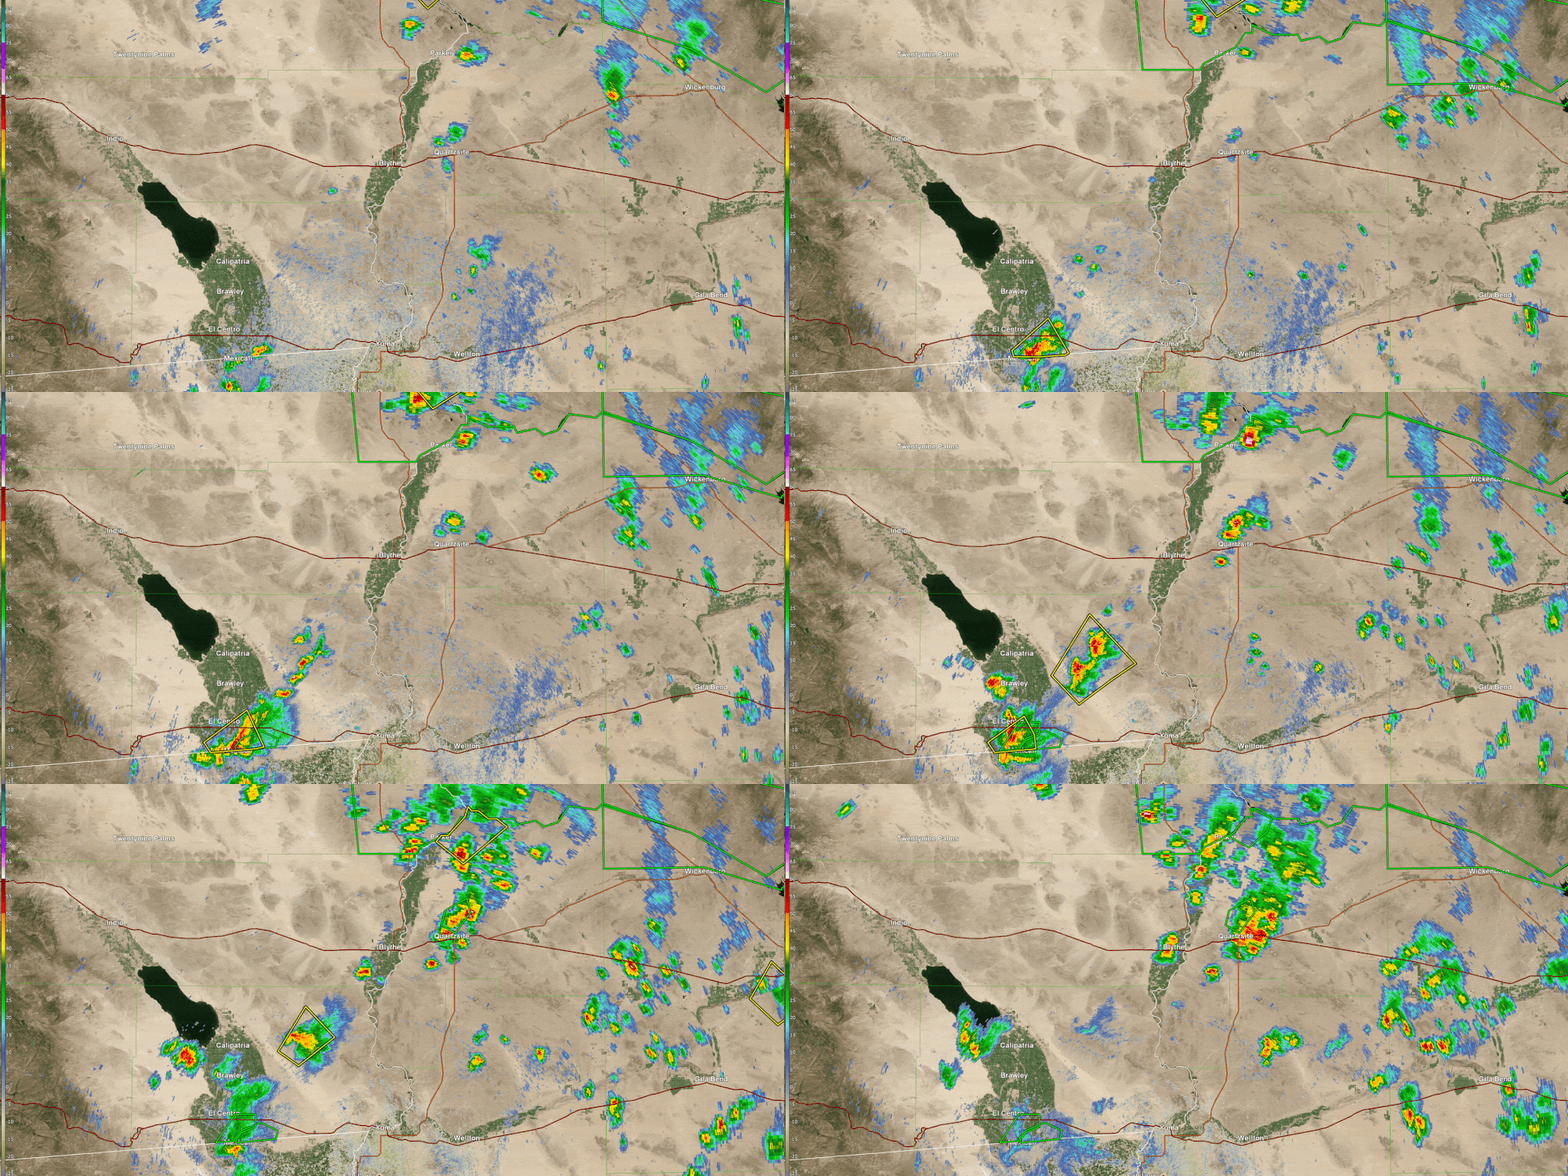
Fig. 1: Radar reflectivity imagery between 3:30 PM MST/PDT and 6:00 PM MST/PDT on August 12, 2026 from the KYUX (Yuma, AZ) radar showing the areas of showers and thunderstorms that impacted southeast CA and southwest AZ, including the thunderstorm clusters that impacted the Imperial Valley and Quartzsite areas. The yellow and green polygons denote the Severe Thunderstorm and Flash Flood Warnings issued, respectively.
Imperial Valley: Damaging Winds & Dust Storm
High winds and dense blowing dust were the primary hazards associated with the storm cluster in the Imperial Valley. Both the Imperial County Airport and El Centro Naval Air Facility measured peak gusts of 58 and 59 mph, respectively. Winds may have been even stronger south of Interstate 8, closer to the storms, but there were no surface observations in the area of the storms. The majority of the wind damage came in the form of snapped or downed power poles. According to the Imperial Irrigation District, the severe damaging winds compromised over 150 power poles. The heaviest damage was concentrated in the communities of Holtville, El Centro, Heber, and Calexico with over 5000 customers losing power at one point (Fig. 2-3). A strong outflow emanating from the storm cluster generated a large dust storm that surged northward through western Imperial County and into portions of Riverside County, including moving across the Salton Sea and Coachella Valley to the northwest (Fig. 4). Ground truth webcam observations as well as trained spotters showed/reported surface visibilities dropping below a quarter-mile within the dust storm.
 |
 |
Fig. 2-3: Images of multiple snapped powerpoles in the Imperial Valley (photo credit: Imperial Irrigation District)

Fig. 4: Webcam capture of the dust storm, from the eastern shore of Salton Sea, as it moved northward through Imperial County (footage credit: Imperial Irrigation District)
Quartzsite: Heavy Rainfall & Flash Flooding
Around Quartzsite, flash flooding was the primary storm hazard. Doppler radar estimated rainfall from the Yuma, AZ radar indicated rainfall totals in the 2-4 inch range over a three-hour time span as thunderstorm cells repeatedly trained over the same area (Fig. 5-6). The prolonged heavy rainfall led to extensive flooding. There were several inches of flowing water on Interstate 10 that forced a highway closure for several hours (Fig. 7). Fast-flowing water reached several inches deep and flowed through a couple of local RV parks, while mud and water runoff caused damage to multiple businesses in town (Fig. 8-10).
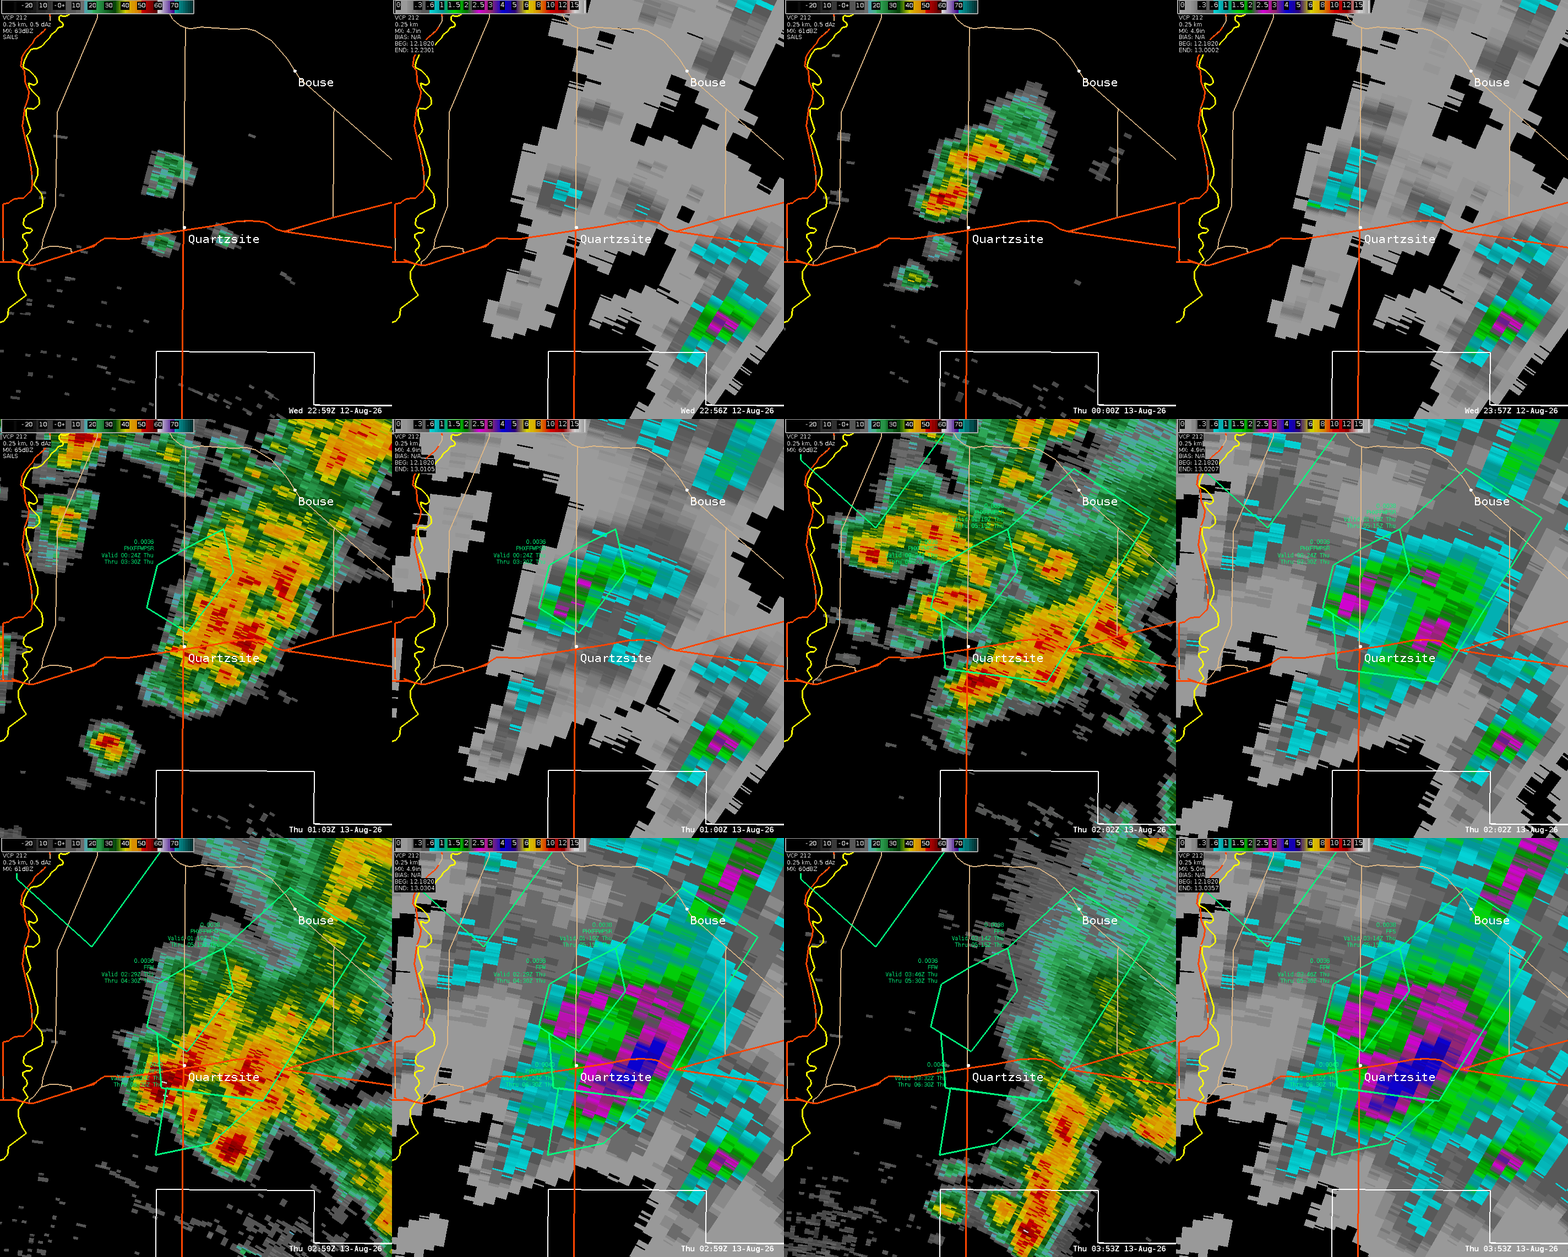
Fig. 5-6: Left image: Radar reflectivity loop between 3:59 PM MST and 8:53 PM MST on August 12th, 2026 from the KYUX (Yuma, AZ) radar showing the cluster of storms training over the Quartzsite area. Right image: Radar estimated total rainfall accumulation during the same time period showing a widespread swath of 2-4 inches over the area. The green polygons indicate Flash Flood Warnings issued by the NWS Phoenix Weather Forecast Office.

Fig. 7: Footage of the flooding along Interstate 10 in the Quartzsite area (footage credit: Hailey Cole on Facebook).

Fig. 8: Footage of the fast-flowing floodwater moving through an RV park on the east side of Quartzsite (footage credit: Christina Peterson on Facebook)
 |
 |
Fig. 9-10: Images of the water and mud damage impacting a couple of businesses in Quartzsite. Left image: Silly Al’s Pizzeria (photo credit: Silly Al’s Pizza on Facebook). Right image: Quartzsite Gem and Mineral Club (photo credit: HannahJoy Fleury on Facebook).
Atmospheric conditions prior to storm initiation were highly conducive for strong convective development across the region. Pre-storm mesoscale analysis revealed abundant moisture in place throughout southwest Arizona and southeast California, with precipitable water (PWAT) values surpassing 1.7 inches (Fig. 11). Coupled with colder than normal 500 mb temperatures around -7°C, this deep moisture fueled moderate-to-strong atmospheric instability, with mixed-layer convective available potential energy (MLCAPE) ranging between 1500 and 2000 J/kg (Fig. 12-13). Alongside the favorable thermodynamic support, broad dynamic forcing was present thanks to a large-scale low pressure system positioned off the West Coast, which provided upper-level speed divergence to sustain and increase thunderstorm coverage across the area (Fig. 14).
 |
 |
Fig. 11-12: (Left) Precipitable Water Values at 3 PM MST/PDT August 12, 2026; (Right) MLCAPE and Mixed Layer Convective Inhibition (MLCIN) at 3 PM MST/PDT August 12, 2026.
 |
 |
Fig. 13-14: (Left) 500 mb heights, temperature, and winds at 3 PM MST/PDT August 12, 2026; (Right) 300 mb heights, divergence, and winds at 3 PM MST/PDT August 12, 2026.



 Follow us on X
 Follow us on Facebook
 Follow us on YouTube
 PSR RSS Feed