A significant winter storm impacted parts of the region beginning during the day on Friday, February 5th and continuing through the early morning hours of Saturday, February 6th.
Low pressure developed along the Gulf coast Friday morning, traveled northeast to near the Carolina coast by Friday evening and then intensified rapidly just southeast of Chesapeake Bay overnight (see Figure 1 below).
 |
At the same time, a strong upper level disturbance moved east from the Central Plains through the mid Mississippi Valley. This contributed to the development of a secondary, weaker wave of low pressure over the Ohio Valley, along the northwest flank of the coastal system (see Figures 1 and 2).
 |
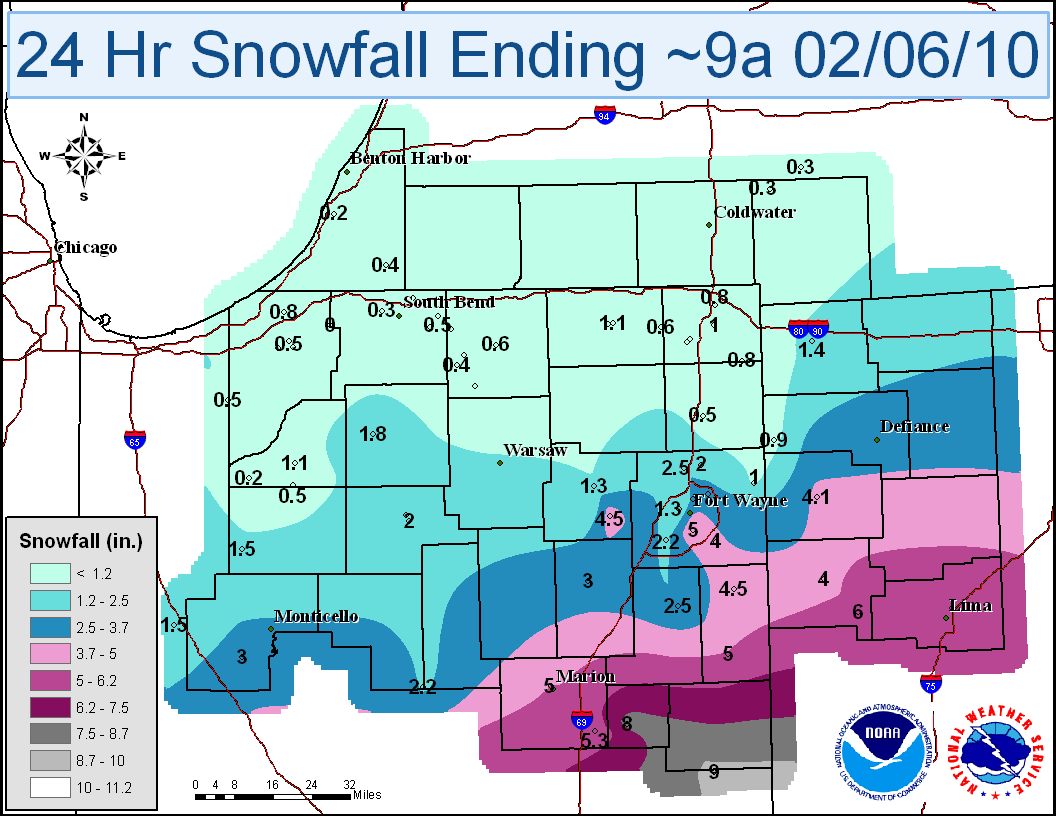
Interaction between the approaching upper level disturbance and deep moisture associated with the weak wave of low pressure over the Ohio Valley resulted in the development of a band of moderate to occasionally heavy snowfall that moved into northern Indiana and northwest Ohio during the late morning and afternoon on Friday (see Figure 3 below). By Friday afternoon and evening, occasionally heavy snow was reported primarily south of US Route 24. Snow gradually tapered off from northwest to southeast after midnight as the low pressure system pulled east of the region.
 |
Snowfall totals for the event ranged from just a dusting over southwest Lower Michigan and extreme northwest Indiana to near 10 inches north of Muncie, IN, near Portland and Hartford City (see Figure 4).
 |
In addition to the snowfall, strong winds developed across the area as the sea-level pressure gradient strengthened between high pressure north of the Great Lakes and the developing low pressure southeast of the region (see Figure 5).
 |
The following trace (Figure 6) shows wind speeds observed at Fort Wayne, In through the event, where a peak wind of almost 50 mph was observed after midnight Friday night. This caused widespread blowing and drifting of snow resulting in drifts of up to 4 feet in some locations, with drifts of up to one foot even in areas where less than one inch of snow fell!
 |
Story and Webpage Author: Justin Arnott

