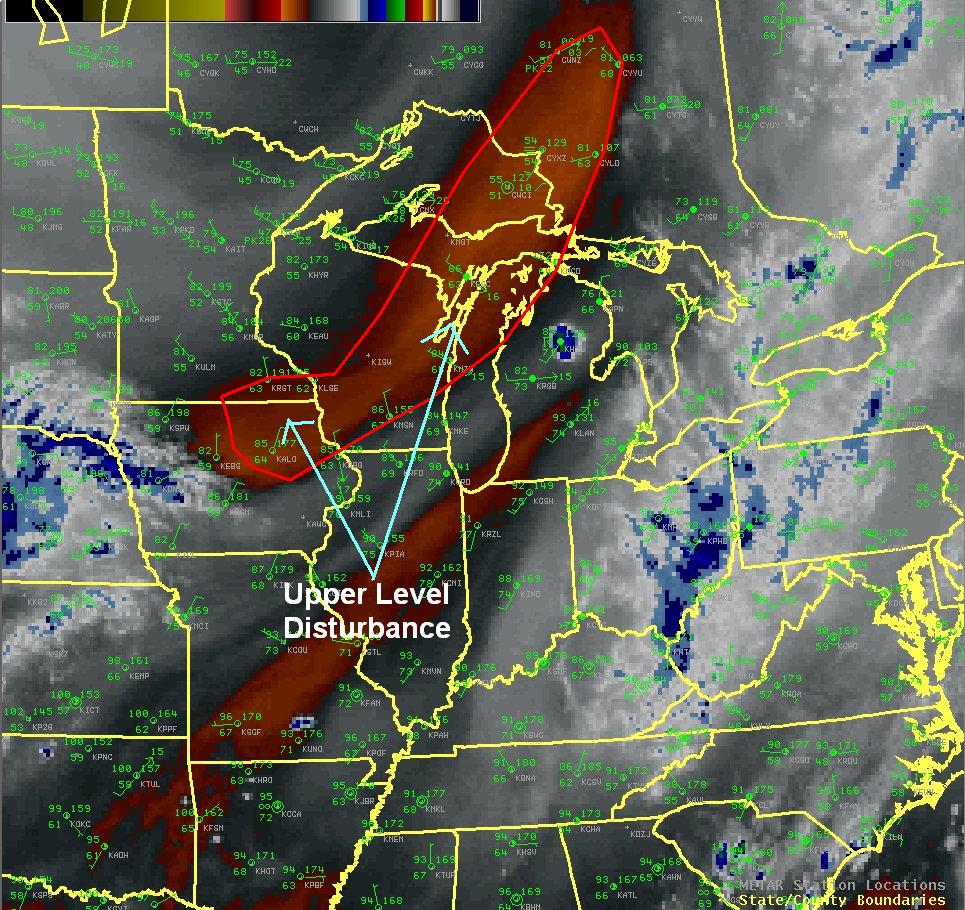
A very warm and humid airmass overspread the region on Saturday allowing for a very unstable air mass to be in place across the local area. An upper level disturbance from the upper Midwest combined with an advancing cool front and very high instability to produce severe thunderstorms across the area. The following surface map from the late afternoon indicates the approximate position of the cold front at 5 pm EDT. The satellite image below represents water vapor imagery from late afternoon Saturday indicating the approximate position of the upper level disturbance that would help initiate the severe thunderstorms.
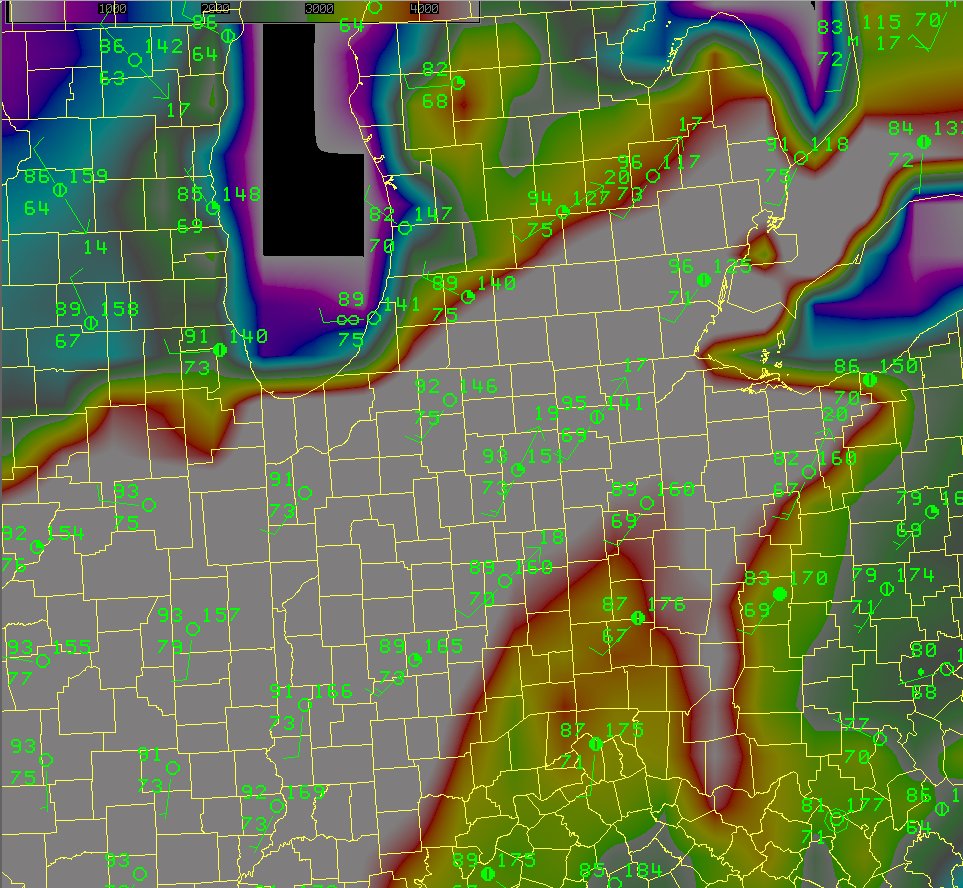
The above surface map shows the very warm and unstable air in place across southern lower Michigan and northern Indiana ahead of the front. The following image shows a model depiction of Convective Available Potential Energy (CAPE), which can be used to get an idea as to the amount of buoyancy or instability available. CAPE values in excess of 3000-4000 J/kg typically signify moderate to strongly unstable conditions. CAPE values from east central Illinois into portions of northwest and north central Indiana were as high as 6000-6500 J/kg on Saturday afternoon suggesting very strong instability. Areas with CAPEs greater than 4000 J/kg are shaded white in the image below. Note the lower values just east of the Lake Michigan shoreline in southwest lower Michigan which escaped the thunderstorm activity. Conditions were slightly more stable across these areas due to westerly flow off Lake Michigan which resulted in a lake boundary. This lake boundary would serve as a focus for initial thunderstorm development late in the afternoon ahead of the cold front.
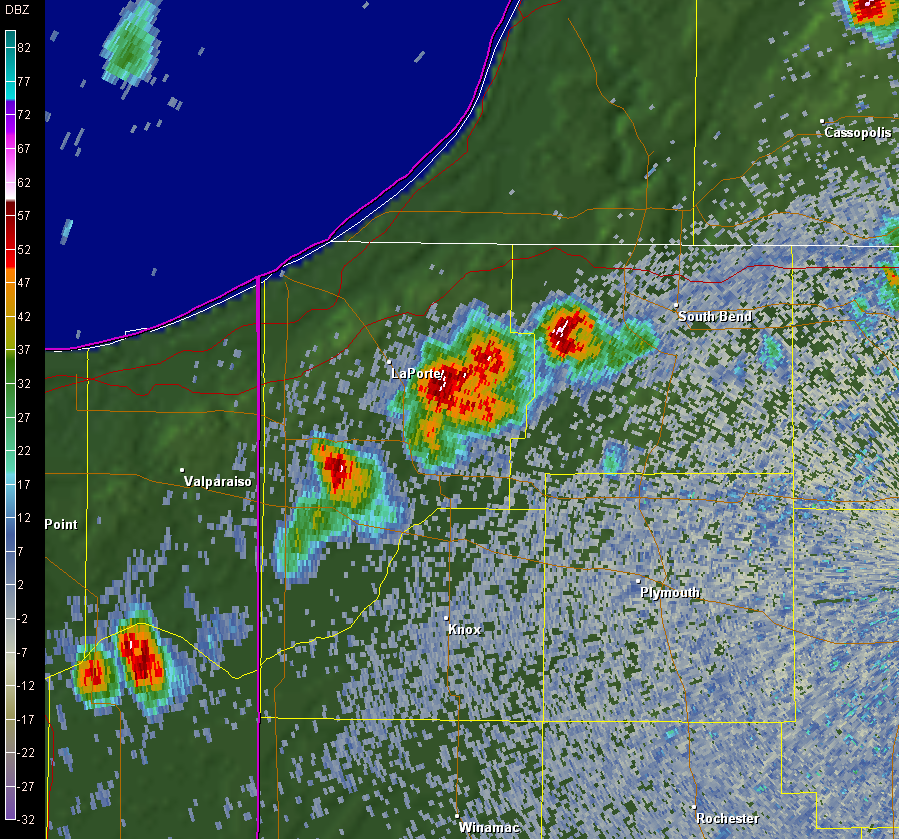
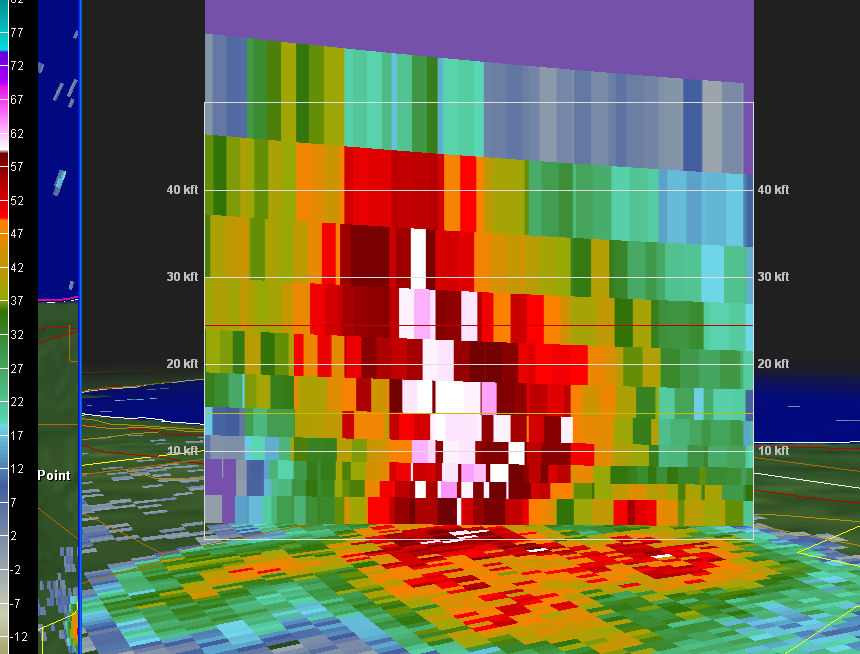
The image below indicates the initial thunderstorm development along this boundary just after 5pm EDT. The wind shear in the atmosphere was relatively weak, but the extreme instability resulted in large hail during the late afternoon hours. The radar image below of 0.5 degree base reflectivity indicates the initial thunderstorm development in La Porte county late Saturday afternoon. A vertical cross section of base reflectivity through the storm just east of La Porte, Indiana indicates just how strong this storm was with very high reflectivities extending to 45,000 feet above ground level. With such vigorous updrafts, very large hail was produced with this storm.
This storm would produce very large hail east of La Porte, with a report of hail in excess of 2 inches of diameter in the Mill Creek area. The following is an image of this hail that was received by WNDU in the Mill Creek area:
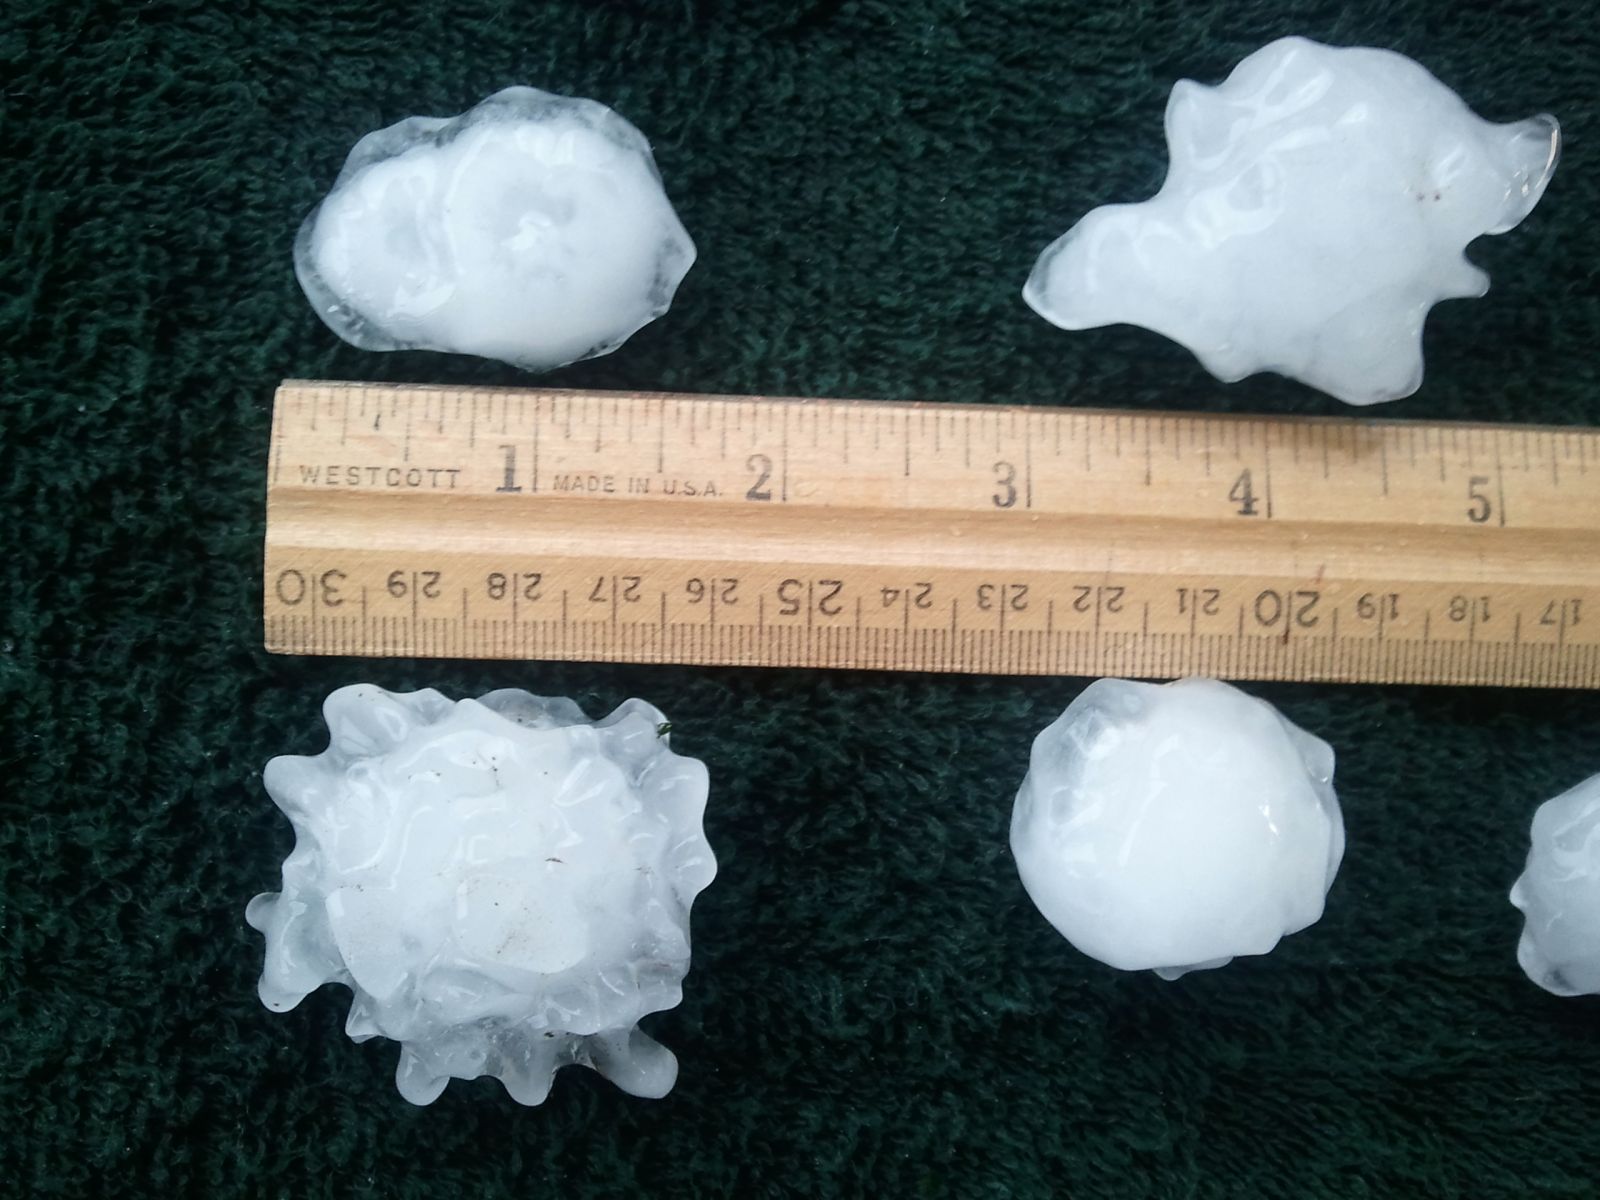
PHOTO COURTESY OF WNDU WEATHER/JEN AND BRIAN LAMBERT
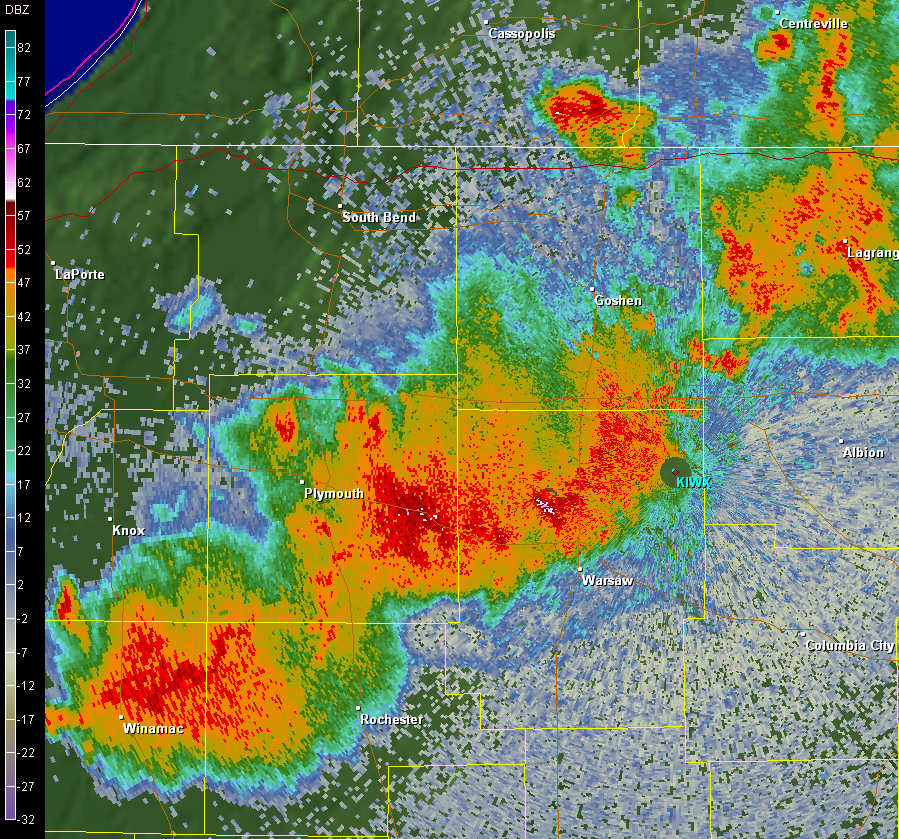
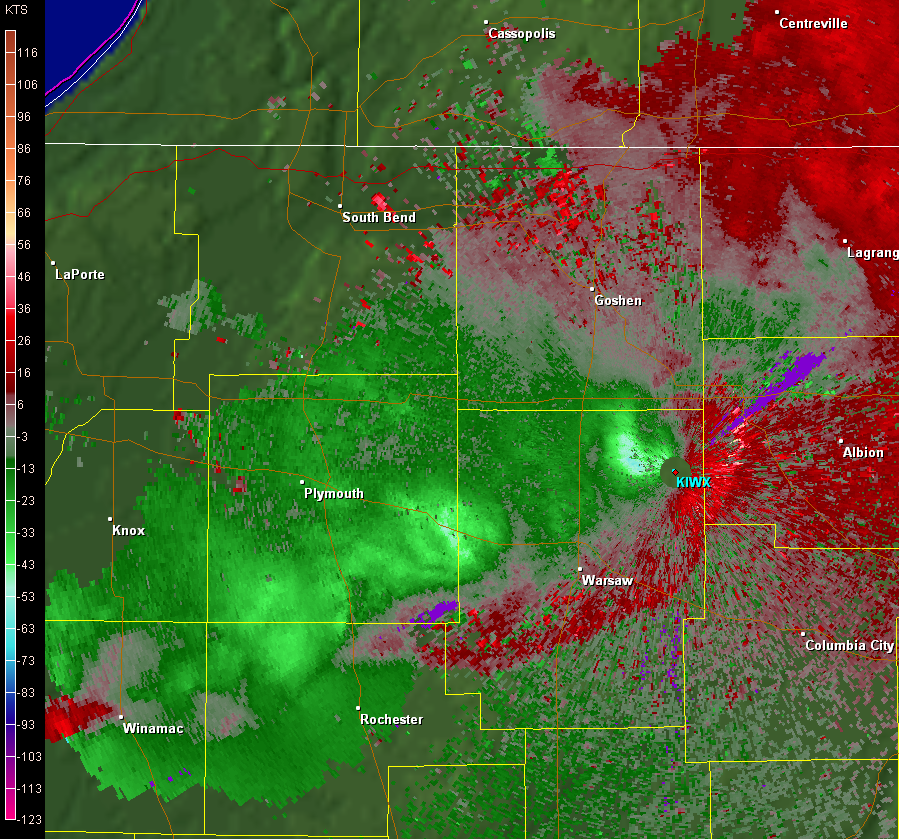
Eventually the thunderstorms began to merge as they moved into north central Indiana. As this occurred, a damaging wind threat developed. The following radar images are base reflectivity (top) and base velocity (bottom) from approximately 650 pm EDT. Note the brighter shades of green in the velocity data indicating winds blowing toward the radar site (KIWX). A wind gust of 57 mph was reported at the NWS Northern Indiana office, with various reports of downed trees across the area.
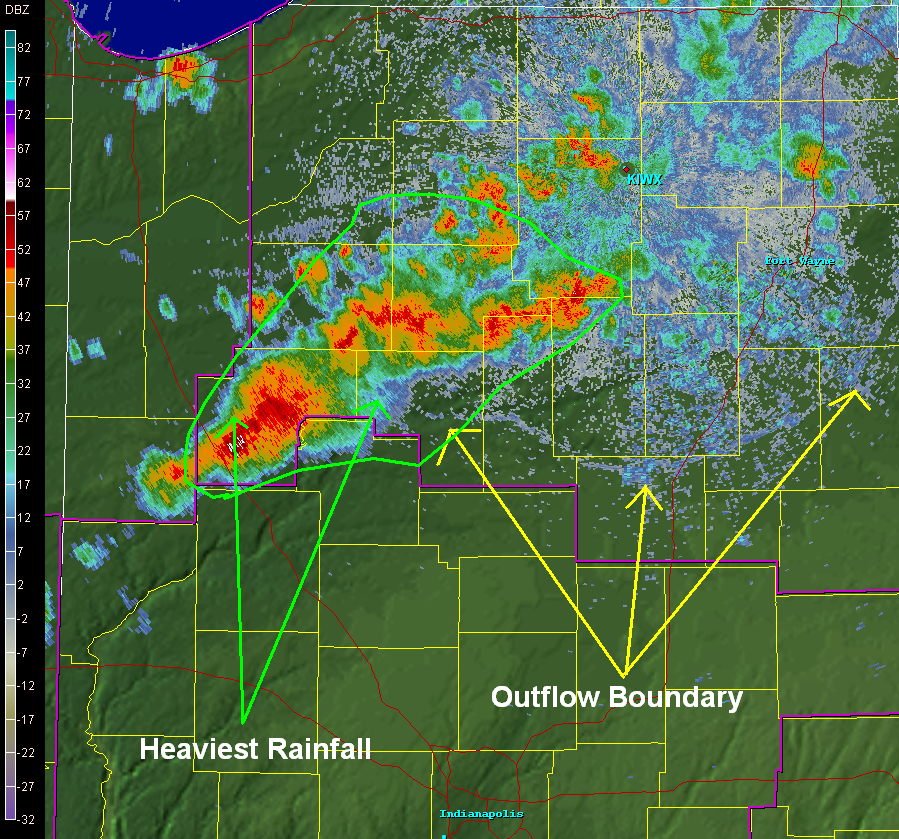
Eventually an outflow boundary raced well ahead of the storms across northeast Indiana, with the stronger thunderstorms continuing to affect northwest and north central Indiana where the greatest instability existed. Even though the outflow boundary raced well ahead of the storms across northeast Indiana, wind gusts to 40 to 50 mph were common in the Columbia City and Fort Wayne areas. The following radar image of base reflectivity from around 7 pm EDT highlights this outflow boundary. By late evening, the main threat shifted to heavy rain and flooding, especially across southwest portions of the area where some locations picked up between 1 and 3 inches of rain.
Below is a graphical depiction of local storm reports received for the event. The green tags represent hail reports, the blue tags represent wind reports, and the cyan tags represent heavy rain/flooding reports. Clicking the tags will allow you to view that particular storm report. Thanks to all spotters, law enforcement, amateur radio, public, emergency management, and media for reports during the event.
View Storm Reports 7/2/2011 in a larger map
MARSILI/BENTLEY

