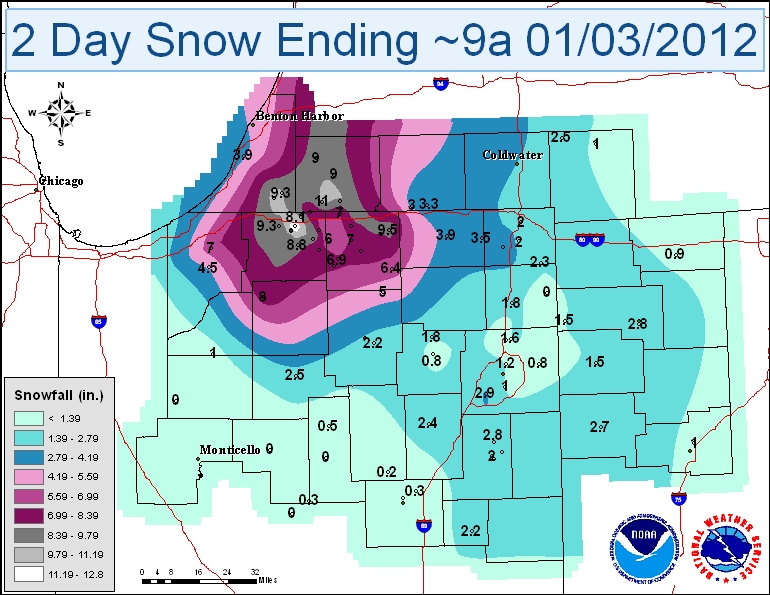
After a relatively slow start to the 2011-2012 winter season across much of the area, the New Year brought wintry conditions to the region. An upper level trough dropped southeast out of central Canada into the Great Lakes region on Sunday, January 1st, accompanied by a surface low and cold front. Temperatures started out in the mid to upper 40s early Sunday ahead of the front, with breezy conditions across the region as the low approached. As the cold front rushed east across the region throughout the day, temperatures fell sharply, and rain began to change over to snow. Cold air spilled into the region behind the front, along with a few upper level disturbances, which helped produce lake effect snow late Sunday through early Tuesday. Below is a 2 day map of snowfall ending around 9 AM on January 3, 2012, and a list of selected snowfall reports from across the area.
| STORM TOTAL SNOWFALL | ||||
| LOCATION | STORM | TIME | DATE | |
| TOTAL | OF MEASUREMENT | |||
| SNOWFALL | ||||
| (INCHES) | ||||
| INDIANA | ||||
| ...ALLEN COUNTY... | ||||
| FORT WAYNE AIRPORT | 2.9 | 700 | AM | 3-Jan |
| 9 NE FORT WAYNE | 0.8 | 1030 | PM | 2-Jan |
| ...ELKHART COUNTY... | ||||
| MIDDLEBURY | 9.5 | 818 | PM | 2-Jan |
| 2 WNW GOSHEN | 8.3 | 800 | AM | 3-Jan |
| 3 ENE ELKHART | 8 | 1030 | PM | 2-Jan |
| BRISTOL | 8 | 550 | PM | 2-Jan |
| ELKHART | 8 | 1103 | PM | 2-Jan |
| SIMONTON LAKE | 7 | 600 | PM | 2-Jan |
| DUNLAP | 7 | 535 | PM | 2-Jan |
| 2 NE WAKARUSA | 6.9 | 800 | AM | 3-Jan |
| 1 SW MILLERSBURG | 6.4 | 730 | AM | 3-Jan |
| 1 WNW JIMTOWN | 6 | 800 | AM | 3-Jan |
| GOSHEN | 5 | 600 | PM | 2-Jan |
| ...FULTON COUNTY... | ||||
| 2 NNW ROCHESTER | 2.5 | 800 | AM | 3-Jan |
| ...KOSCIUSKO COUNTY... | ||||
| SYRACUSE | 5 | 800 | AM | 3-Jan |
| 1 SE WINONA LAKE | 2.2 | 800 | AM | 3-Jan |
| ...LA PORTE COUNTY... | ||||
| 2 E LA PORTE | 7 | 800 | AM | 3-Jan |
| KINGSBURY | 4.5 | 800 | AM | 3-Jan |
| ...LAGRANGE COUNTY... | ||||
| 1 NE LAGRANGE | 3.9 | 800 | AM | 3-Jan |
| 2 E BRUSHY PRAIRIE | 3.5 | 800 | AM | 3-Jan |
| ...LAPORTE COUNTY... | ||||
| LAPORTE | 5.2 | 1030 | PM | 2-Jan |
| TRAIL CREEK | 2.5 | 558 | PM | 2-Jan |
| MICHIGAN CITY | 1.8 | 433 | PM | 2-Jan |
| ...MARSHALL COUNTY... | ||||
| TYNER | 8 | 600 | AM | 3-Jan |
| LA PAZ | 5 | 545 | PM | 2-Jan |
| 5 SW PLYMOUTH | 4.3 | 730 | PM | 2-Jan |
| ...NOBLE COUNTY... | ||||
| 4 W ALBION | 4.5 | 800 | AM | 3-Jan |
| ...ST. JOSEPH COUNTY... | ||||
| SOUTH BEND | 12.8 | 330 | AM | 3-Jan |
| 2 NE SOUTH BEND | 12.5 | 830 | PM | 2-Jan |
| 2 ESE MISHAWAKA | 9.8 | 800 | AM | 3-Jan |
| 4 NW SOUTH BEND | 9.3 | 700 | AM | 3-Jan |
| 4 SW MISHAWAKA | 8.8 | 800 | AM | 3-Jan |
| 2 ENE GEORGETOWN | 8.1 | 800 | AM | 3-Jan |
| MISHAWAKA | 8 | 423 | AM | 3-Jan |
| 4 NE SOUTH BEND | 8 | 350 | AM | 3-Jan |
| 1 S ROSELAND | 8 | 400 | PM | 2-Jan |
| 2 NW TEEGARDEN | 7.5 | 800 | AM | 3-Jan |
| 2 W GRANGER | 7.3 | 800 | AM | 3-Jan |
| 5 SSW OSCEOLA | 7.1 | 800 | AM | 3-Jan |
| ...STARKE COUNTY... | ||||
| KNOX | 3 | 530 | AM | 3-Jan |
| ...STEUBEN COUNTY... | ||||
| LAKE JAMES | 5.8 | 515 | PM | 2-Jan |
| 4 NNW HUDSON | 4.7 | 800 | PM | 2-Jan |
| 3 ENE SALEM CENTER | 3.9 | 800 | AM | 3-Jan |
| ...WELLS COUNTY... | ||||
| 2 NNE NORTH OAKS | 2.8 | 800 | AM | 3-Jan |
| ...WHITLEY COUNTY... | ||||
| 1 SE RABER | 2.7 | 800 | AM | 3-Jan |
| MICHIGAN | ||||
| ...BERRIEN COUNTY... | ||||
| 1 ESE BUCHANAN | 11.2 | 800 | AM | 3-Jan |
| 2 WNW NILES | 9.3 | 800 | AM | 3-Jan |
| NILES | 8.5 | 700 | AM | 3-Jan |
| BERRIEN SPRINGS | 5 | 547 | PM | 2-Jan |
| 2 SSE STEVENSVILLE | 3.9 | 800 | AM | 3-Jan |
| ...CASS COUNTY... | ||||
| EDWARDSBURG | 11 | 630 | AM | 3-Jan |
| 5 E EDWARDSBURG | 10 | 1100 | PM | 2-Jan |
| DOWAGIAC | 9 | 630 | AM | 3-Jan |
| CASSOPOLIS | 9 | 600 | AM | 3-Jan |
| ...HILLSDALE COUNTY... | ||||
| LITCHFIELD | 2.5 | 800 | AM | 3-Jan |
| ...ST. JOSEPH COUNTY... | ||||
| CONSTANTINE | 5.3 | 600 | PM | 2-Jan |
| 4 NNW TWIN LAKES | 3.3 | 800 | AM | 3-Jan |
| OHIO | ||||
| ...DEFIANCE COUNTY... | ||||
| 1 S DEFIANCE | 2.8 | 630 | PM | 2-Jan |
| ...PAULDING COUNTY... | ||||
| ANTWERP | 5 | 652 | PM | 2-Jan |
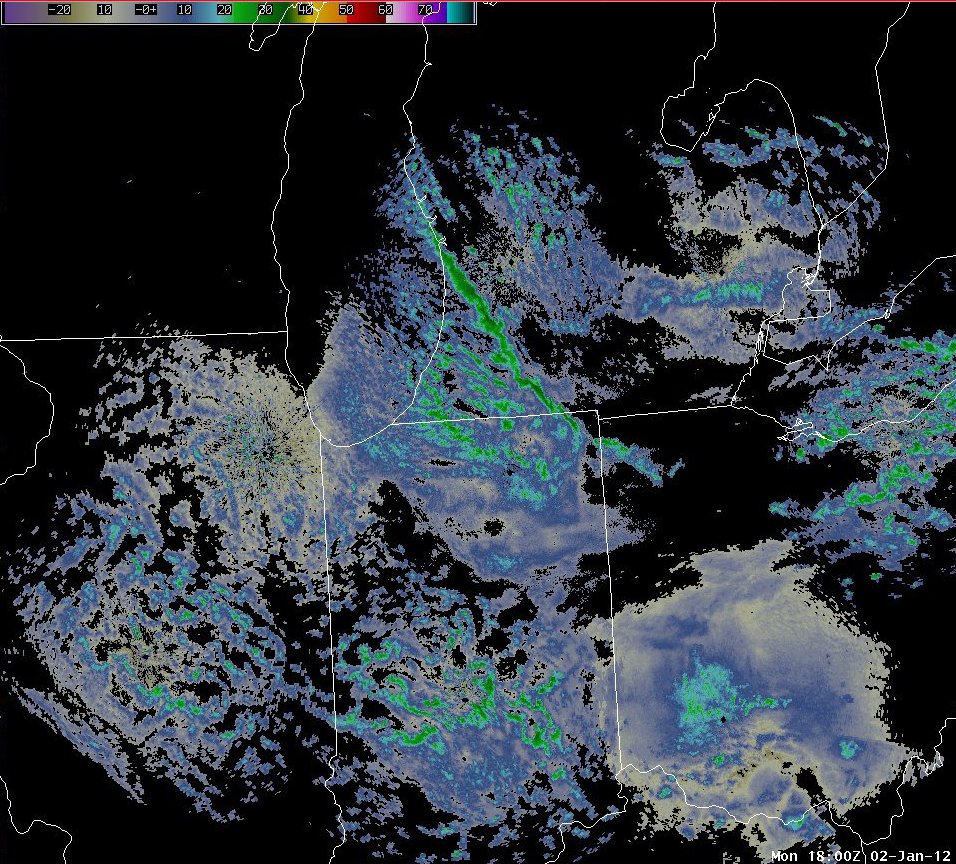
(reflectivity loop)
Above is a radar loop beginning around 12Z January 1, 2012 and ending around 18Z January 3, 2012. Dark blue and purple colors indicate heavier precipitation, and light blue and white colors indicate lighter precipitation. Early in the loop you can see precipitation moving rapidly eastward across the area, associated with the passage of the cold front and associated low pressure. After a slight lull in the precipitation, radar returns expand in coverage and intensity eastward from Lake Michigan. About halfway through the loop, a band of heavier precipitation appears roughly along the Toll Road from Valparaiso to east of South Bend. This is associated with the passage of an upper level disturbance. Later on, another band of heavier precipitation appears, extending from Kalamazoo southeast through Angola and Defiance. This band persists and moves westward through northern Indiana as the loop progresses. Radar returns decrease in coverage and intensity through the end of the loop, as northwesterly winds begin to back more westerly, and more stable conditions develop as temperatures warm aloft. The greatest snowfall amounts were generally obeserved in southwestern Berrien County in Michigan and northeastern St. Joseph County in Indiana, where the snow persisted the longest and snowfall rates were the heaviest. Another area of higher snowfall amounts can be seen on the map from Dowagiac in Cass County, MI southeastward to Middlebury in Elkhart County, IN. This is due to an intense snow band that developed Monday afternoon and persisted into the overnight as it moved westward.
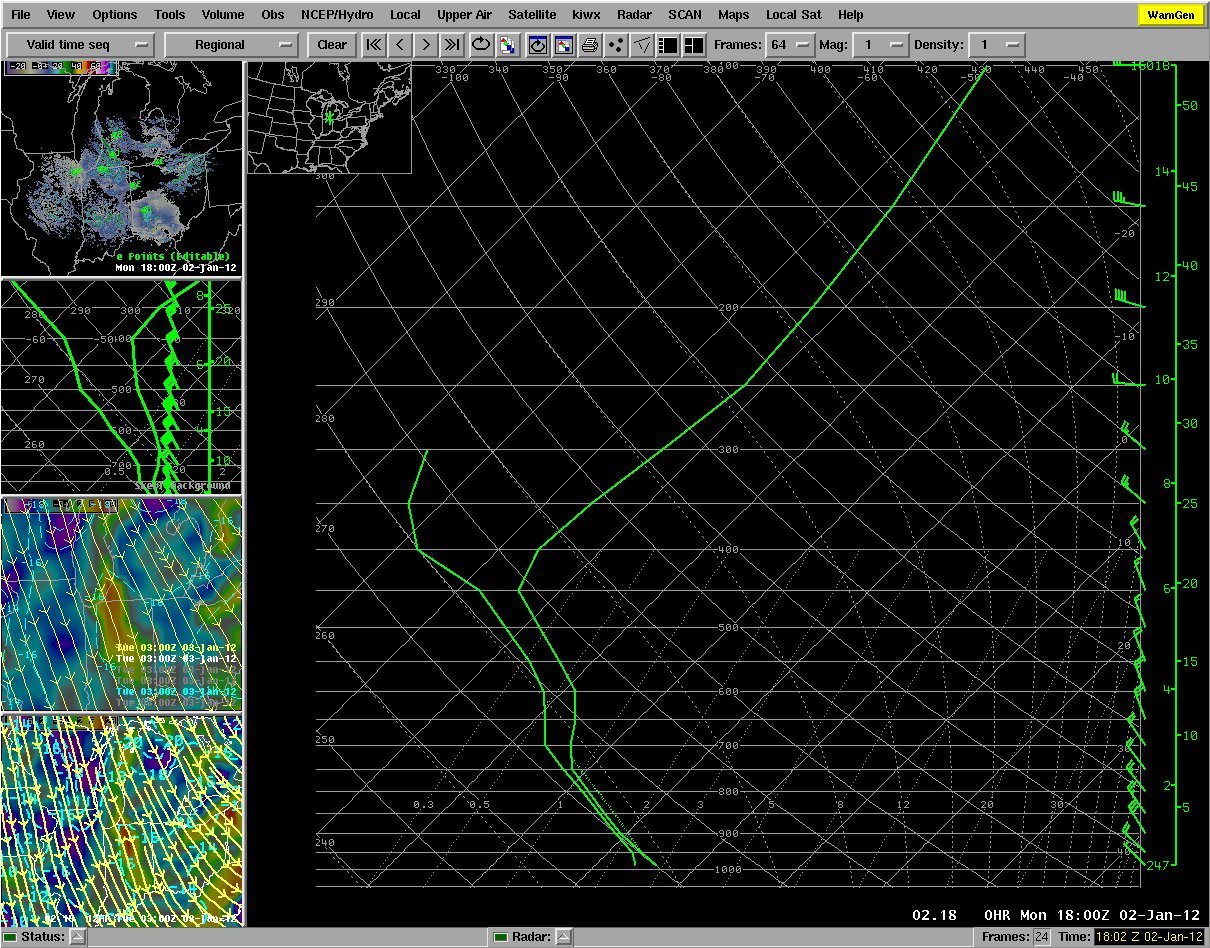
The above image is a RUC skew-T (vertical thermodynamic profile) sounding taken at a point between Kalamazoo, MI and South Bend, IN at 1pm on Monday, January 2, 2012. This diagram shows the temperature (red) and dewpoint (green) at each pressure level in the atmosphere. A few other important features on the diagram are also highlighted. The -10 and -20 degree Celsius lines are highlighted on the diagram in yellow, the purple line shows the 850 millibar level, and the light blue shaded area outlines the dendritic growth zone (-12*C to -20*C). Research has found that the most efficient snowflake growth occurs at temperatures between -12*C and -20*C. The center of the cloud layer was located near 850 millibars. The steep lapse rates in the cloud layer provided the instability needed for strong lake effect bands, because the quicker the temperature decreases with height, the more unstable the atmosphere becomes. In this diagram, the temperature profile decreases quite dramatically from the surface to near 750 millibars. Another important factor was the depth and saturation of the dendritic growth zone. In this case, the atmosphere was saturated in the dendritic growth zone for a depth greater than 100 millibars, which aided in efficient snowfall ratios near 23:1 (23 inches of snow would equal 1 inch of water equivalency).
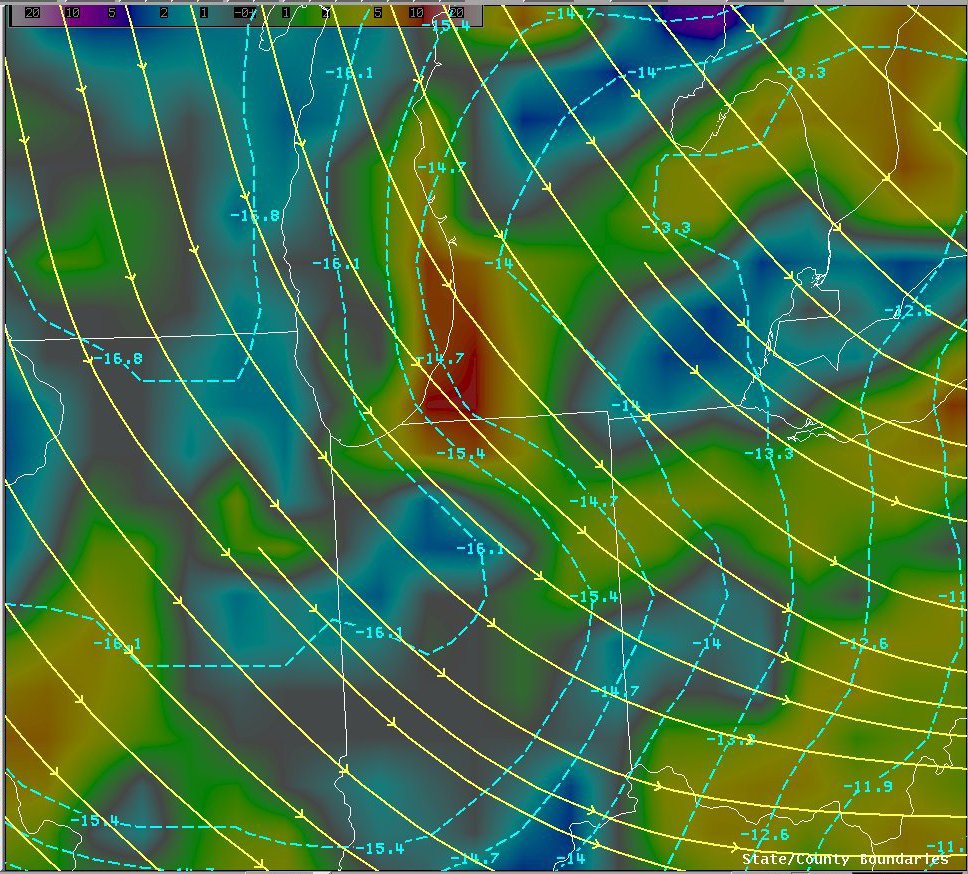
The above image is a RUC 850 millibar image of wind streamlines (yellow lines), temperatures (dashed light blue lines), and omega (colors) at 1pm on Monday, January 2, 2012. This image clearly shows the cold air aloft (approx. -16*C over the lake), northwest flow, and resulting upward motion (warmer colors). A typical rule for the formation of lake effect snow is a temperature difference between the lake surface and the 850 millibar level of 13*C. In this case, the Lake Michigan water surface temperature was near 4*C, which resulted in a temperature difference of 20*C. This large lake to 850 mb temperature difference produced unstable conditions downstream of the lake, which is indicated by the large, red-colored area of rising motion. This area of large omega values was co-located with the strongest lake effect band on radar (seen below). This band persisted for many hours and gradually moved southwest as winds turned more northerly. Snowfall rates were as high as 2 to 3 inches per hour within this band, but due to its transient nature, no one area saw these rates for an extended period of time.
Once the lake effect clouds cleared on Wednesday, the new blanket of lake effect snow could be seen clearly on the visible satellite picture. In the loop of GOES-East visible satellite images below, the clouds are moving southeastward while the area of snowfall, downwind of Lake Michigan, remains stationary. Also, temperatures throughout the day remained 5 to 10 degrees cooler in the area with a fresh snowpack. The high temperature at South Bend was 36 degrees while the temperature at Lafayette (with no snow cover) rose to 46 degrees! The melting snowpack can even be seen in the loop, as the southwestern edge of the snow pack retreats northeastward.
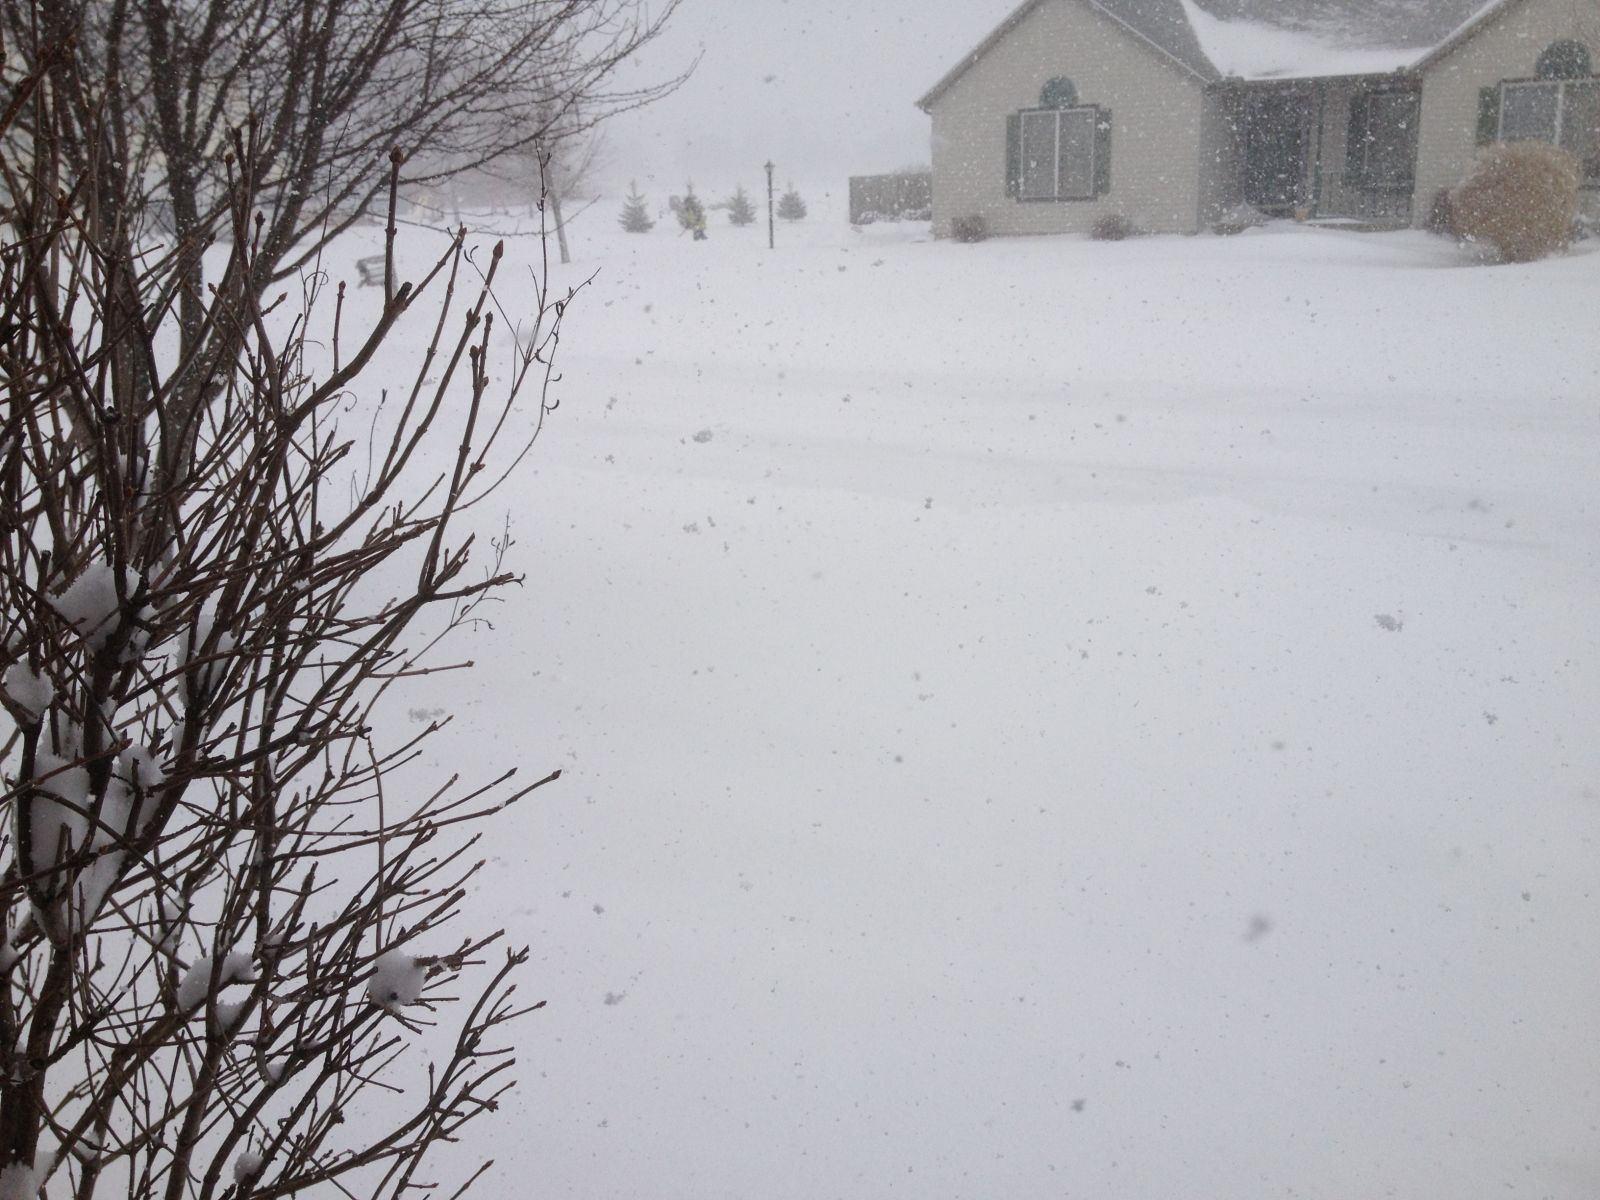
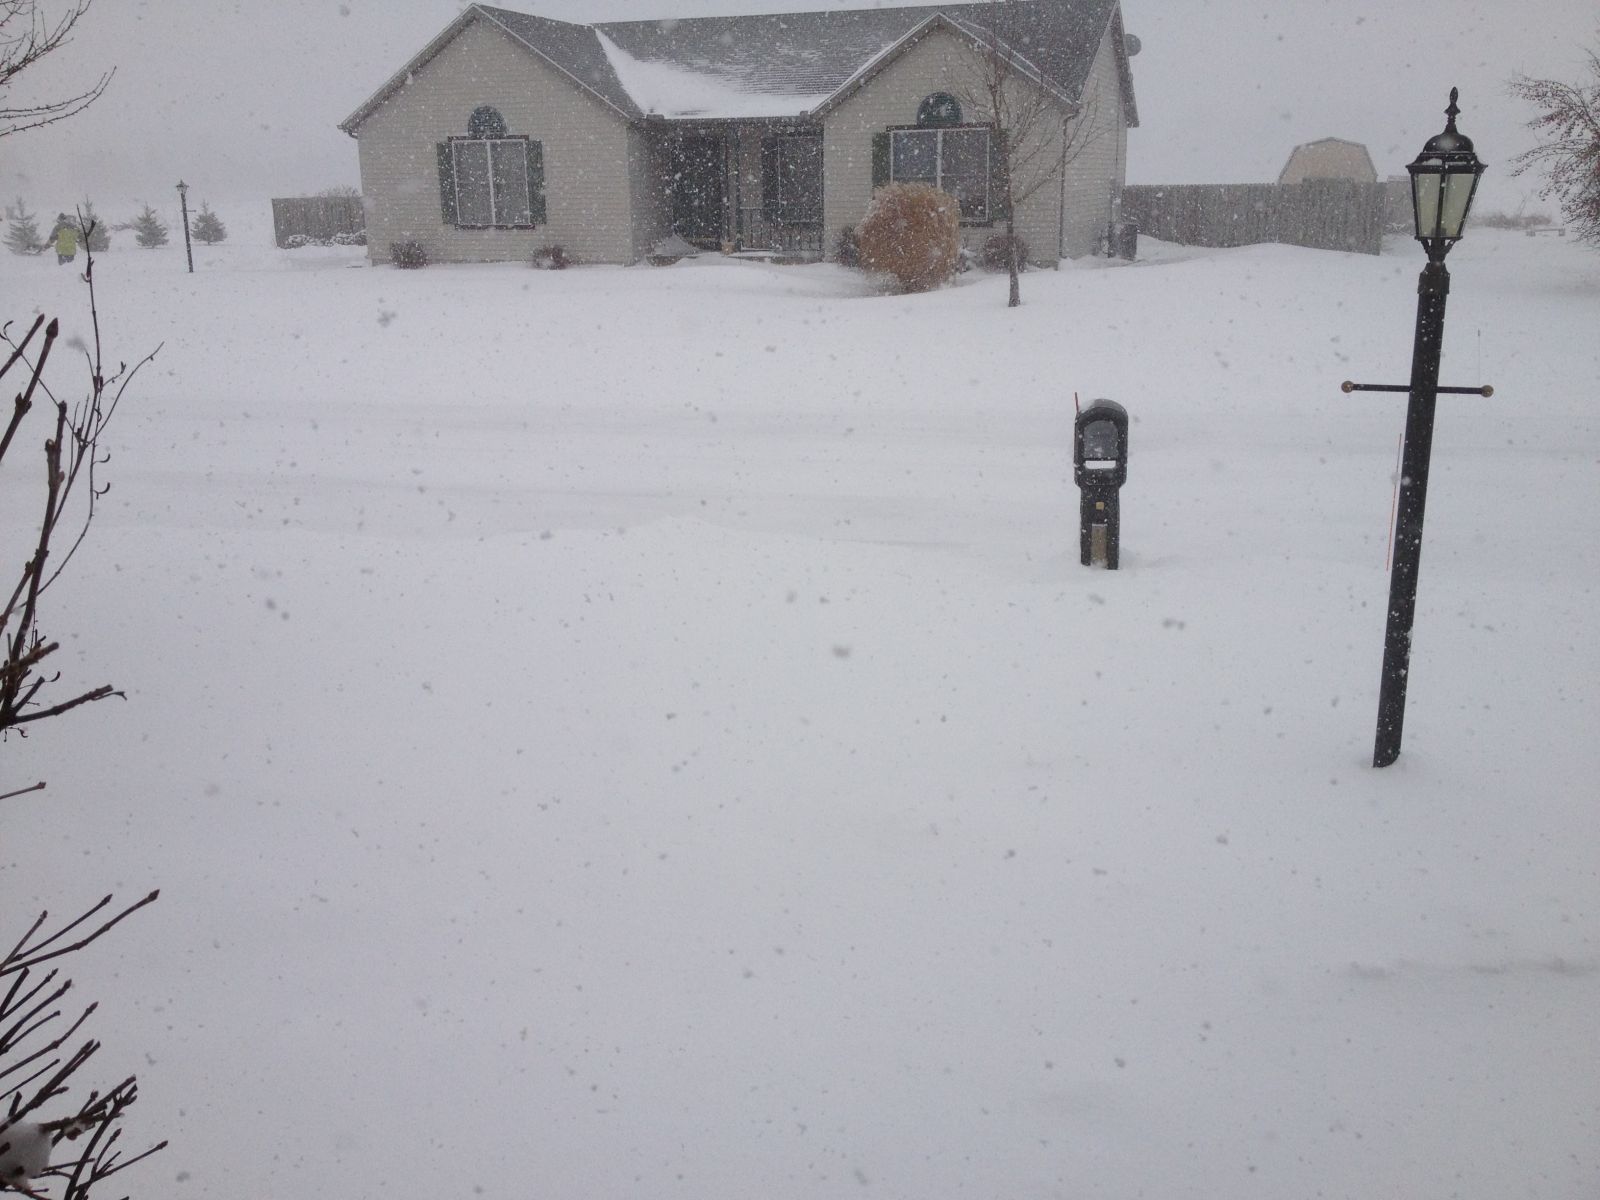
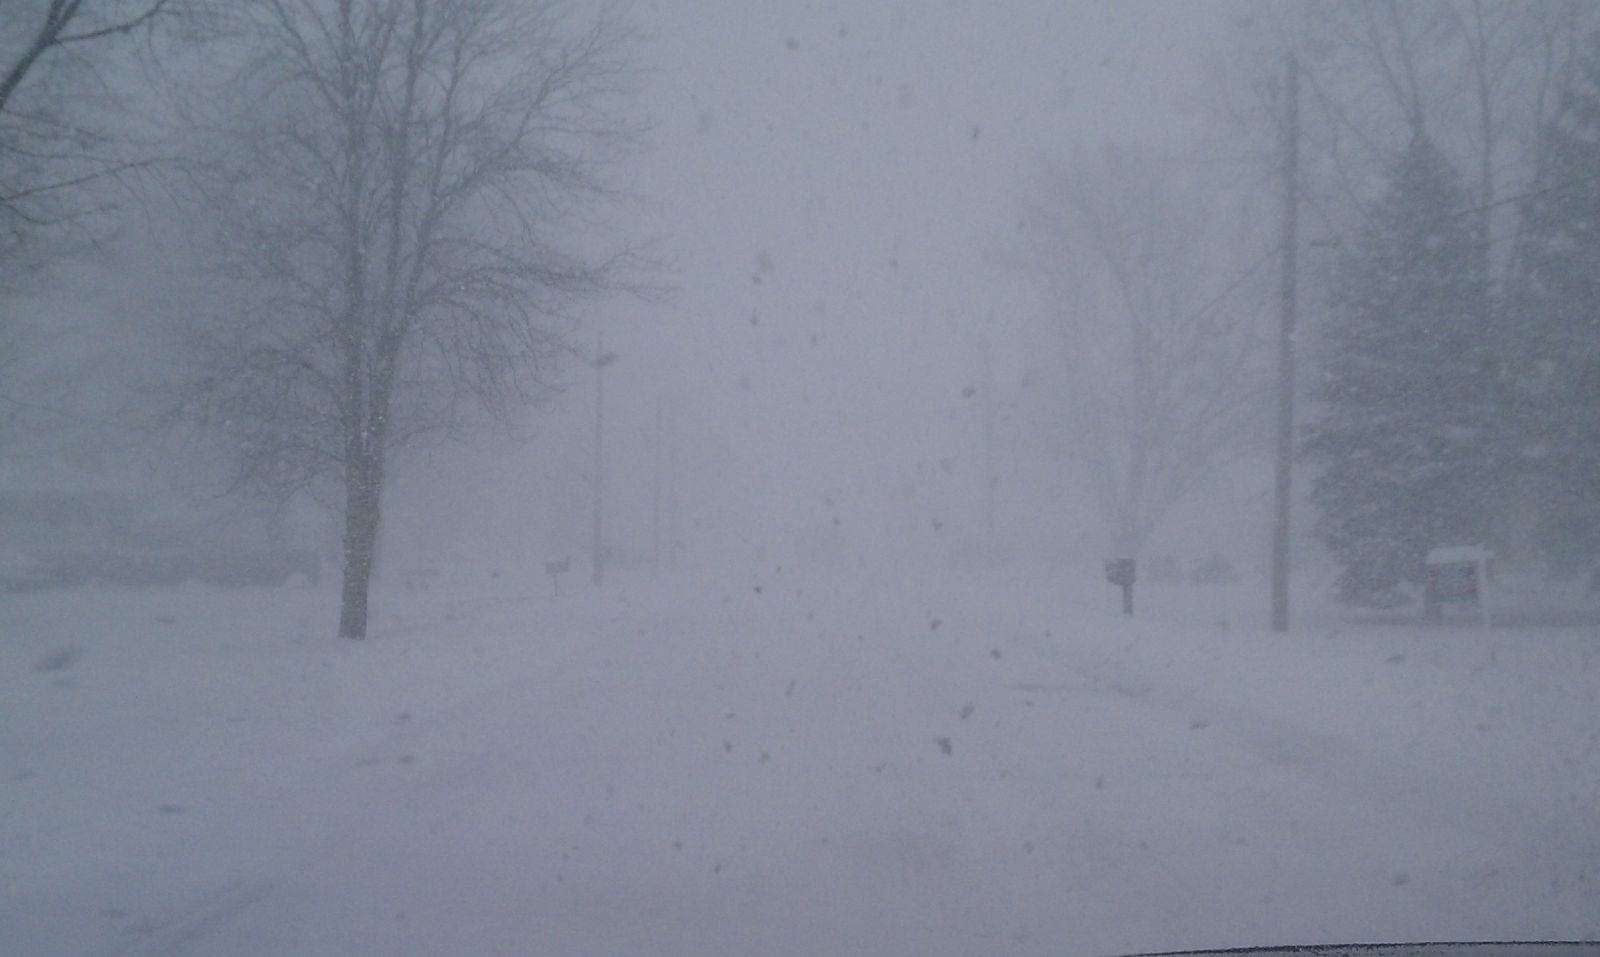
3 mi N of South Bend 3 mi N of South Bend 2 mi SW of Laporte
Photo by: Derek Warnke Photo by: Derek Warnke Photo by: Joe Vorrier
Here are some photos from the event. If you have any photos you would like to share, please send the photos and permission to use them to our email account at w-iwx.webmaster@noaa.gov. You can also post or view more photos on our Facebook page.
Bentley/Greenawalt

