June 29, 2012 Derecho Event

Photo of the shelf cloud that preceded the derecho in LaPorte, IN (courtesy of Kevin Gould)
On Friday afternoon, an intense, long-lived windstorm called a Derecho formed in northwest Indiana and began carving a path of destruction over 600 miles long. Winds approaching 100 miles per hour were reported during the most intense part of the event (between Fort Wayne, IN and Columbus, OH.) At the peak of the event, the Fort Wayne International Airport observing equipment observed a peak wind gust of 91 mph, and the observer reported seeing a downburst descend from the cloud directly ahead of him. Winds were as strong as an EF-1 tornado over a widespread area which resulted in immense damage along the storm's entire path. Given the magnitude of the damage involved with this event and the subsequent extreme heat across much of the eastern United States, a Service Assessment was complied. This assessment can be viewed by clicking this link
What is a Derecho?
According to the Storm Prediction Center, "A Derecho (pronounced similar to "deh-REY-cho" in English) is a widespread, long-lived wind storm that is associated with a band of rapidly moving showers or thunderstorms. Although a Derecho can produce destruction similar to that of tornadoes, the damage typically is directed in one direction along a relatively straight swath. As a result, the term "straight-line wind damage" sometimes is used to describe Derecho damage. By definition, if the wind damage swath extends more than 240 miles (about 400 kilometers) and includes wind gusts of at least 58 mph (93 km/h) or greater along most of its length, then the event may be classified as a Derecho.
To learn more about how a Derecho forms, you can visit this link: About Derechos
Synoptic/Mesoscale Environment
By early afternoon on Friday, a stationary cold front was draped across the southern Great Lakes. The boundary separated a dry stable airmass to the north and a moist/unstable airmass to the south. The unstable airmass to the south was characterized by temperatures near 100 degrees and dewpoints in the low to middle 70s. This hot/moist surface environment, coupled with mid-level lapse rates between 8.5 and 9 oC/km led to surface based CAPE values of 6000+ J/kg.
The following image displays the surface based instability (CAPE) in colors and green lines, the surface station observations in orange, and the approximate location of the stalled front in cyan at 2:00 pm Friday.
Storms initially developed across Northern Illinois during the late morning hours. As these storms continued to grow, the balance between shear and buoyancy created an ideal environment for cold-pool formation and the development of a forward propagating MCS. As this MCS developed into a bowing line of storm and eventually a Derecho, it continued to follow along the instability gradient which is a common occurence in this environment. The storms also continued to form southeast as the system built towards the instability.
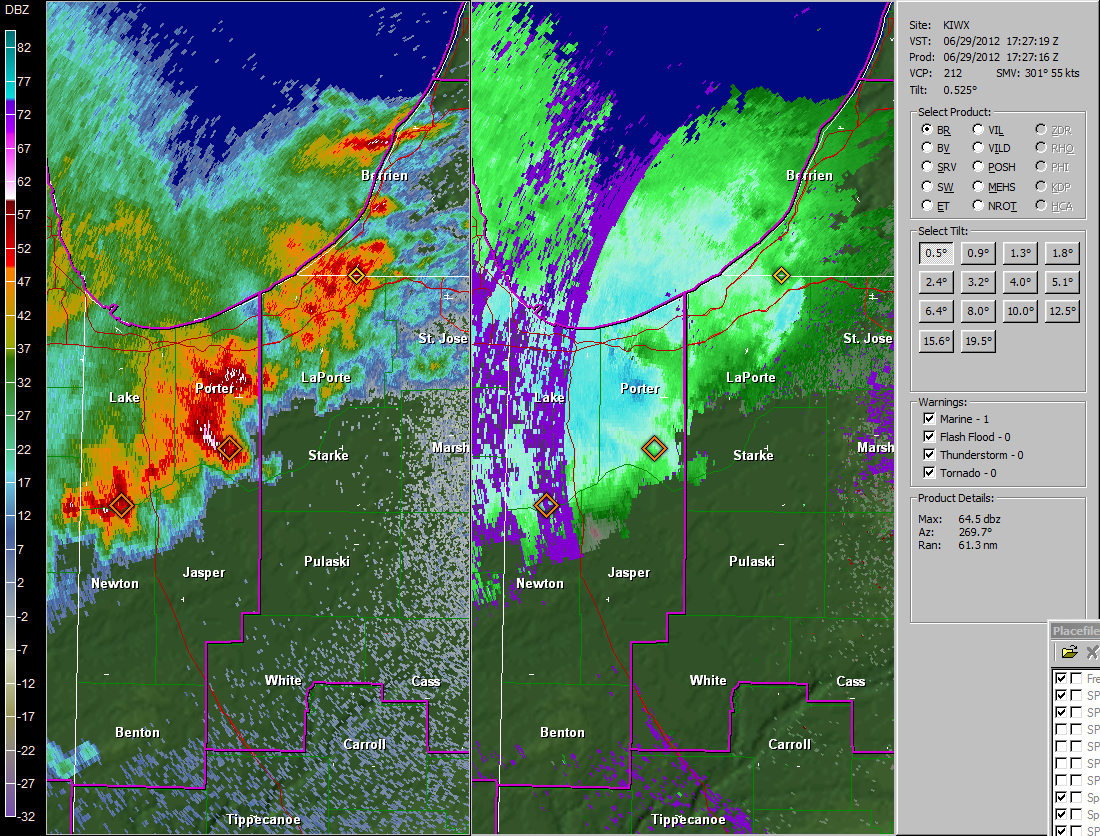
This first radar capture shows the storms as they first entered our area. The radar is sampling these storms at 3500 feet west of South Bend where there is 60 knots of inbound velocity (green.)
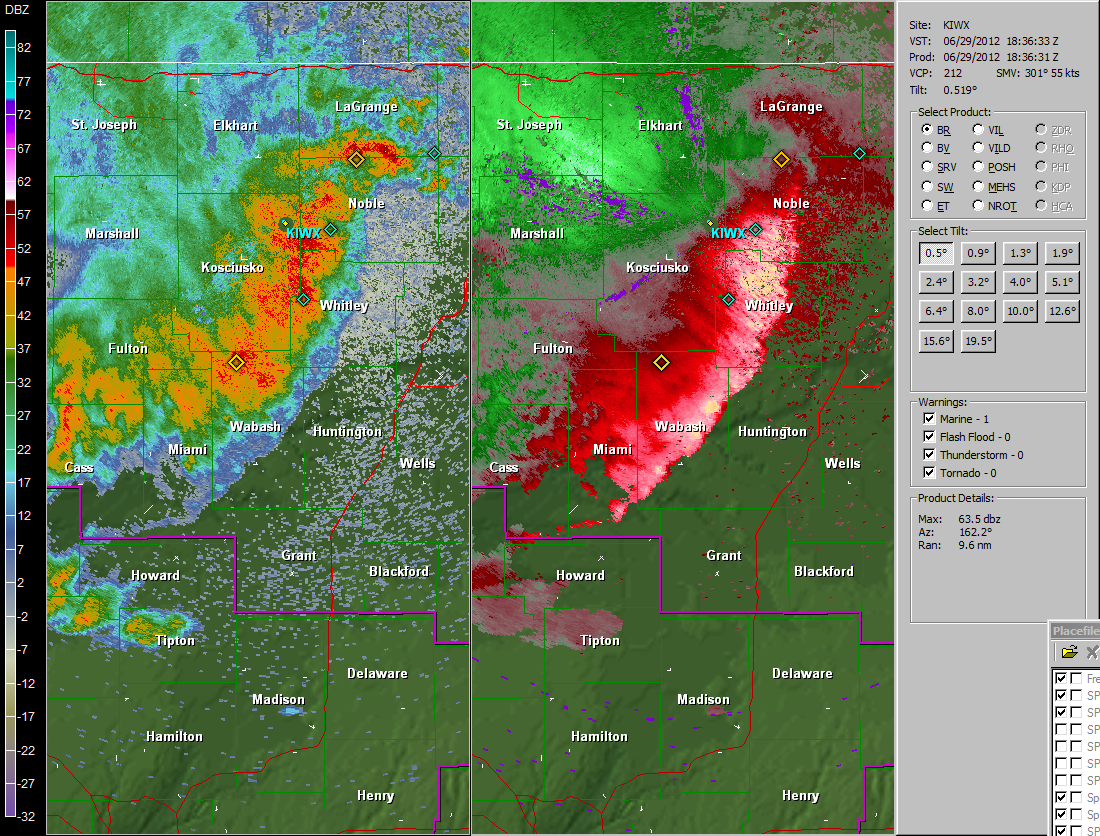
This second radar capture shows the storms after they congealed into a bowing line segment. Estimated 70 to 75 mph winds were being reported in Whitley County at this time.
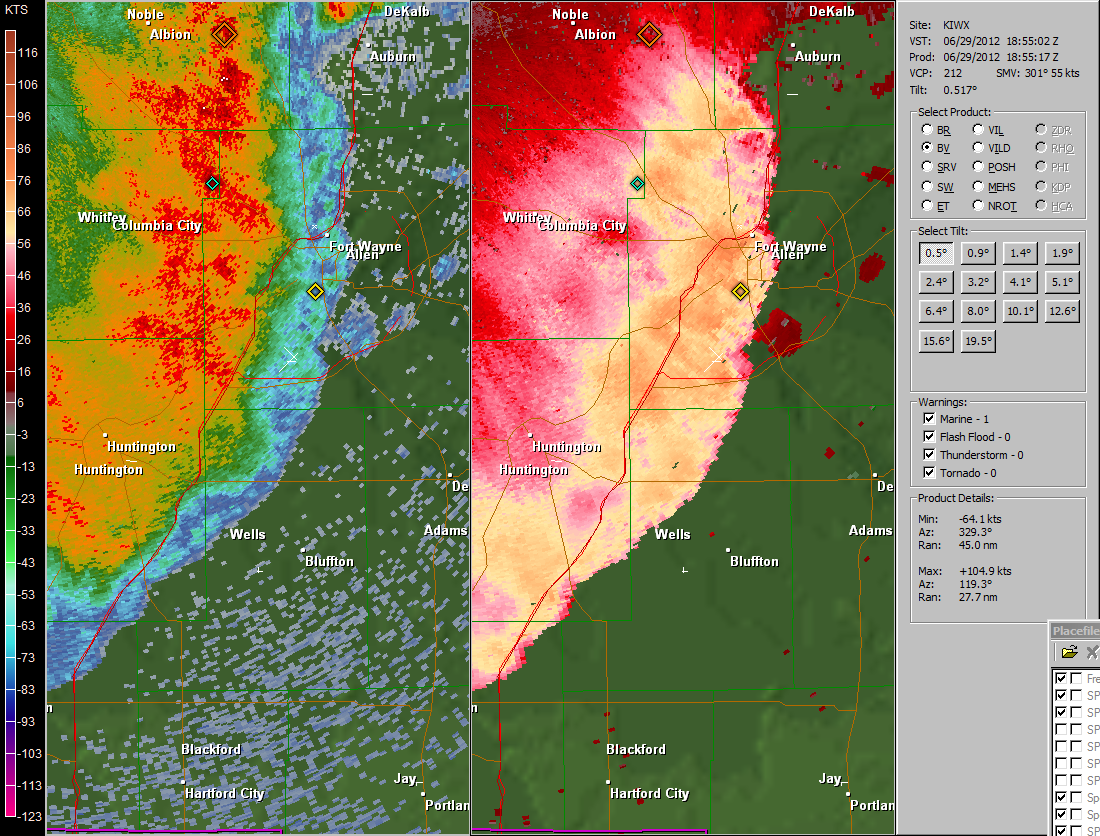
The storm continued to intensify as it moved through the Fort Wayne metro area, with widespread winds of 80-90 mph. Outbound velocities measured by the radar were 90 knots around 2500 feet above the surface as the airport reported a 78 knot (91 mph) wind gust. This indicates that the system was very efficient at mixing strong winds aloft down to the surface.
The National Weather Service office in Wilmington, Ohio released a weather balloon around 2:00 pm ahead of the storms to get an accurate sample of the thermodynamic environment ahead of them. The sounding can be seen below.
Surface based CAPE (Convective Available Potential Energy) was over 6000 J/kg and the lifted index was -15! Both of these variables indicate that the environment was characterized by extreme instability! The CIN (Convective Inhibition) which had hindered convection earlier in the day is almost completely gone by this point and the environment is primed for intense convection.
0-6 km vertical shear is a parameter commonly used to examine the ability for a storm to sustain itself in an environment and typically a storm needs 30 knots of shear to organize. This sounding shows 36 knots of 0-6 km shear, and this sounding was taken over 100 miles south of our area. The deep layer shear was closer to the 40 to 45 knot range in our area which also aided in the organization of the derecho.
A composite parameter that is used to diagnose the probability of a line of storms organizing into a derecho is called the “Derecho composite parameter.” The image below shows the values of the Derecho composite parameter at 2:00 pm Friday.
Values greater than 4 are sufficient for derecho development, and in this case values of 8 to 12 are more than significant for Derecho development.
Once a mesoscale convective system (MCS) develops, a common parameter to analyze is the MCS maintenance parameter. This parameter uses many variables to analyze whether an MCS which has already formed will maintain itself. In the image capture below, the probability was over 90% and indeed this Derecho maintained itself all the way to the Atlantic Ocean!
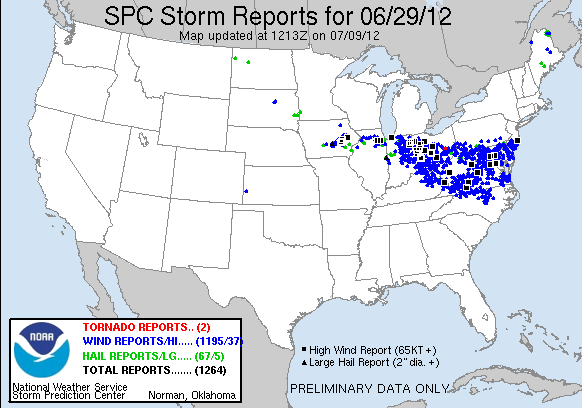
See the google maps version of this map here.
Each of the blue dots on this map represent an area where there was a local storm report of severe wind speed (over 58 mph) or thunderstorm wind damage. The black squares represent measured wind gusts of greater than 65 knots. The swath of damage from the derecho began in north central Indiana and traveled all the way to the east coast
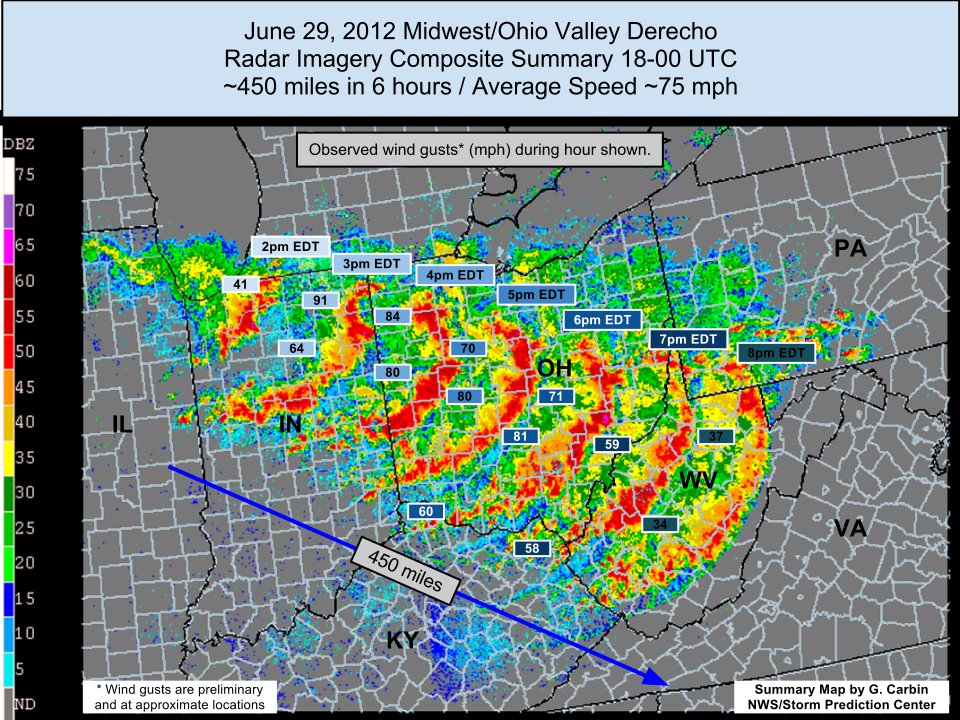
This image, compiled by the Storm Prediction Center and shared on their Facebook page, shows the location of the Derecho through time based on radar, and a few reported maximum wind speeds during each hour.
Here is a list of the highest measured wind gusts throughout the event:
91 mph - Fort Wayne Airport
88 mph - 5 NE Fort Wayne
87 mph - Scott, OH
84 mph - Paulding, OH
78 mph - Columbus Grove, OH
76 mph - 2 WSW Antwerp, OH
73 mph - Napoleon, OH
72 mph - 1 SW New Haven, IN
65 mph - 5 SSW Leo-Cedarville, IN
65 mph - 2 E Decatur, IN
64 mph - Columbia City, IN
64 mph - 1 W Marion, IN
64 mph - 3 NNW Convoy, OH
64 mph - 3 SE New Bavaria, OH
63 mph - 3 E Saint Johns, IN
62 mph - 4 NW South Bend, IN
61 mph - 4 SE Goshen, IN
60 mph - 2 NE Wabash, IN
59 mph - 2 WNW Convoy, OH
58 mph - Gas City, IN
58 mph - 2 SE Bluffton, IN
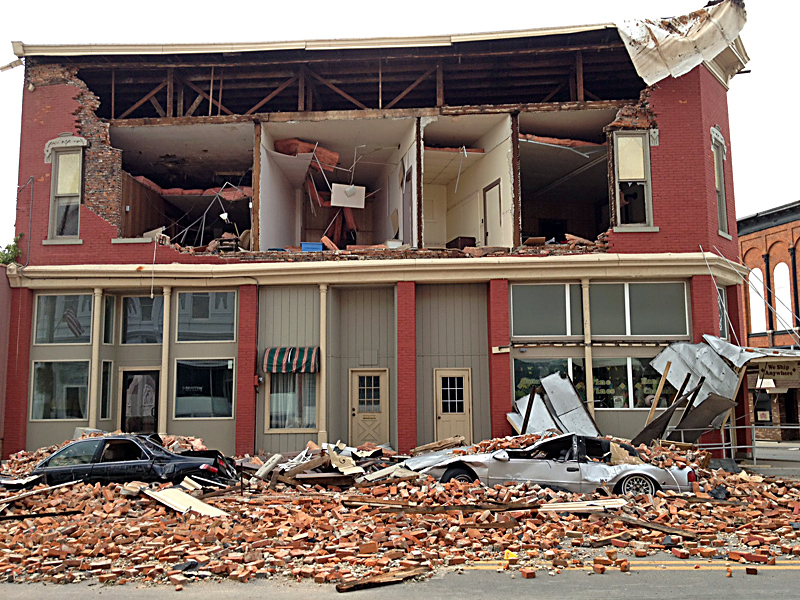
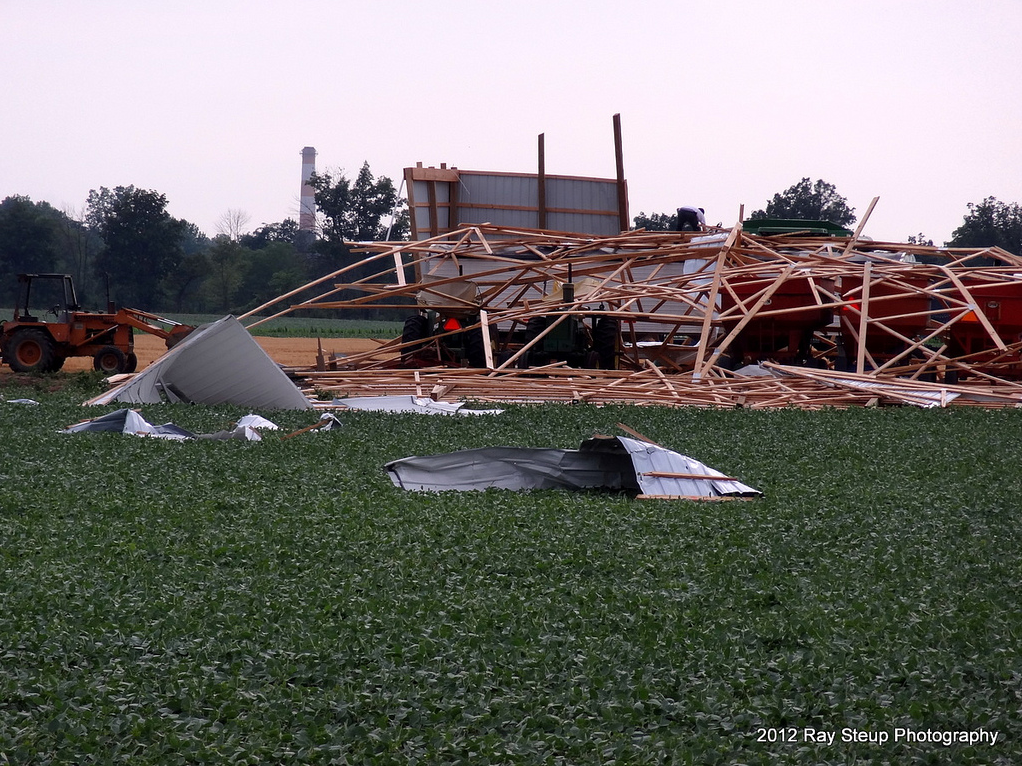
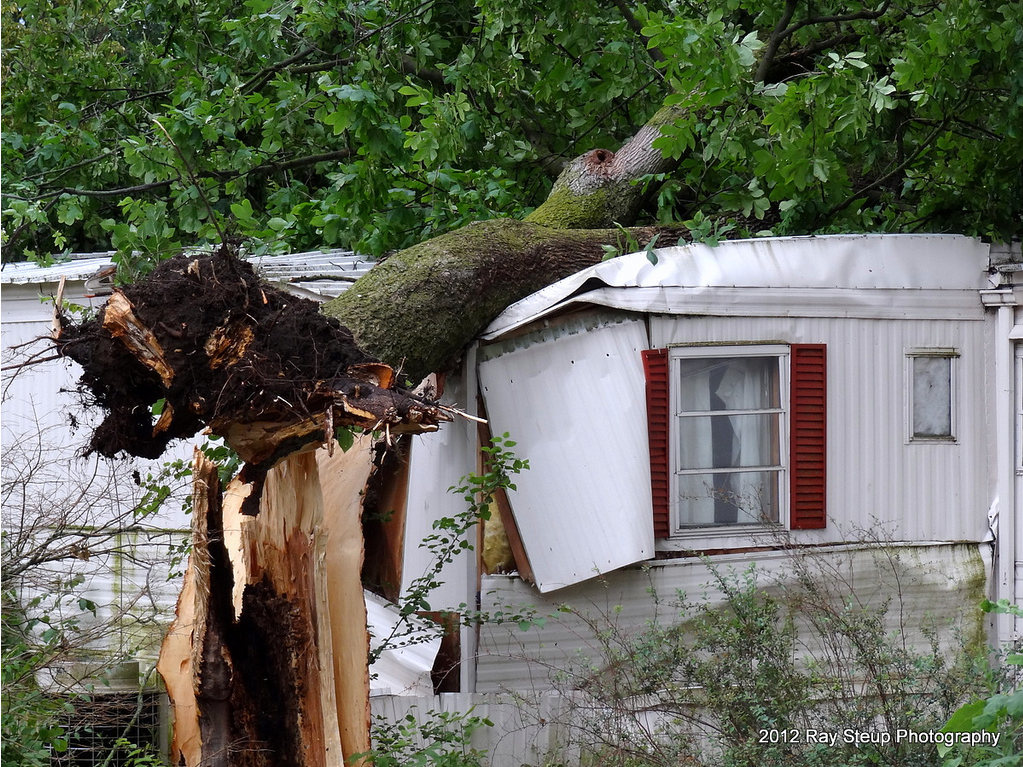
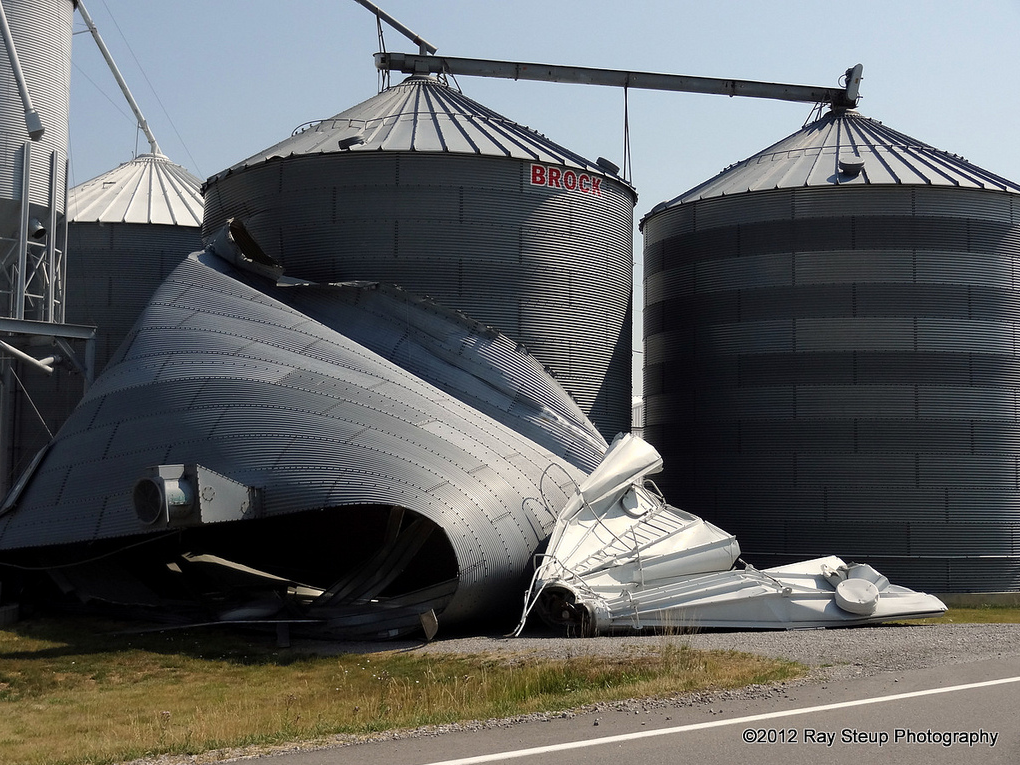
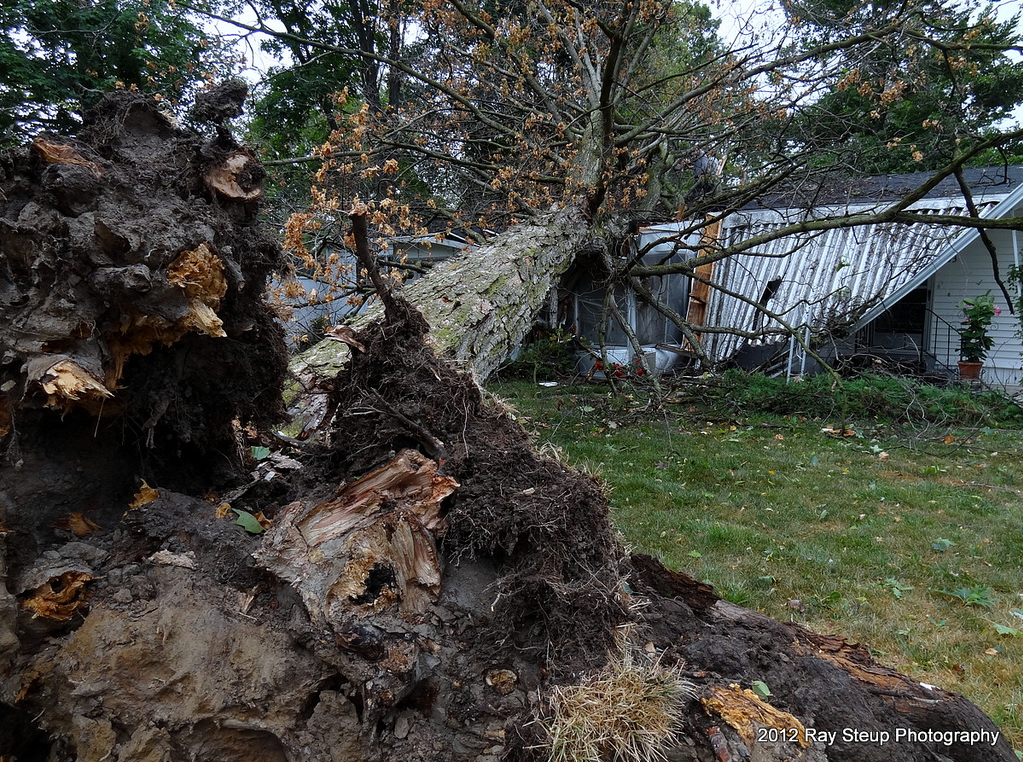
Pictures
 |
 |
 |
 |
 |
 |
Thanks to all spotters, media, emergency managers and other partners for their reports throughout this significant and historical storm event!
Bentley/NG/TH/LF
Update 02/18/2013 10:50 am for addition of Service Assessment

