Overview
Several lines of showers and thunderstorms developed ahead of a cold front. Pockets of wind damage were noted across portions of the area, with evidence of 3 tornadoes found within damage areas in Wabash, Noble and White counties in Indiana.Tornadoes:
|
Tornado 1- Wabash, Indiana
Track Map 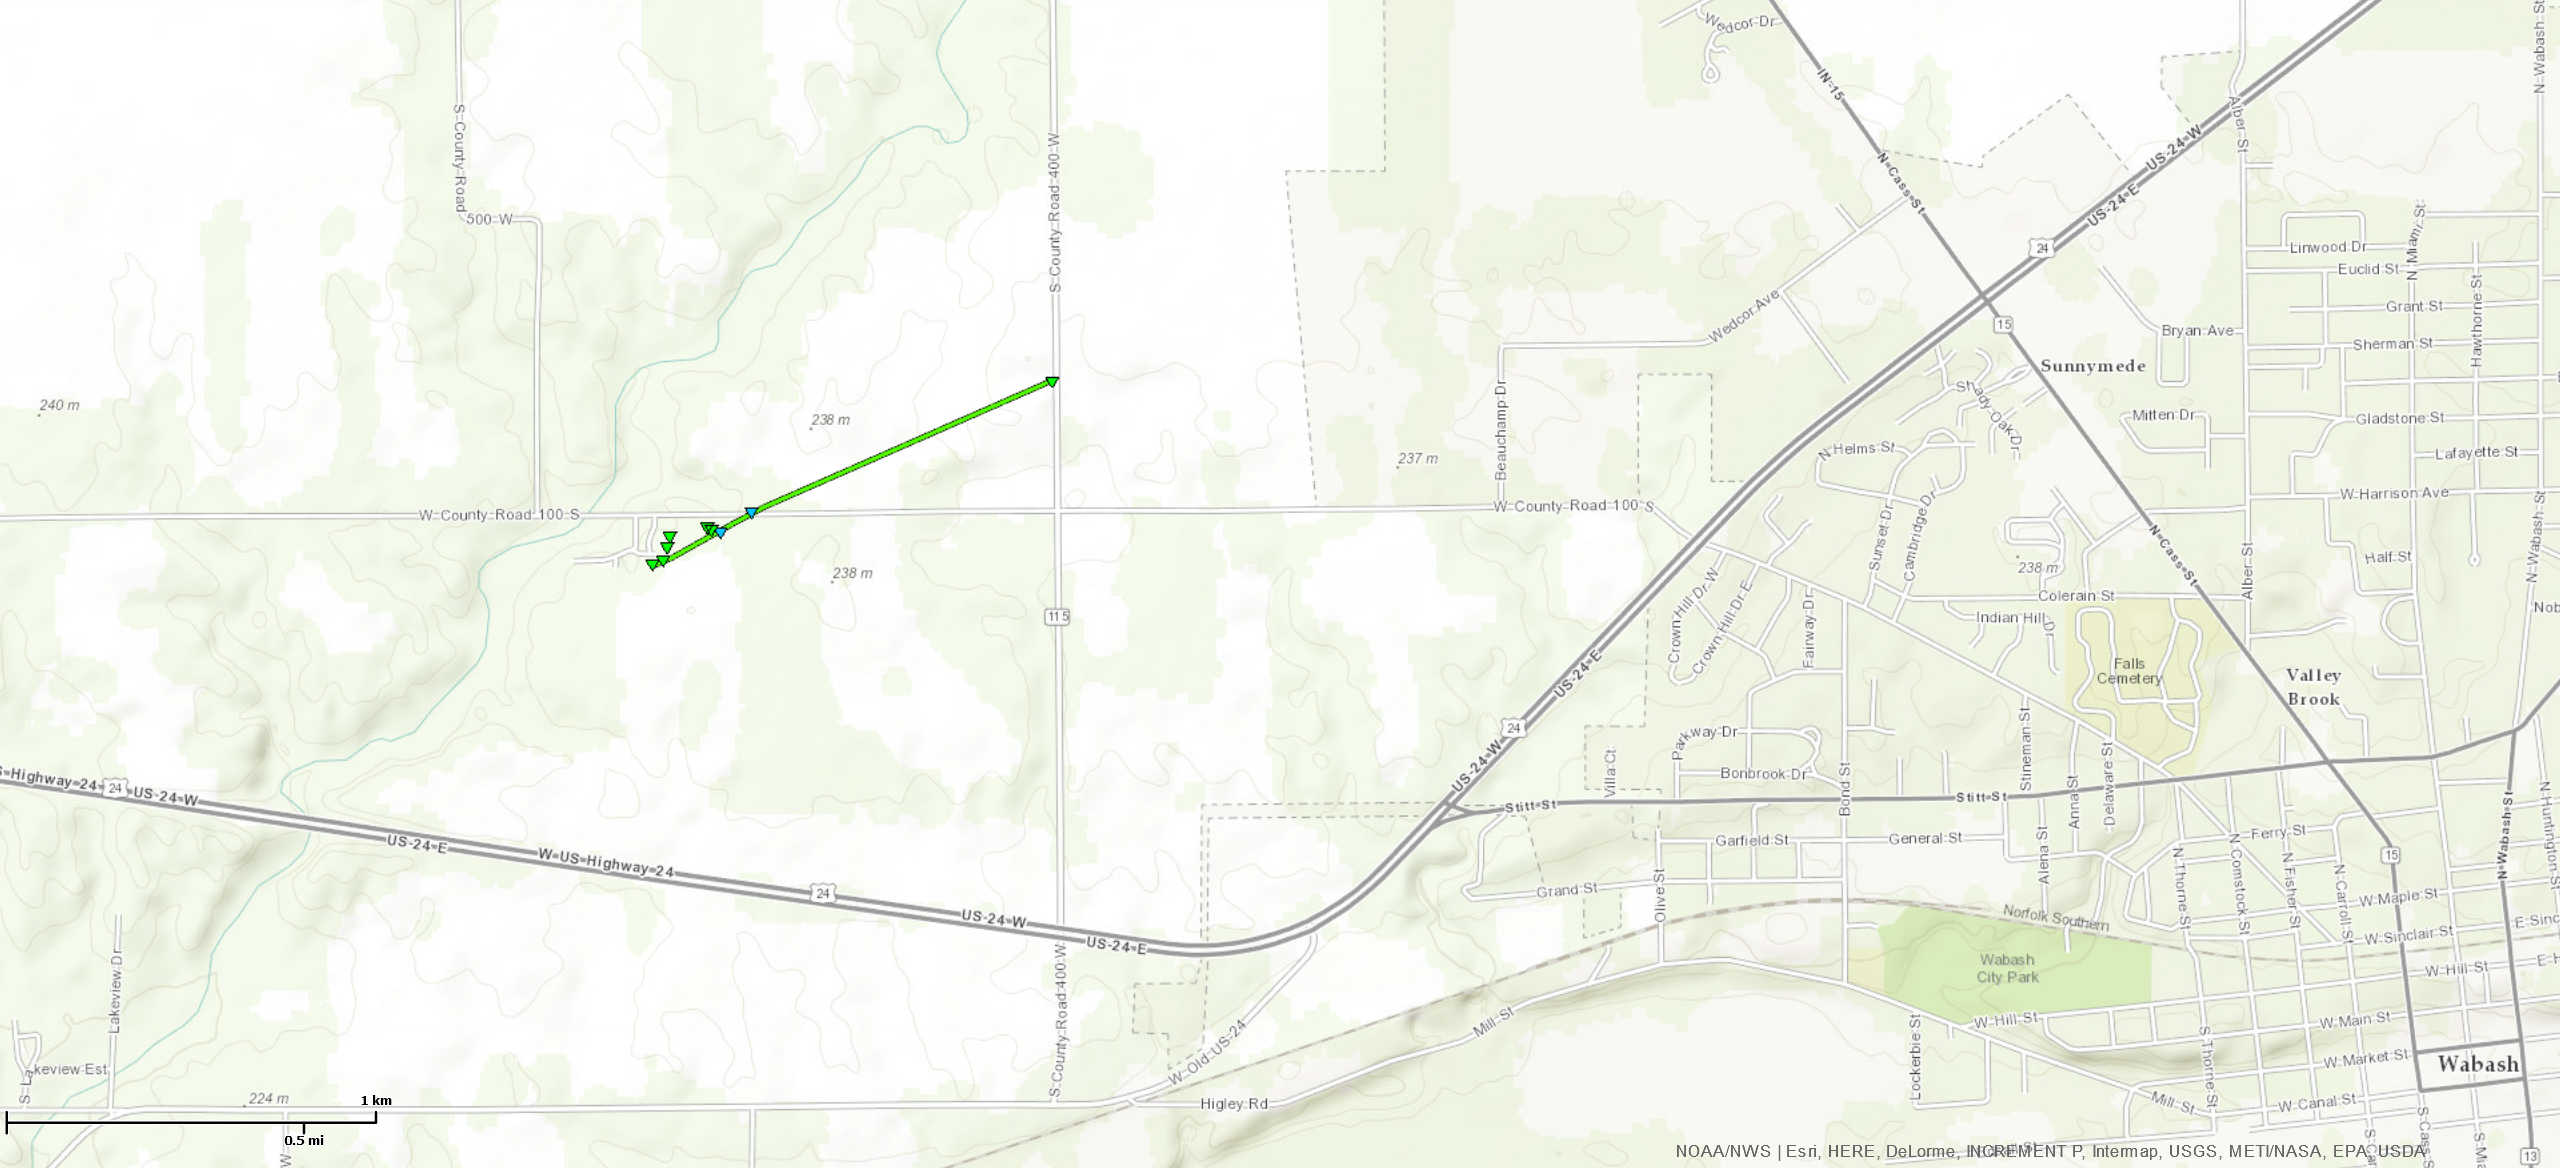 
Downloadable KMZ File |
||||||||||||||||
|
Tornado 2- Albion, Indiana
Track Map 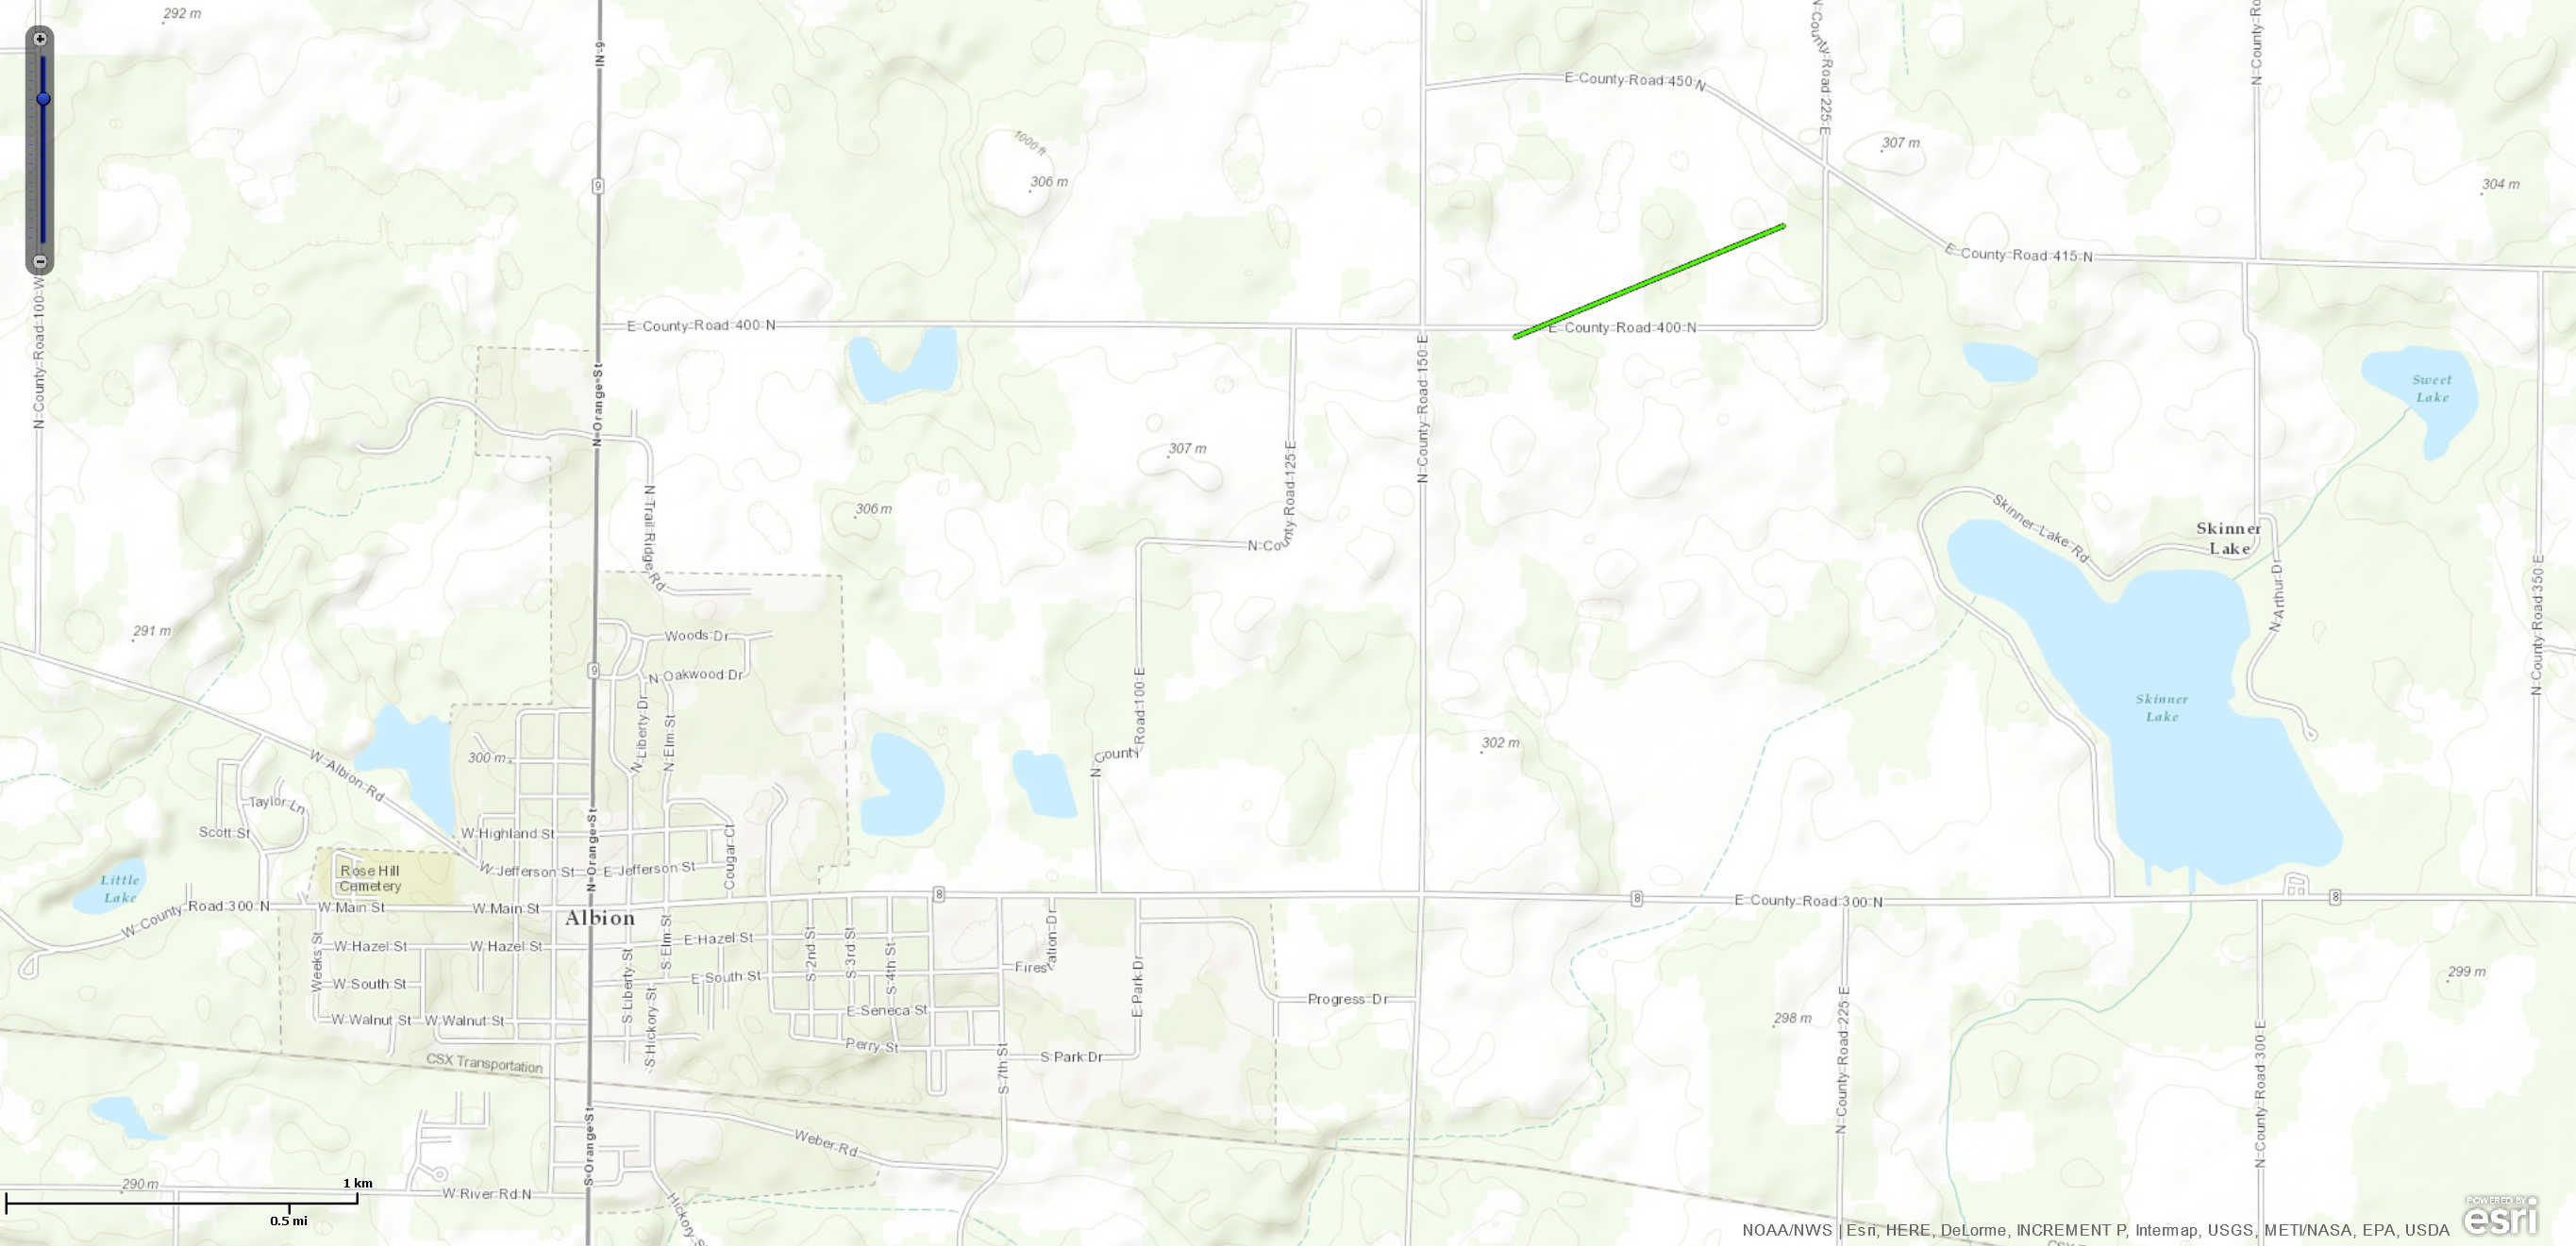
Downloadable KMZ File |
||||||||||||||||
|
Tornado 3- Wolcott, Indiana
Track Map 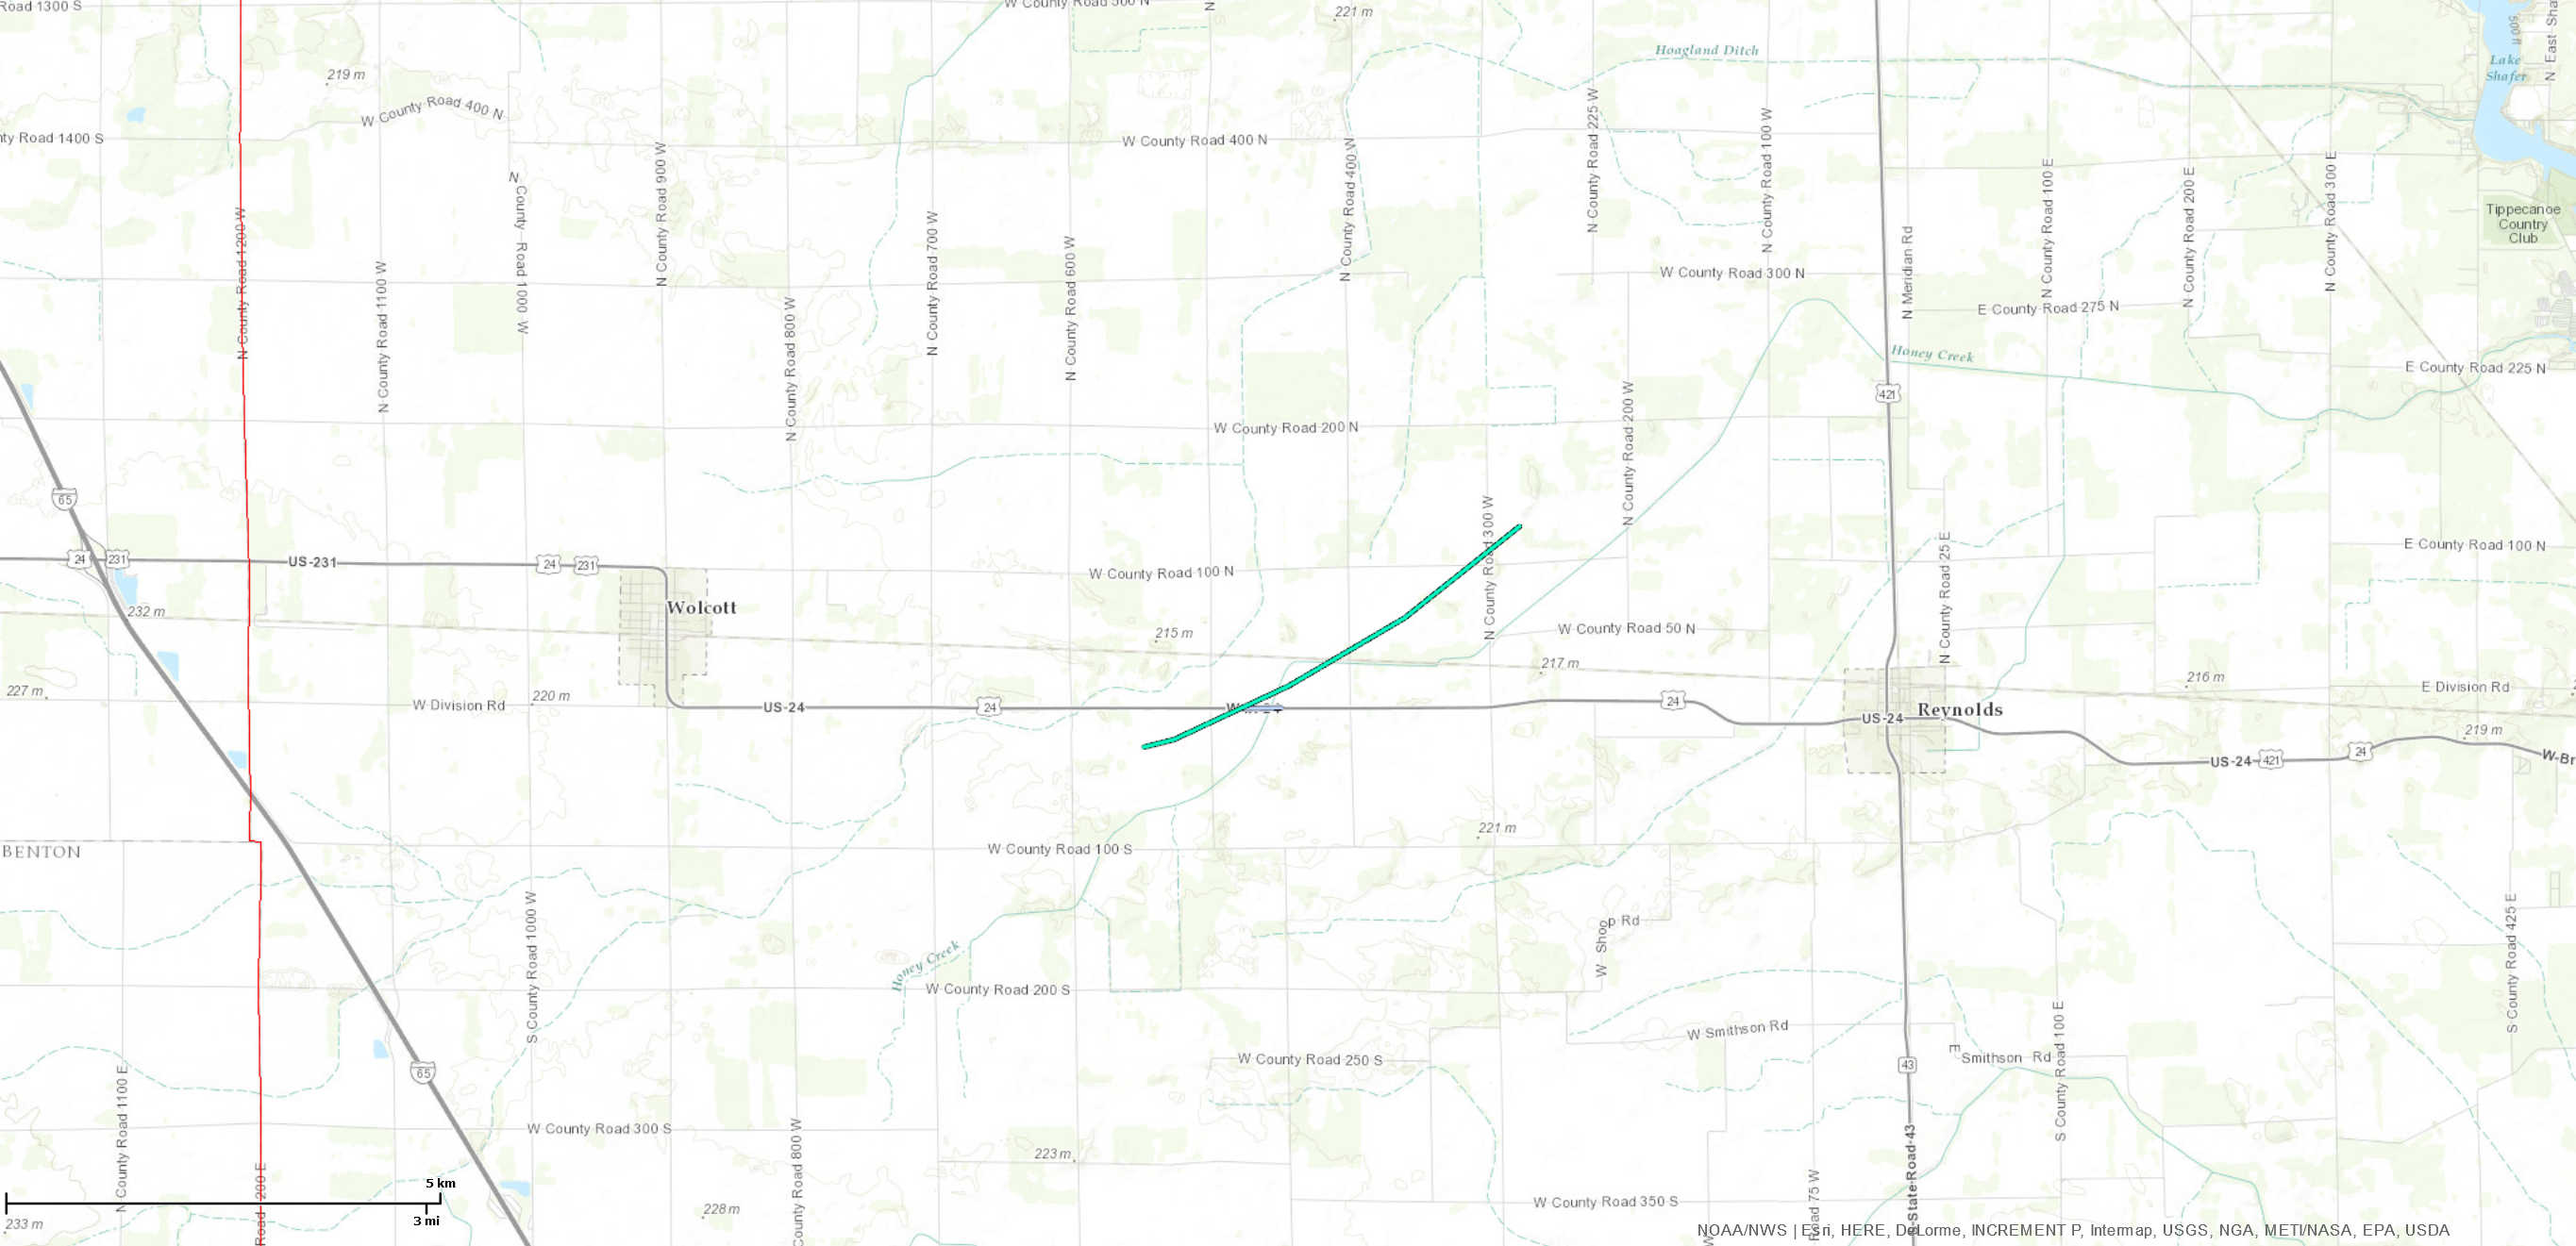
Downloadable KMZ File |
||||||||||||||||
The Enhanced Fujita (EF) Scale classifies tornadoes into the following categories:
| EF0 Weak 65-85 mph |
EF1 Moderate 86-110 mph |
EF2 Significant 111-135 mph |
EF3 Severe 136-165 mph |
EF4 Extreme 166-200 mph |
EF5 Catastrophic 200+ mph |
 |
|||||
Photos & Video:
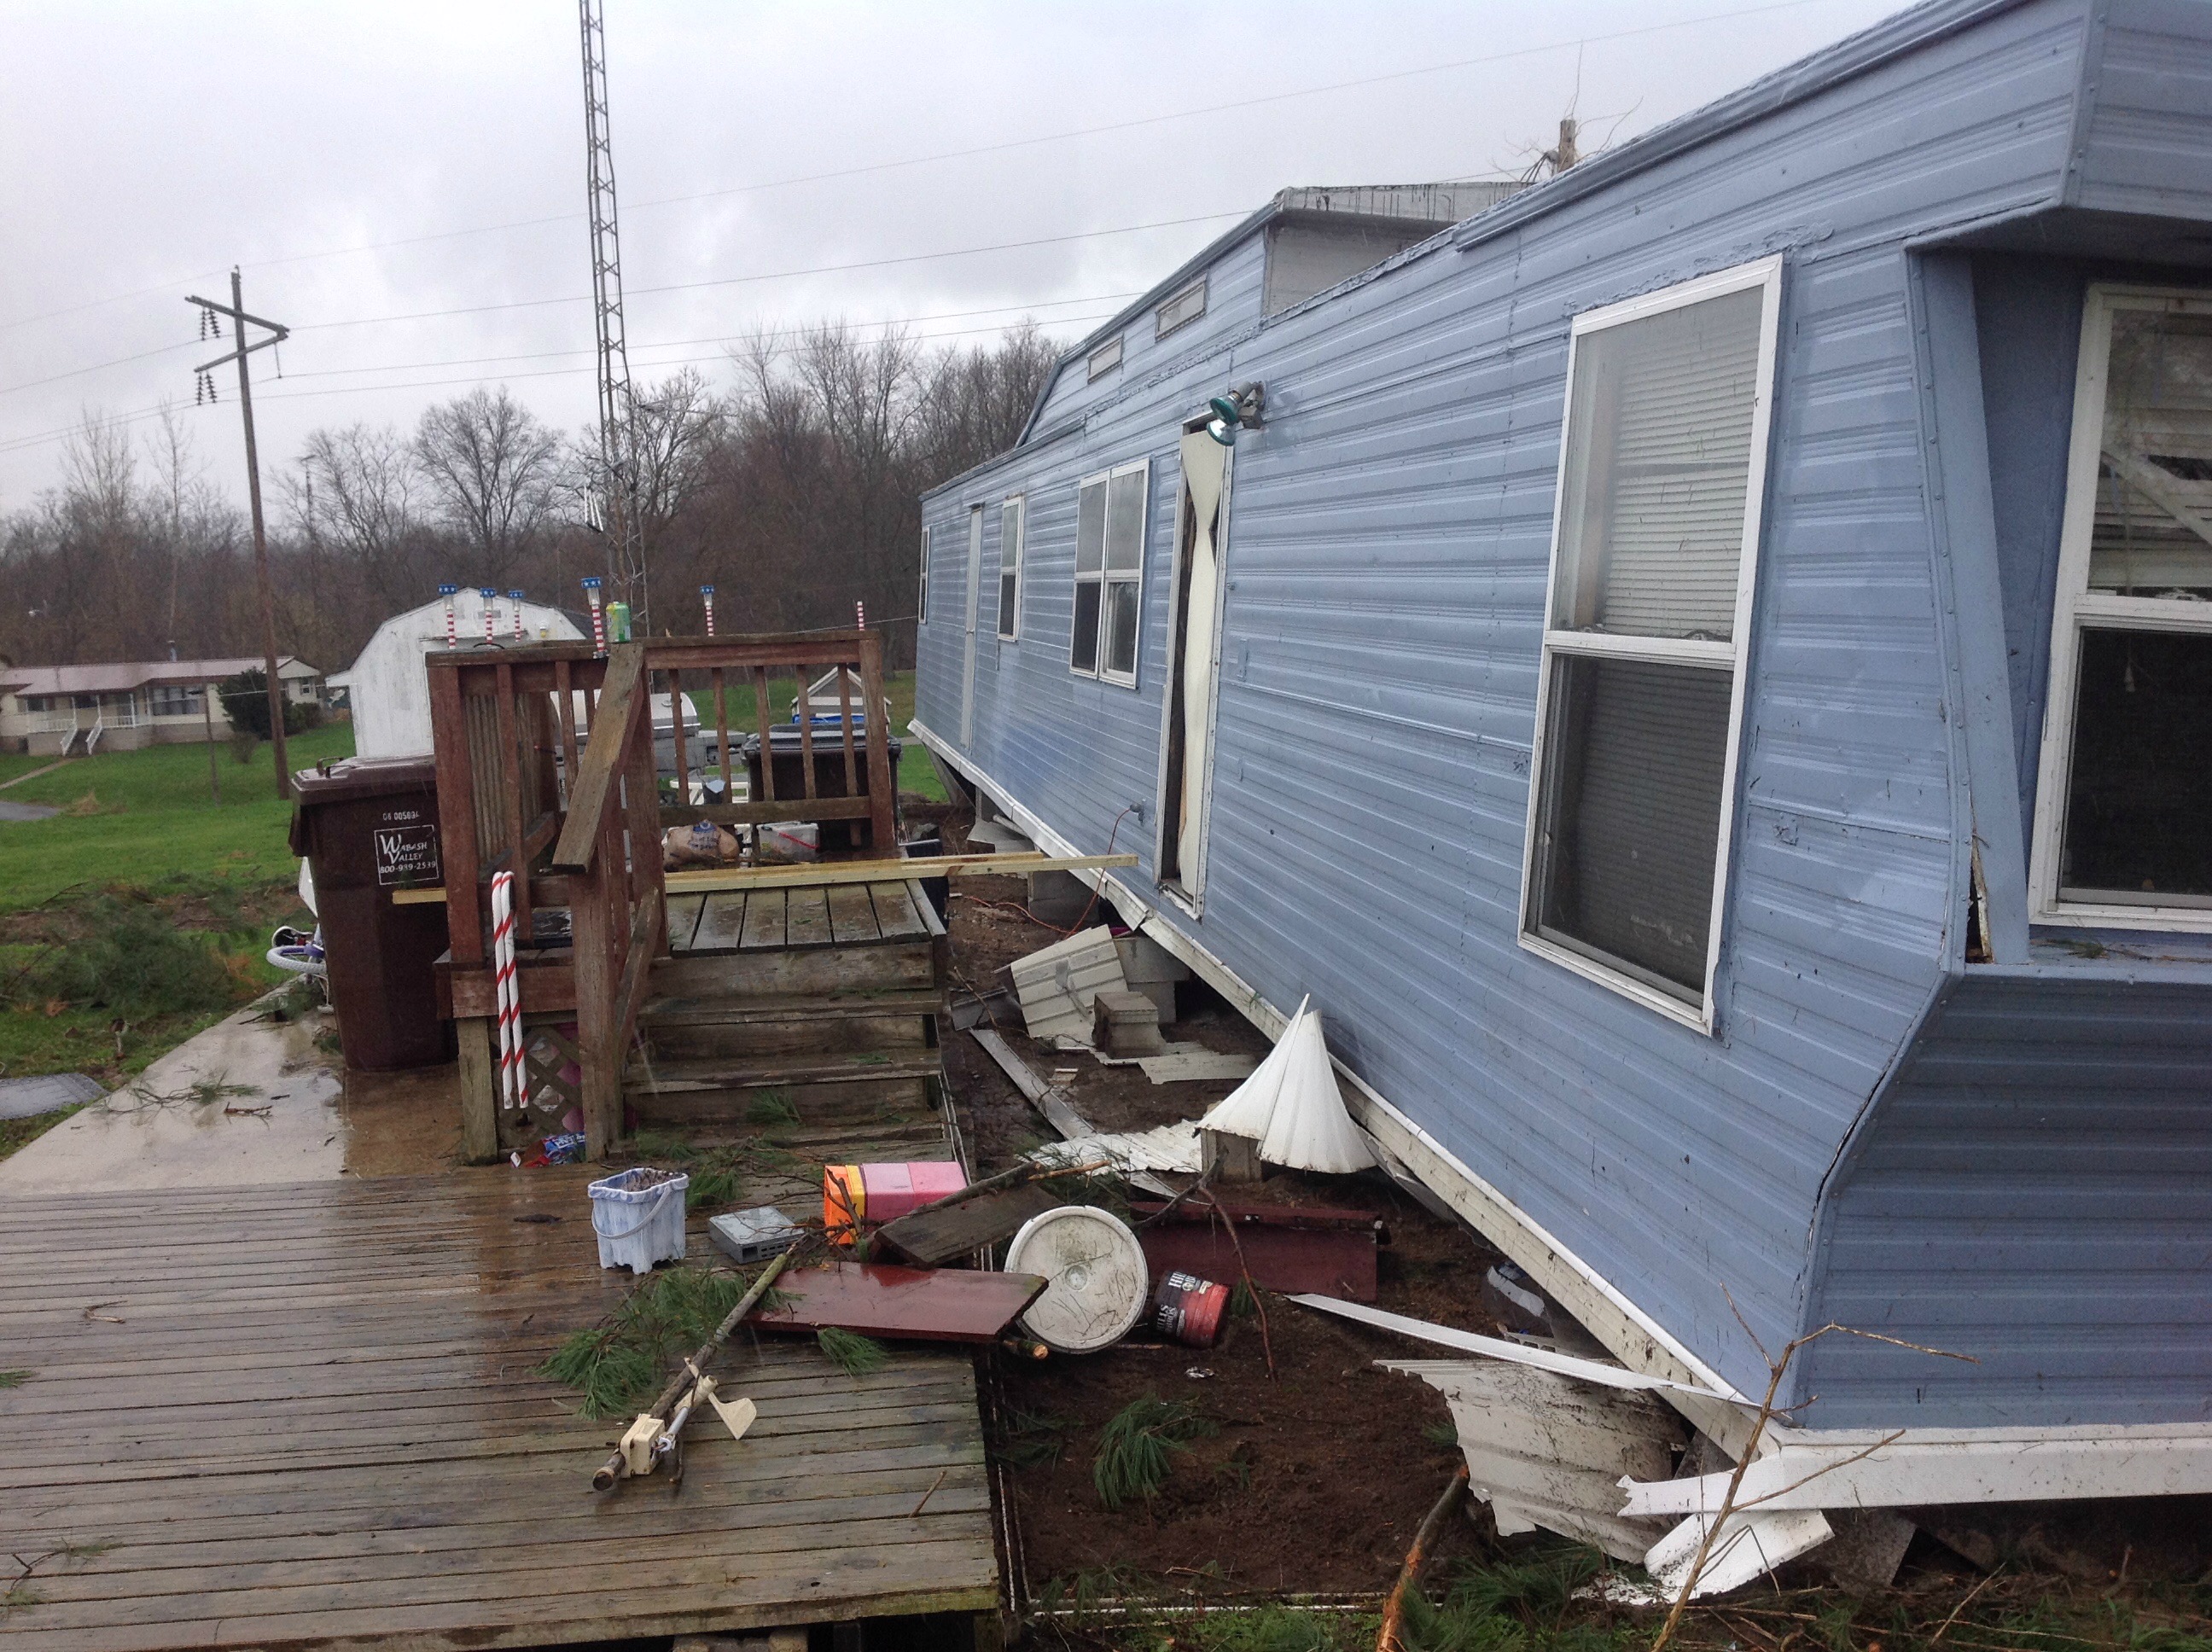
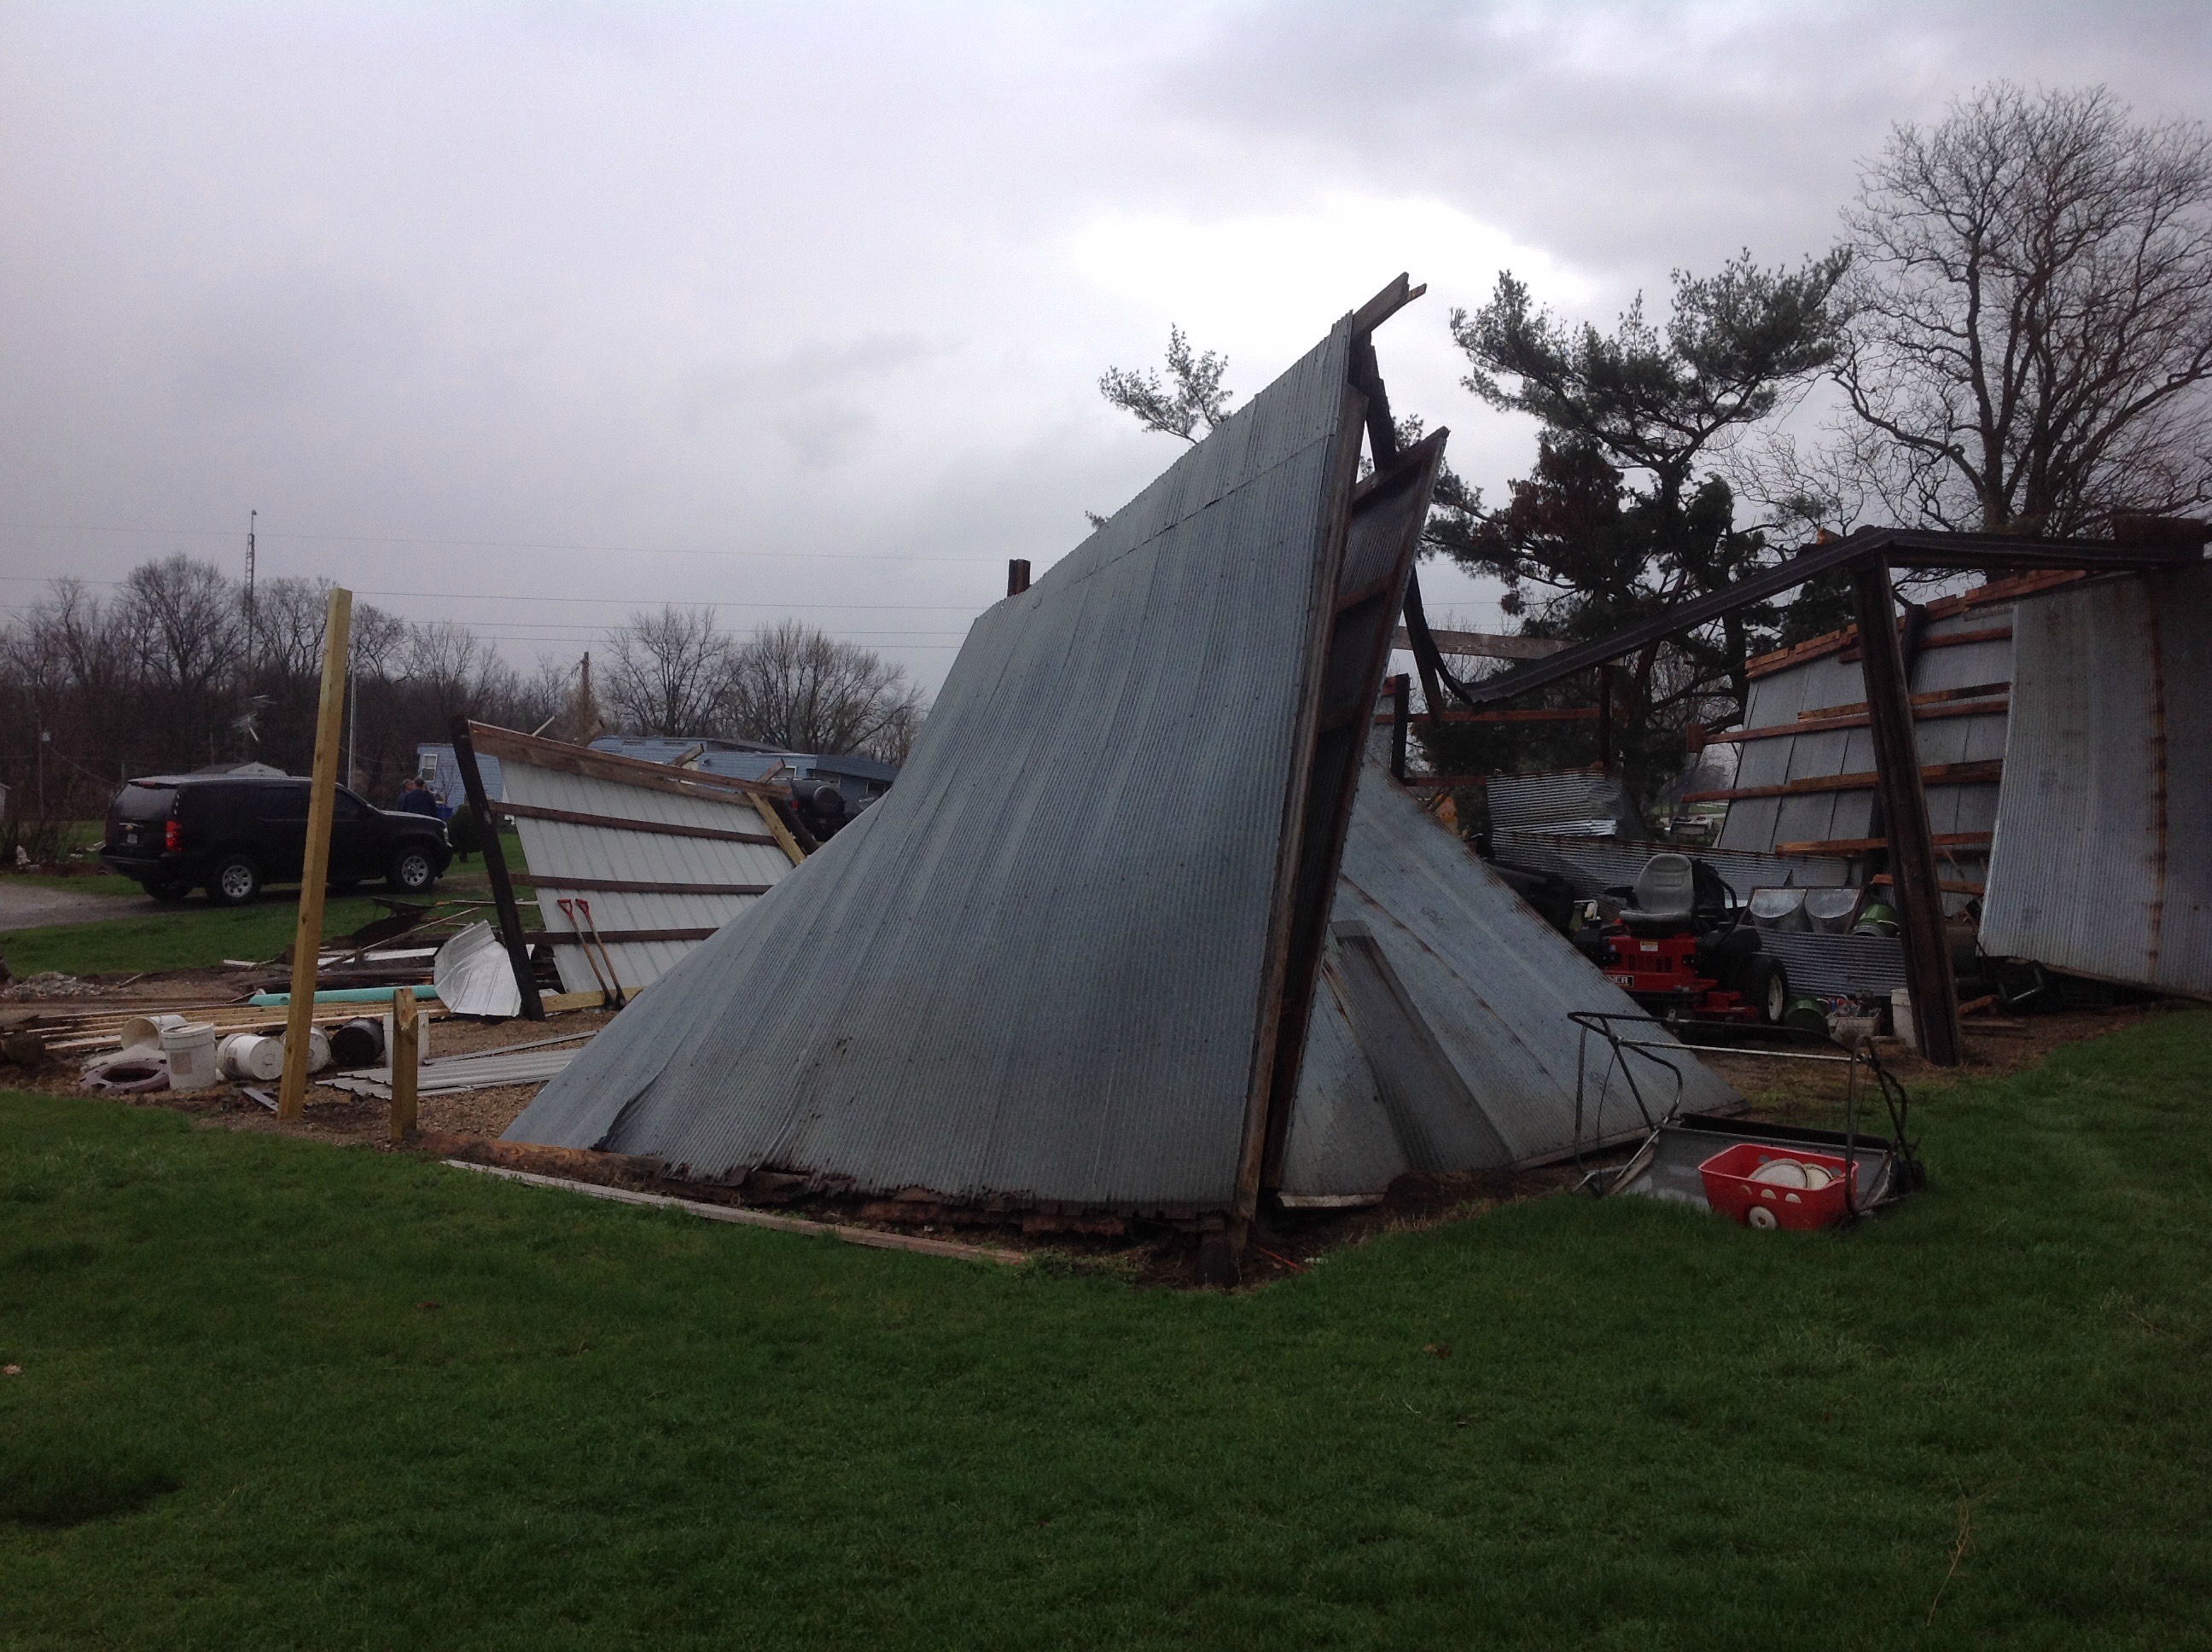
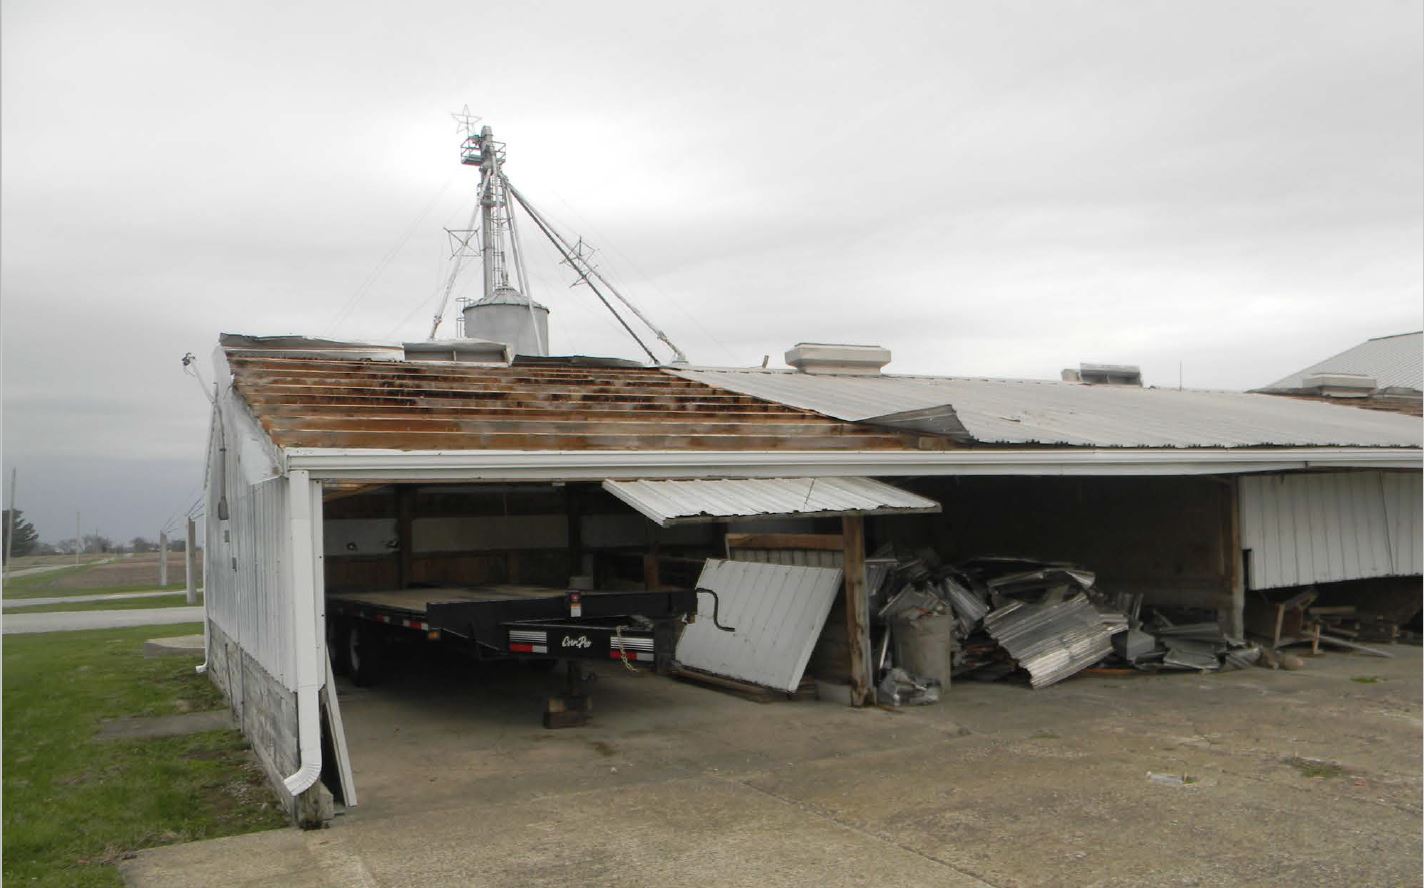
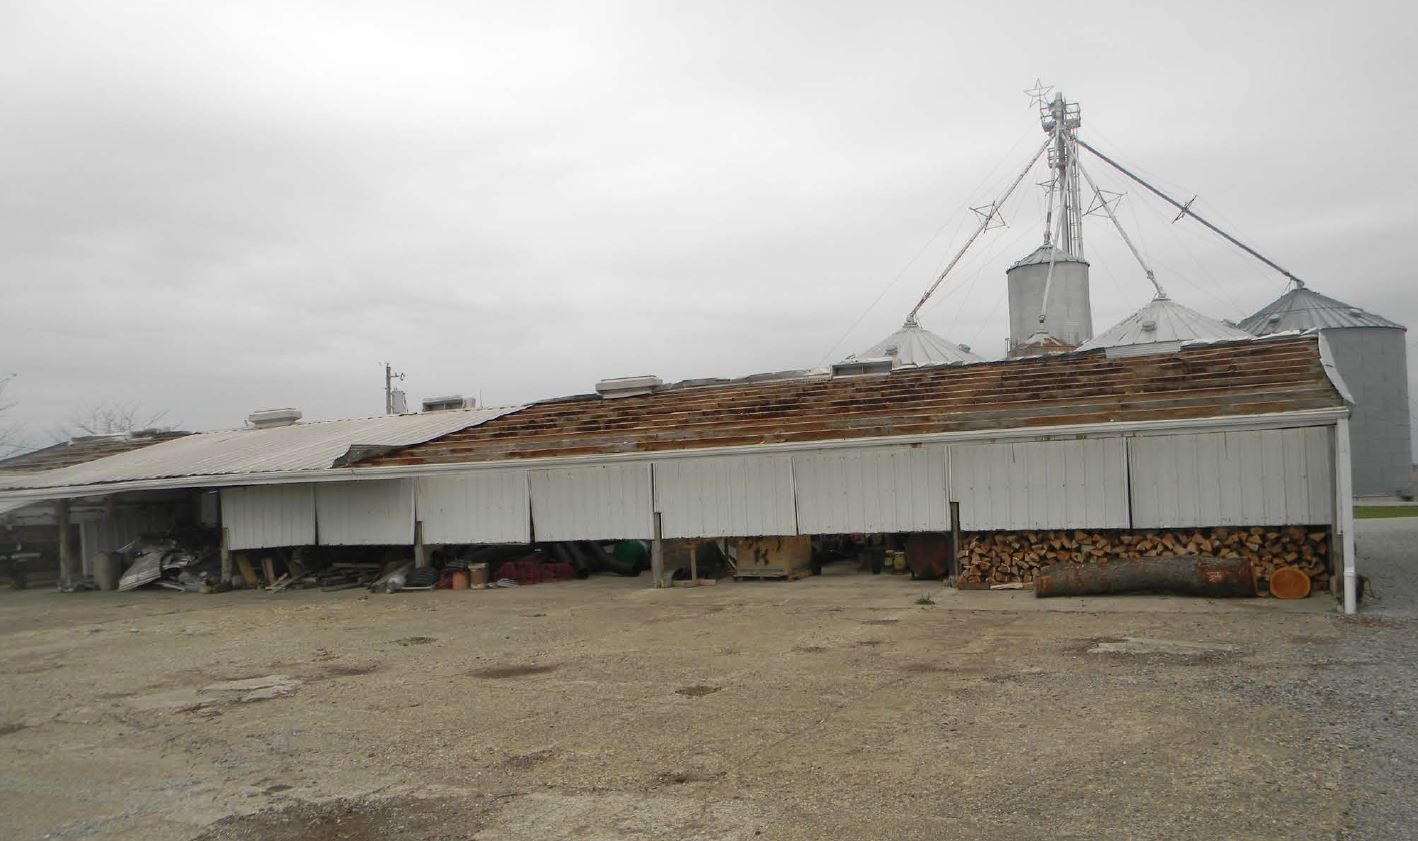
Wabash, IN EF1 (Pictures from NWS Survey)
 |
 |
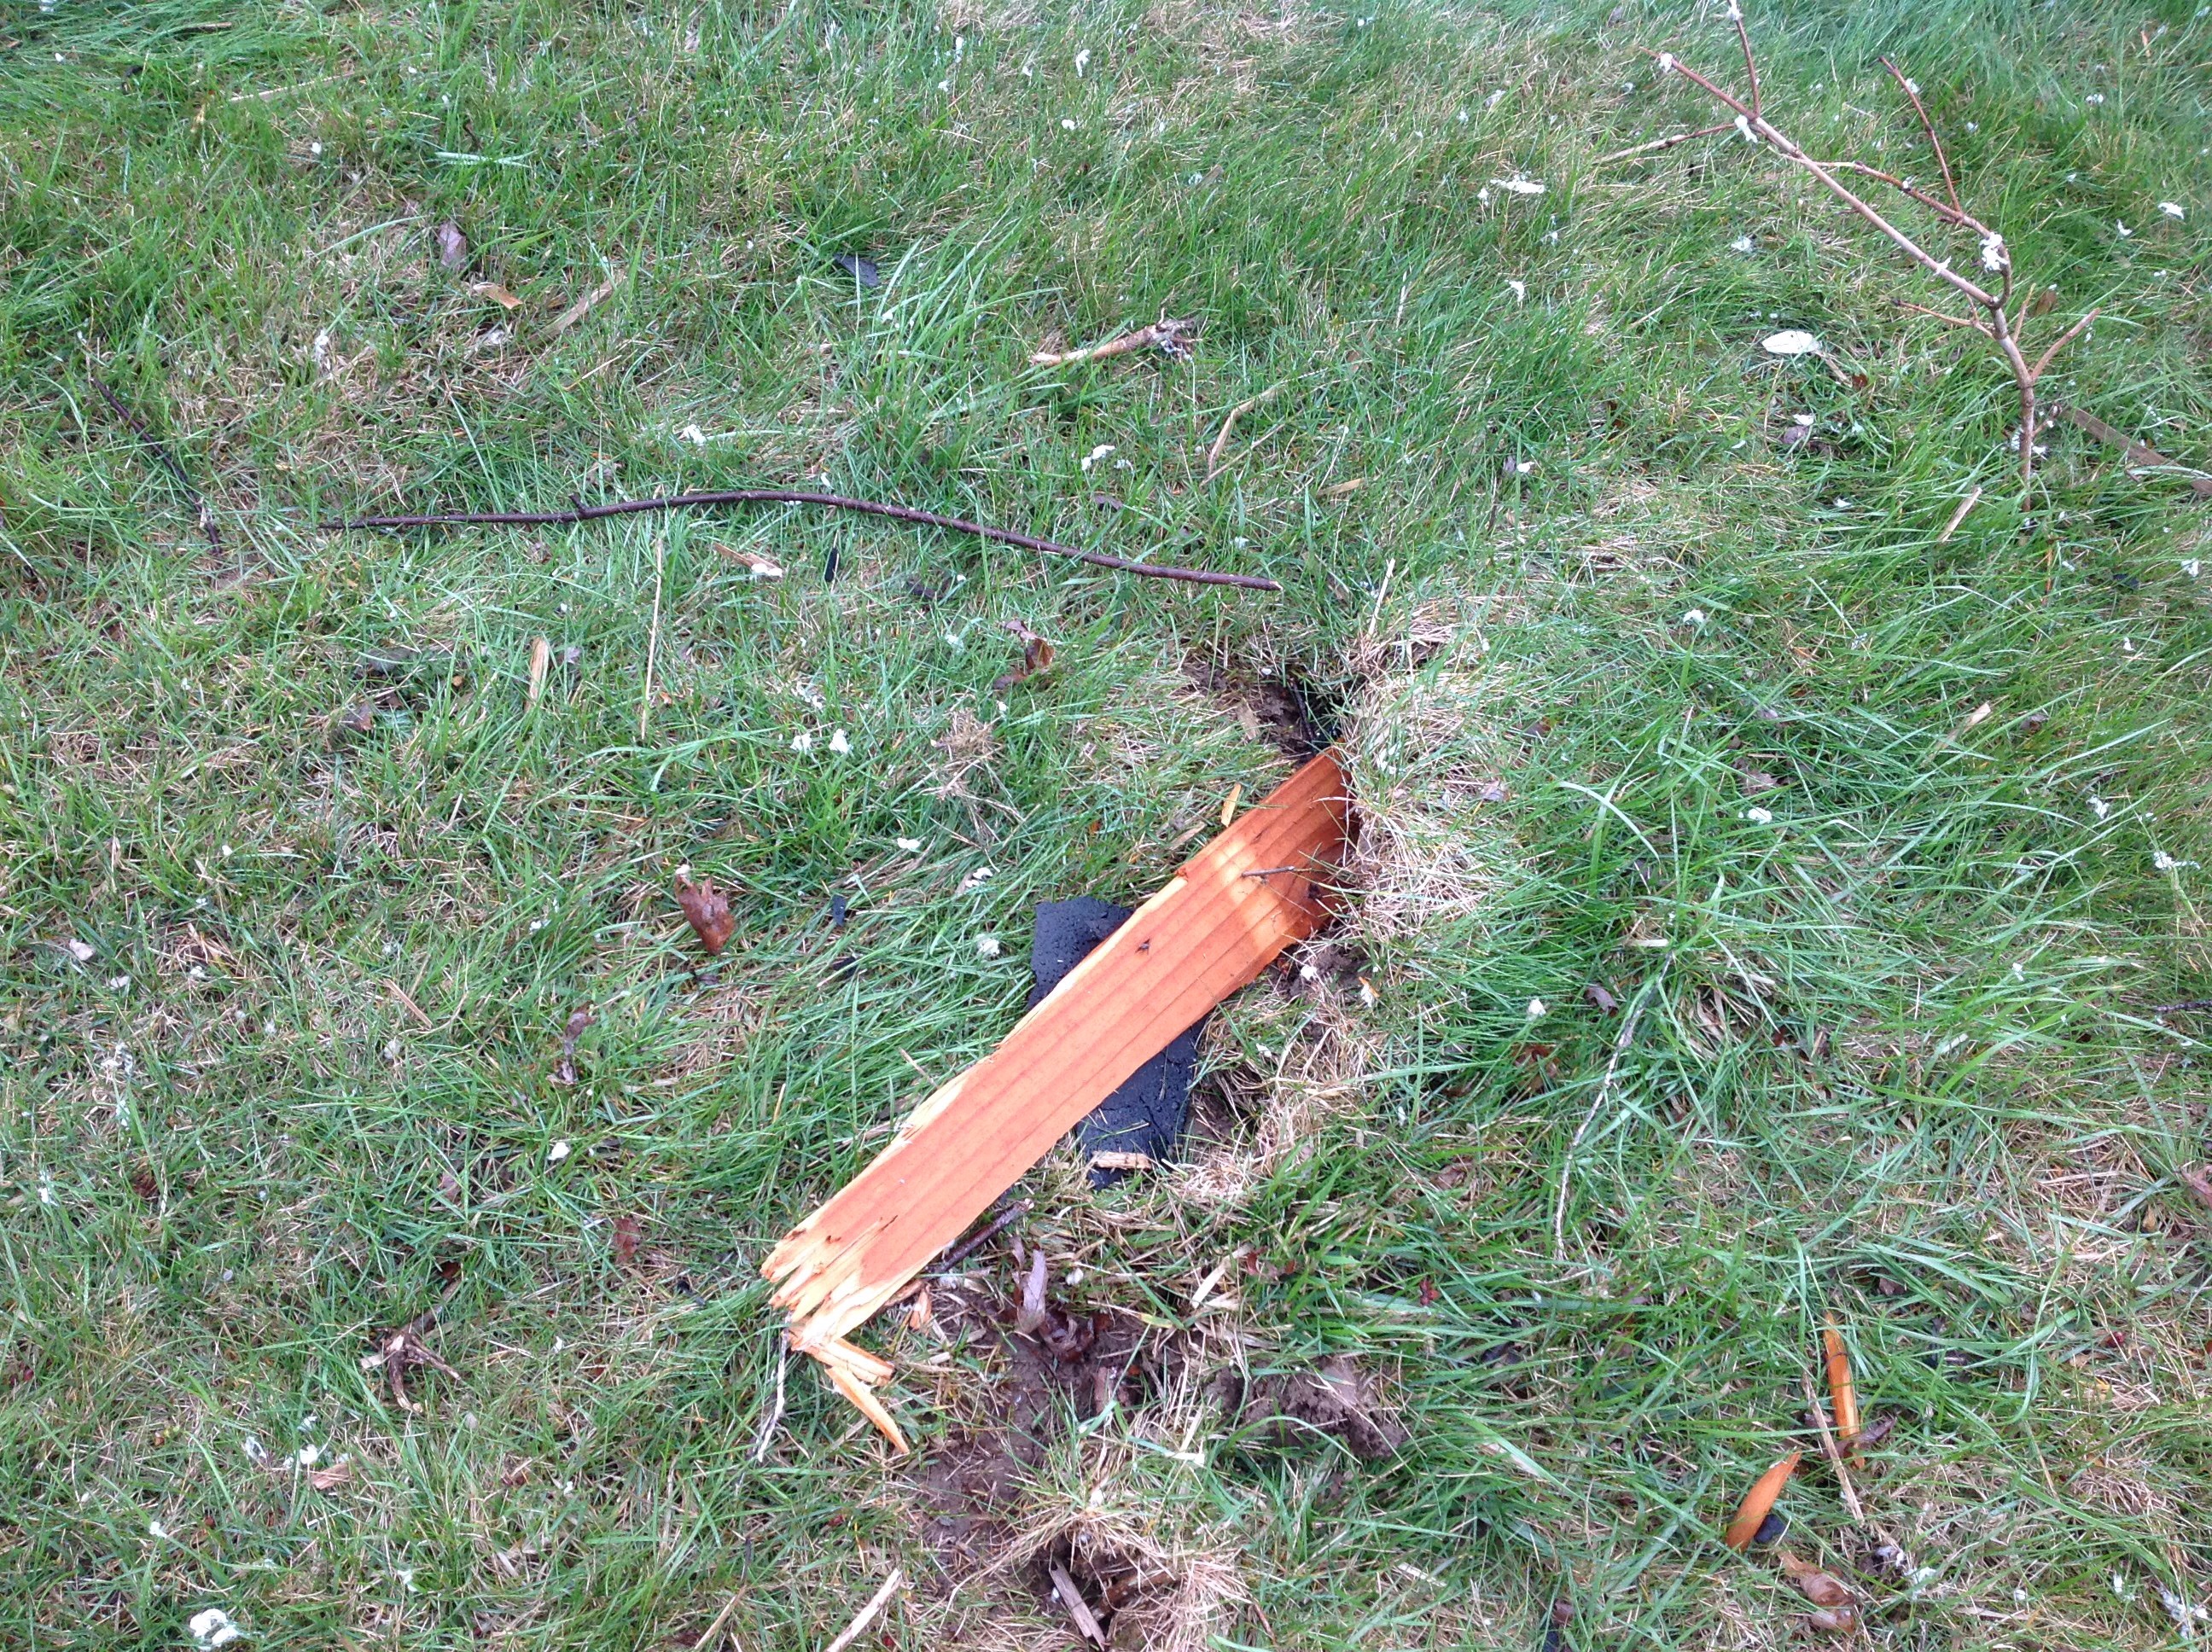 |
| Mobile Home Shifted off Cinderblocks | Old Metal Outbuilding Destroyed | Piece of wood driven into ground |
Albion, IN Damage (Pictures from Noble County EMA)
.jpg) |
.jpg) |
.jpg) |
 |
| Trees damage/Roof removed Tornado Damage | Picnic table and Swing Set thrown Tornado Damage |
Roof Damage to barn Tornado Damage |
South half of roof removed Straight Line Winds |
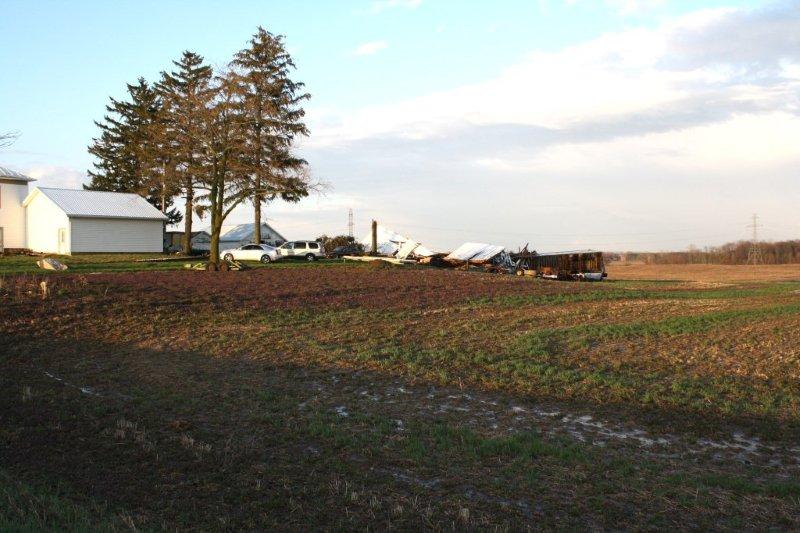
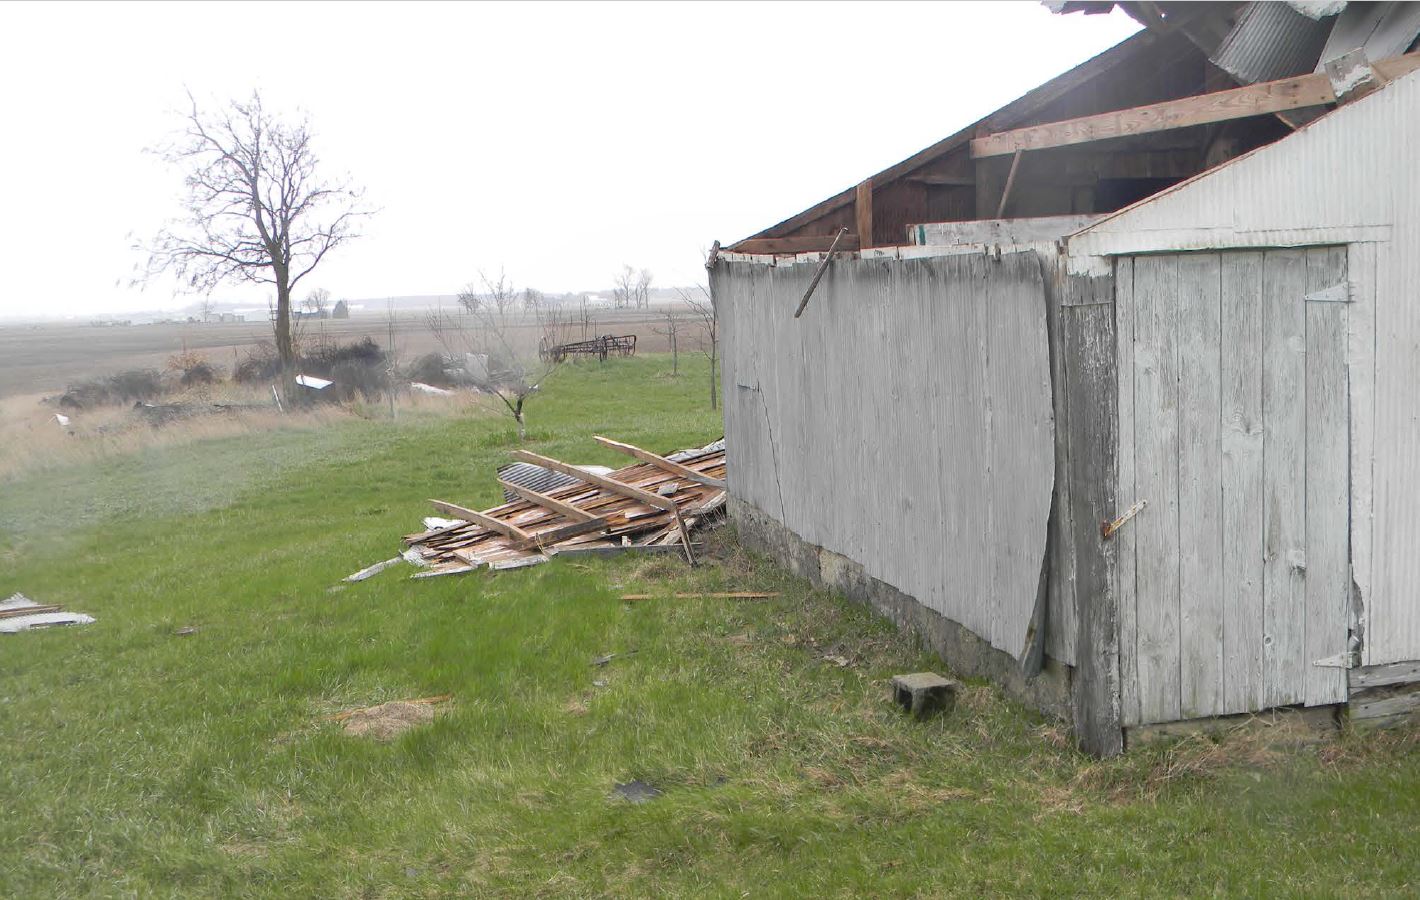
Wolcott, IN EF0 Damage (Pictures from White County EMA)
 |
 |
 |
| Roof Damage to Barn |
Roof and side panels removed |
Large area of roof removed |
Radar:
Images at time of tornado
 |
 |
|
|
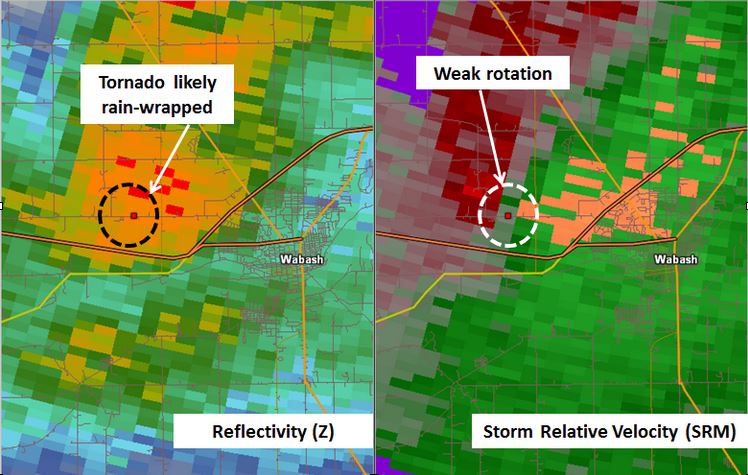
Radar Image at 5:56 PM EDT Wabash, Indiana EF1 |
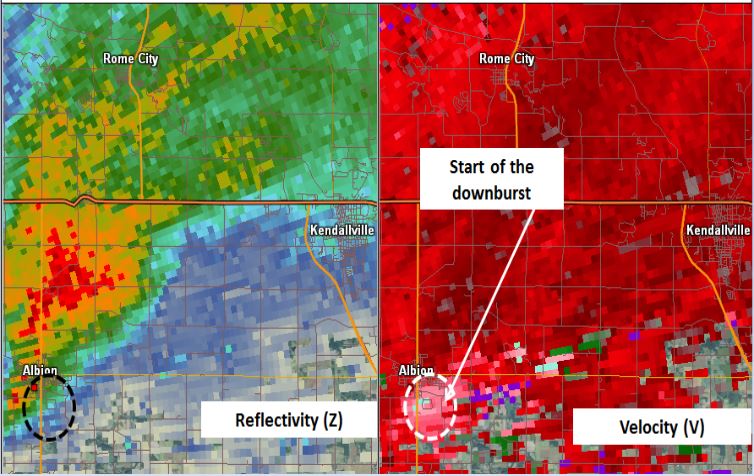
Radar Image at 5:49 PM EDT Albion, Indiana EF1 |
Radar Image at 4:07 PM EDT Wolcott, Indiana EF0 |
Environment
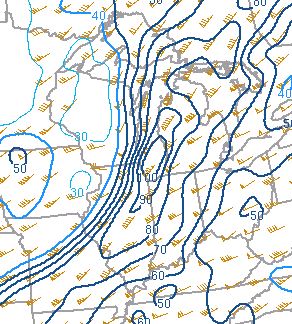
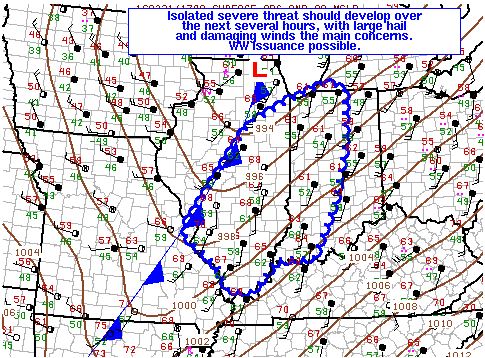
Low pressure was working across the northern Great Lakes with a trailing cold front. A 40 knot low level (850 mb) jet was impinging on the forecast area, with mid level (500 mb) winds in excess of 80 knots.
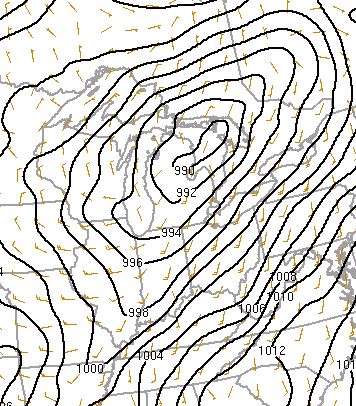 |
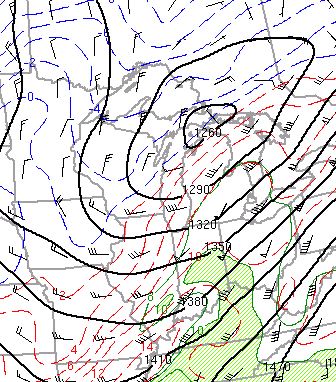 |
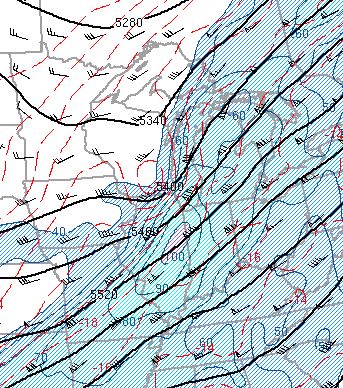 |
| Figure 1: Surface Map at 5 pm EDT | Figure 2: 850 mb Wind/Pressure/Dewpoint at 5 pm | Figure 3: 500 mb Pressure/Wind/Isotachs at 5 pm |
While surface based CAPE (Convective Available Potential Energy) was on the lower side (500 to 750 J/KG), wind shear through much of the atmosphere was high in the 80 to 90 kt range with low level Storm Relative Helicity also favorable for rotation (200-300 m2/s2 ).
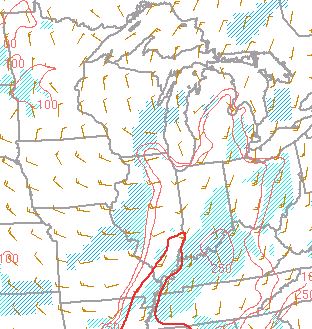 |
 |
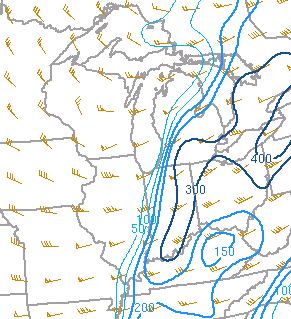 |
| Figure 4: Surface Based CAPE at 5 pm | Figure 5: 0-6 km Shear at 5 pm | Figure 6: 0-1 km Storm Relative Helicity |
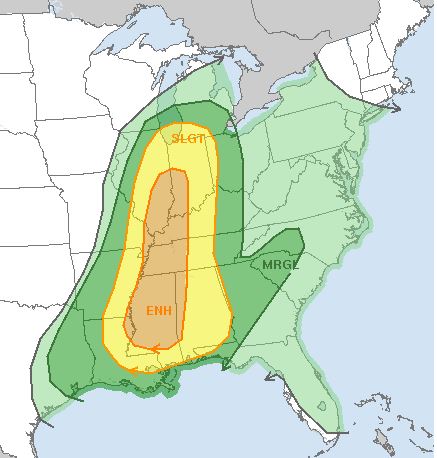
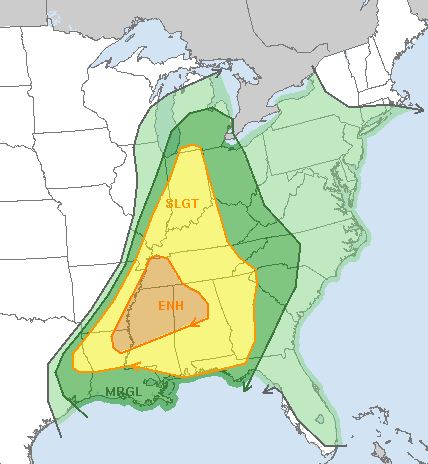
SPC Outlooks
 |
 |
 |
| Figure 7: SPC Day 2 Outlook | Figure 8: SPC Day 1 Outlook at 4 pm EDT | Figure 9: Mesoscale Discussion |
 |
Media use of NWS Web News Stories is encouraged! Please acknowledge the NWS as the source of any news information accessed from this site. |
|

