Melbourne, FL
Weather Forecast Office
|
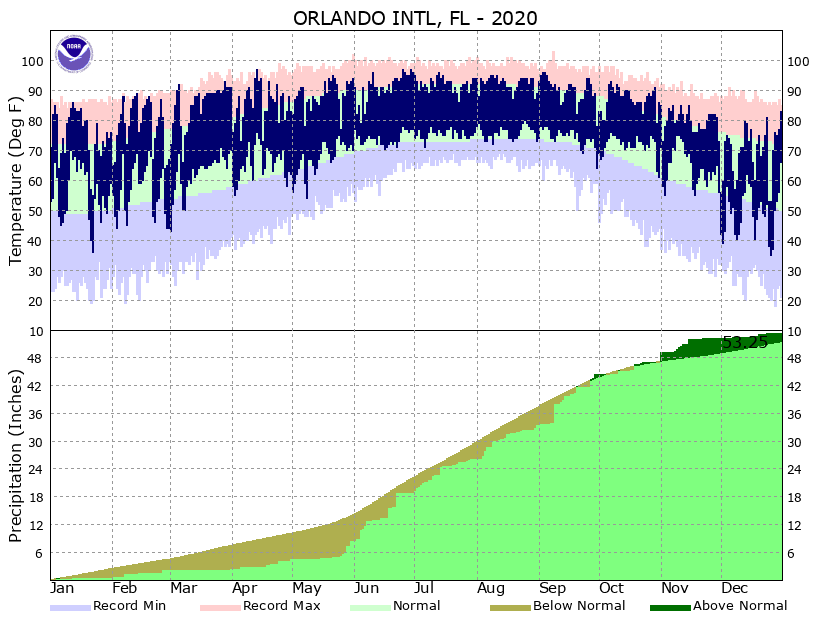
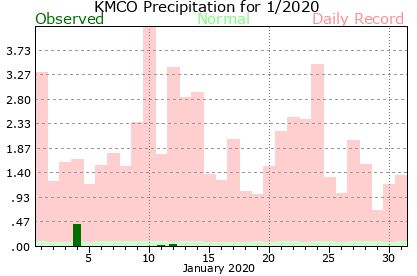
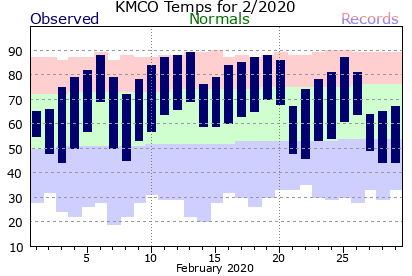
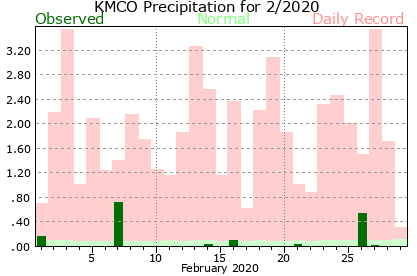
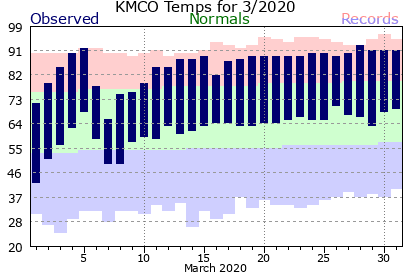
Orlando Intl (KMCO) 2020 Climate Graphs |
|
 |
|
|
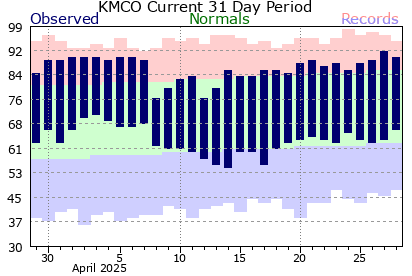
Current 31 Day Temperatures |
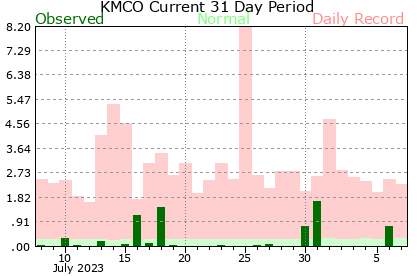
Current 31 Day Precipitation |
 |
 |
|
|
|
|
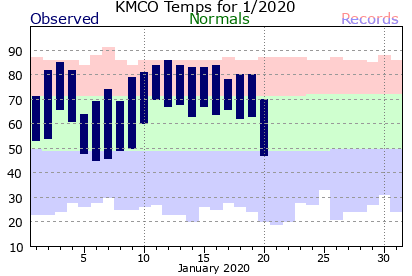
January 2020 Temperatures |
January 2020 Precipitation |
 |
 |
|
February 2020 Temperatures |
February 2020 Precipitation |
 |
 |
|
March 2020 Temperatures |
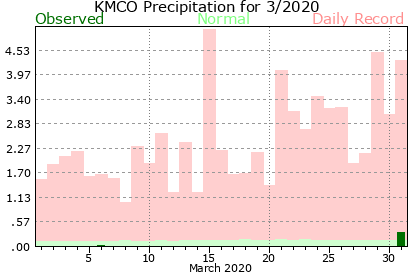
March 2020 Precipitation |
 |
 |
|
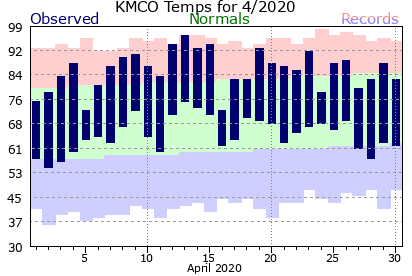
April 2020 Temperatures |
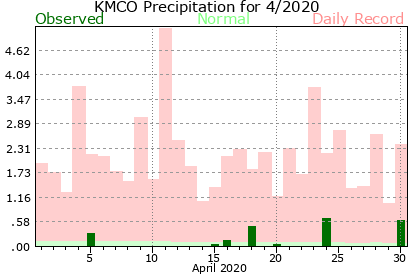
April 2020 Precipitation |
 |
 |
|
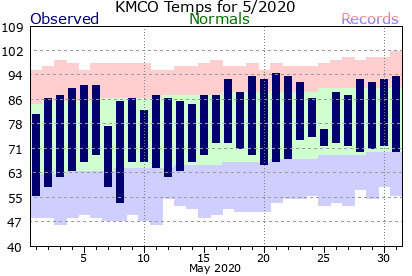
May 2020 Temperatures |
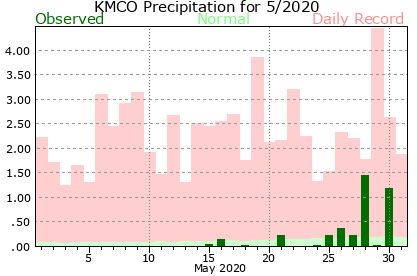
May 2020 Precipitation |
 |
 |
|
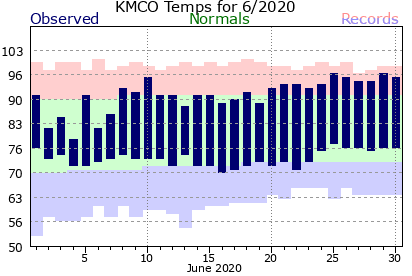
June 2020 Temperatures |
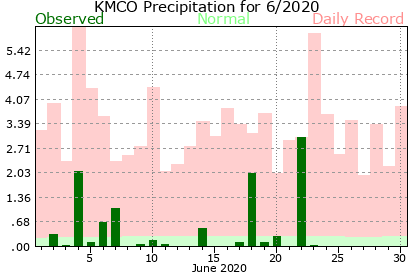
June 2020 Precipitation |
 |
 |
|
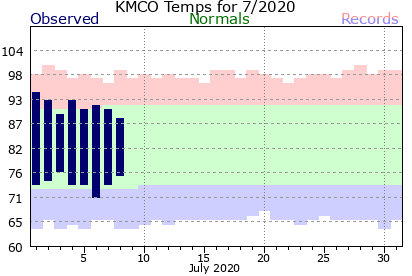
July 2020 Temperatures |
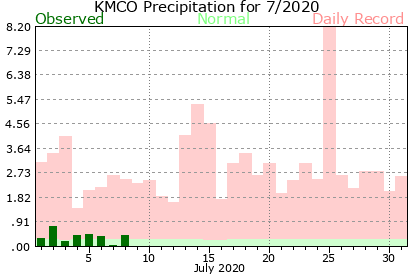
July 2020 Precipitation |
 |
 |
|
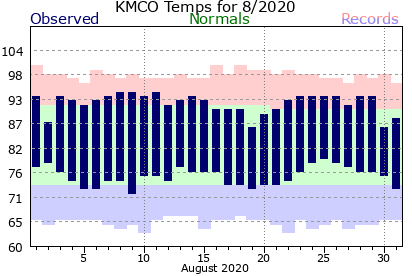
August 2020 Temperatures |
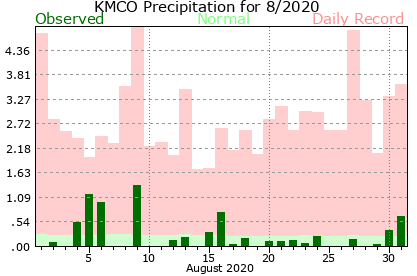
August 2020 Precipitation |
 |
 |
|
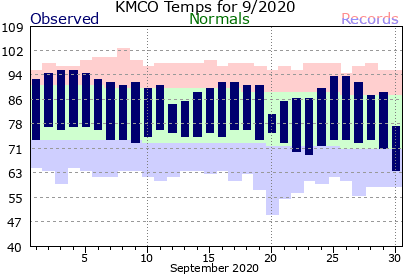
September 2020 Temperatures |
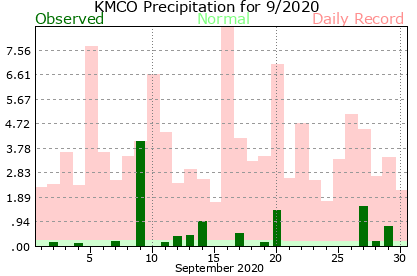
September 2020 Precipitation |
 |
 |
|
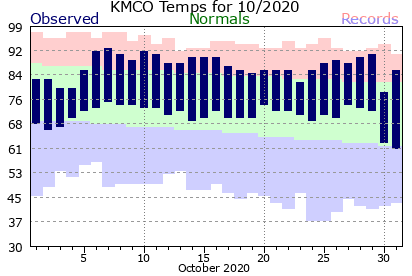
October 2020 Temperatures |
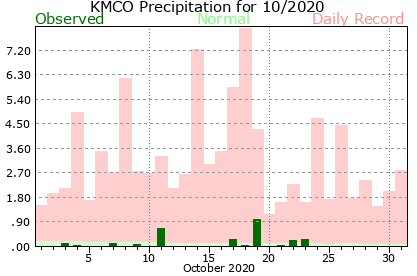
October 2020 Precipitation |
 |
 |
|
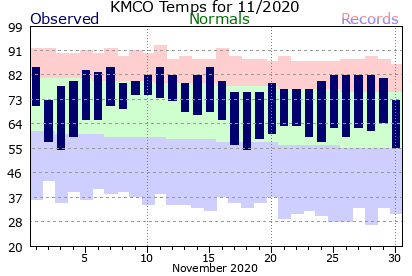
November 2020 Temperatures |
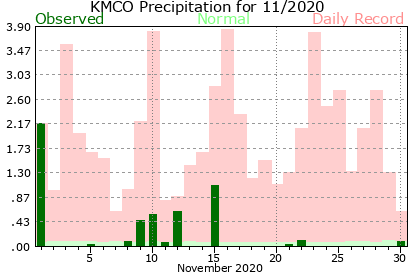
November 2020 Precipitation |
 |
 |
|
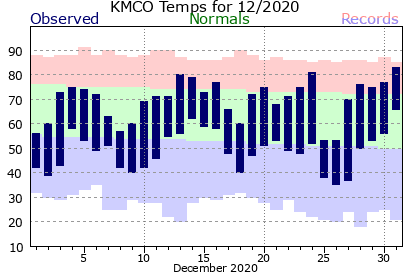
December 2020 Temperatures |
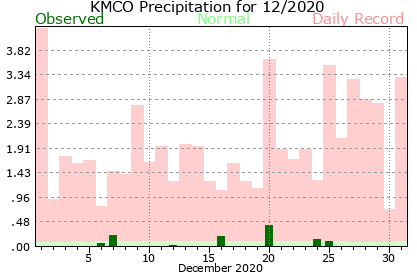
December 2020 Precipitation |
 |
 |
CURRENT HAZARDS
Hazardous Weather Outlook (Graphical)
Florida Hazards (CAP Text)
Outlooks
Storm Reports (Text)
Storm Reports (Graphical)
Cold Weather Support
FORECASTS
Area Forecast Discussion
Aviation Weather
Fire Weather
Graphical
Marine Weather
Probabilistic
Text Products
Tropical Weather
Winter Probabilistic
CURRENT WEATHER
Local Analysis
Observations
Precip Analysis
Satellite Images
Rivers/Lakes
RADAR IMAGERY
Melbourne Standard
Melbourne Enhanced
Regional - Southeast
Area Radars
US Dept of Commerce
National Oceanic and Atmospheric Administration
National Weather Service
Melbourne, FL
421 Croton Road
Melbourne, FL 32935
321-255-0212
Comments? Questions? Please Contact Us.

