Overview
|
May 6, 1965 was one of the worst tornado outbreaks in Minnesota history. Six tornadoes affected six counties around the Twin Cities with 13 fatalities and over 500 injured. The tornado outbreak lasted three hours and caused $51 million in damage. There were four F-4s, one F-3, and one F-2. Two of the F-4s crossed paths, causing even more damage. These tornadoes developed due to low pressure in North Dakota/Canada and unstable air behind a warm front over the Twin Cities region. Tornado watches and warnings were issued by the Weather Bureau. Many credit the announcers of WCCO-AM with saving countless lives. It was also the first time in Twin Cities history that outdoor warning sirens were used for severe weather.
|
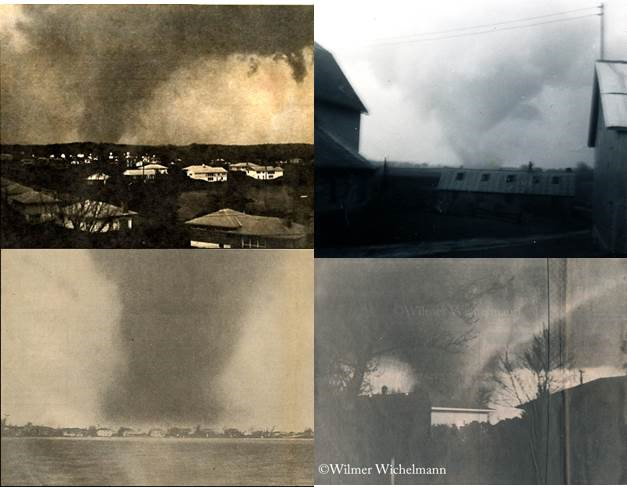
Bottom row: Second Fridley tornado (left), Hamburg tornado (right) |
Tornadoes:
|
Tornado - Cologne
Track Map 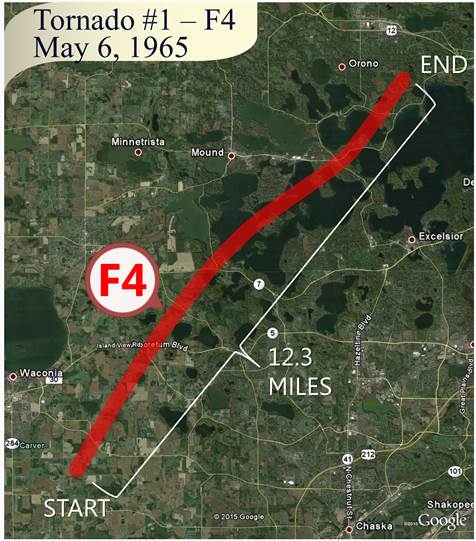
|
||||||||||||
|
Tornado - Chanhassen, Minnetonka, Deephaven
Track Map 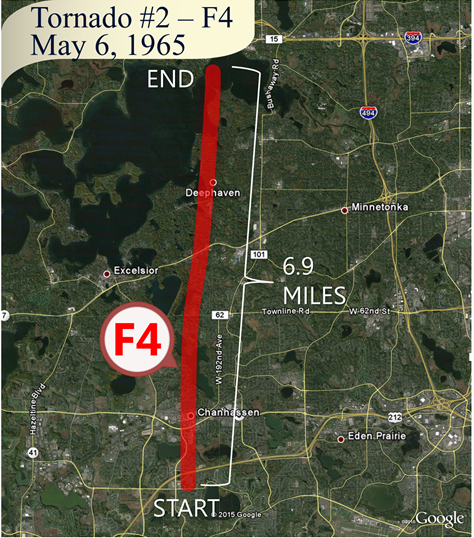
|
||||||||||||
|
Tornado - New Auburn, Lester Prairie
Track Map 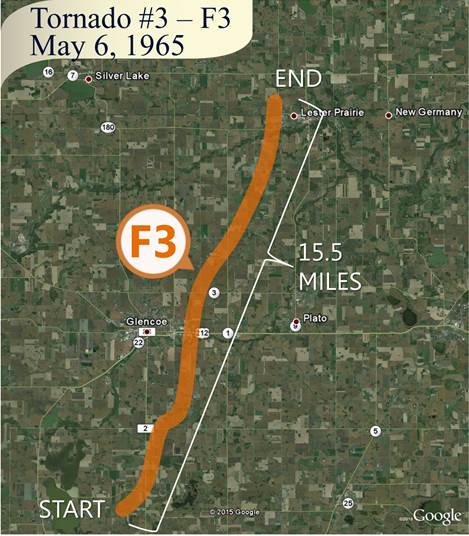
|
||||||||||||
|
Tornado - Green Isle, Hamburg, Waconia
Track Map 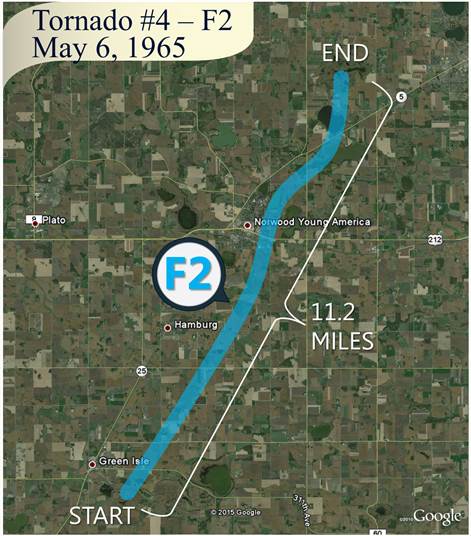
|
||||||||||||
|
Tornado - Fridley, Blaine
Track Map 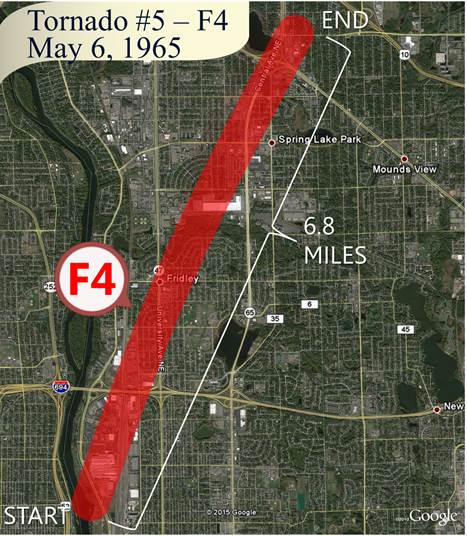
|
||||||||||||
|
Tornado - Golden Valley, Fridley, Mounds View
Track Map 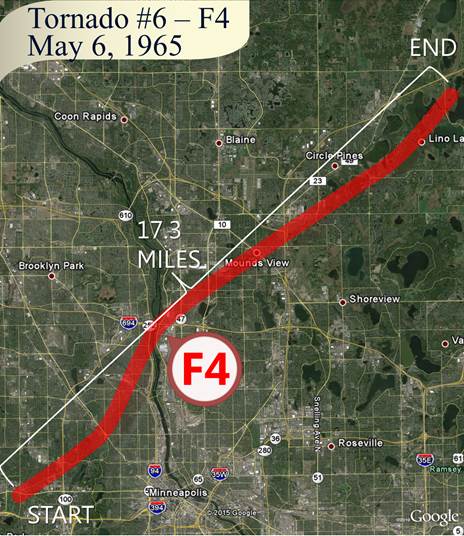
|
||||||||||||
In 1965, the Fujita (F) Scale was used to classify tornadoes into the following categories:
| F0 Weak <73 mph |
F1 Moderate 73-112 mph |
F2 Significant 113-157 mph |
F3 Severe 158-206 mph |
F4 Extreme 207-260 mph |
F5 Catastrophic 261-318 mph |
 |
|||||
Photos:
 |
 |
 |
 |
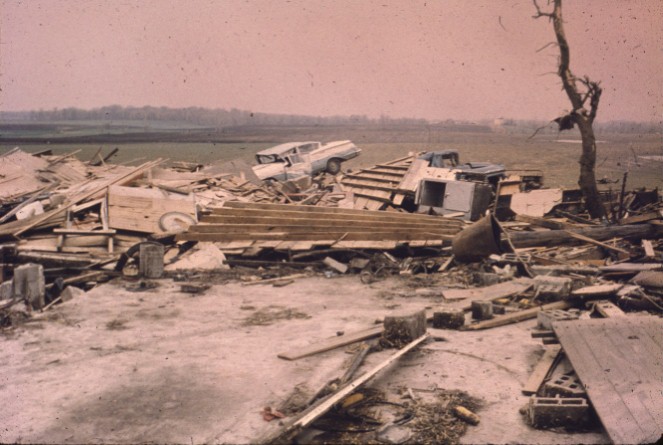
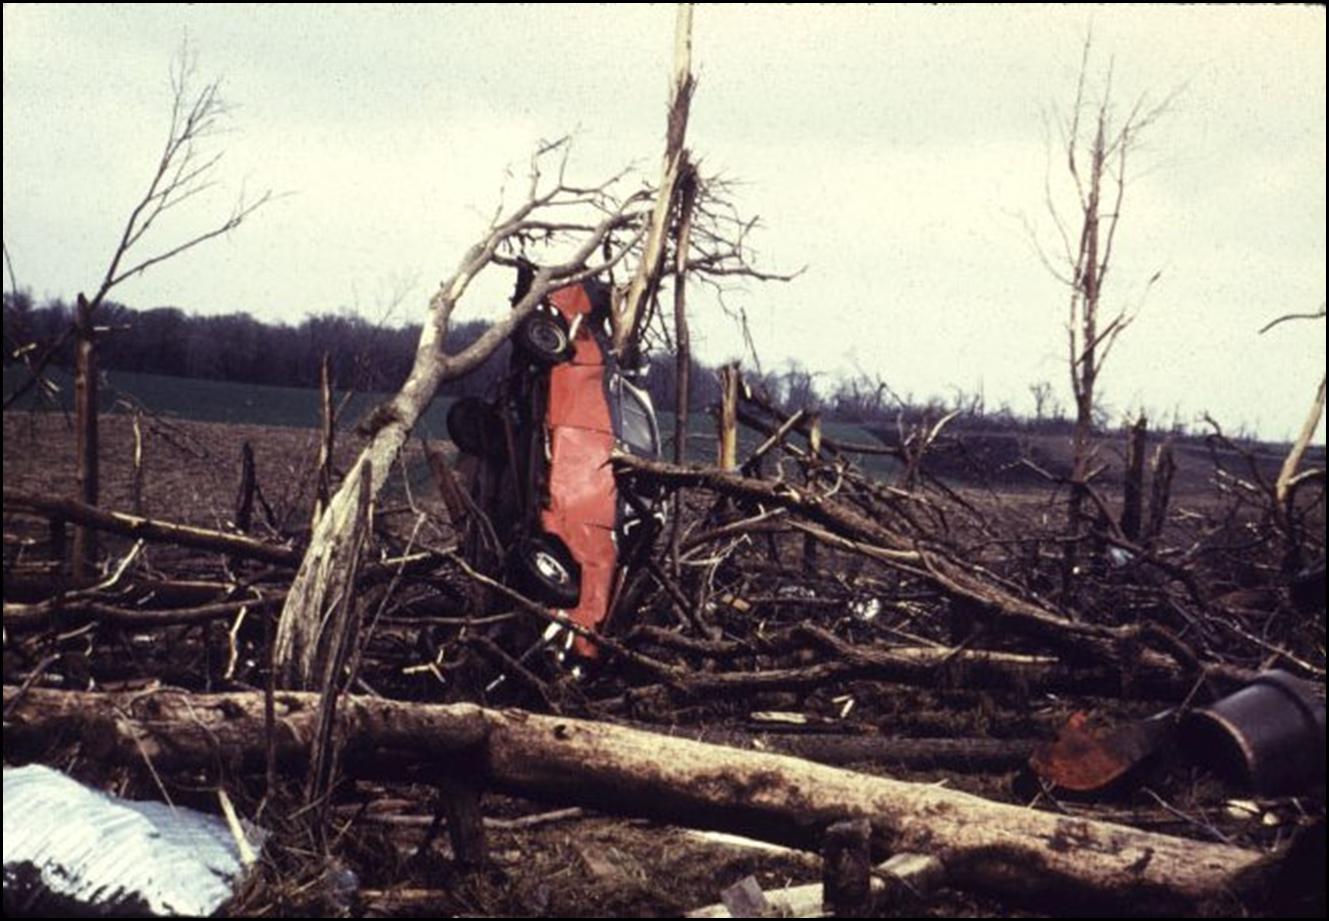
| Damage to a new home just completed in Chanhassen, but nobody was living in it yet. | Damage to a farmstead east of Hamburg and southeast of Norwood. |
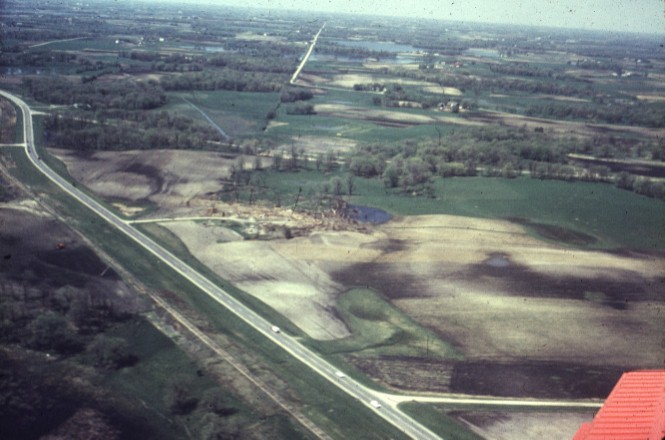
Damage to a farmstead just north of Highway #5, two miles southwest of Waconia. |
Aerial view of Highway #5, roughly halfway between Waconia and Young America. |
 |
 |
 |
 |
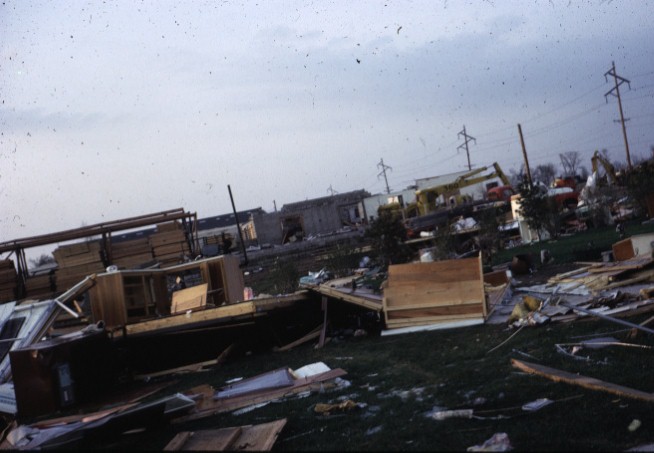
| Damage in Fridley in the trailer park. |
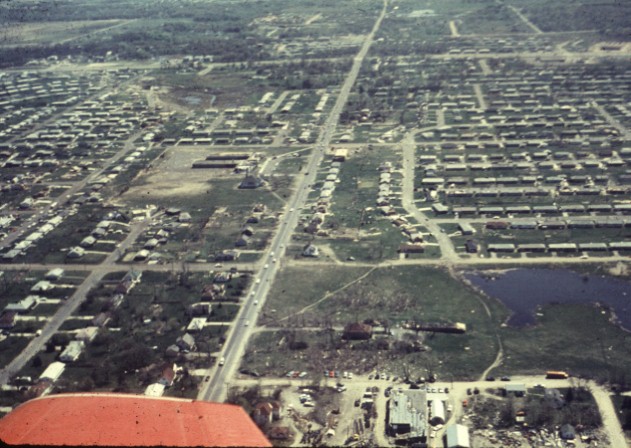
Aerial view, looking east over Fridley. Mississippi Street is the east-west cross street, extending from the tip of the plane's wing and extending to the top center of the photo. In the lower center of the photo is City Hall (the brown roof building between Mississippi Street and the small pond), which took a direct hit. |
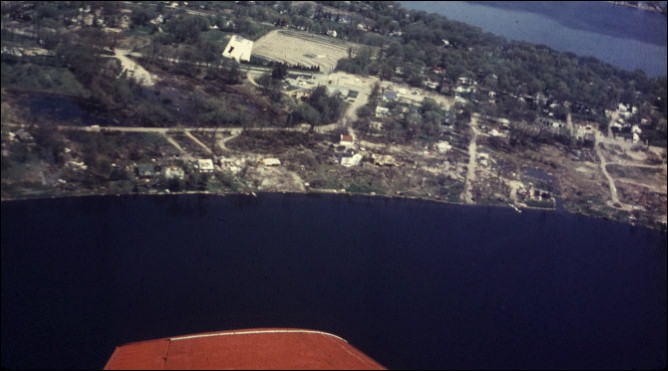
Aerial view of Spring Park. The tornado then went through Navarre, just west of Wayzata, and ended near Hamel. |
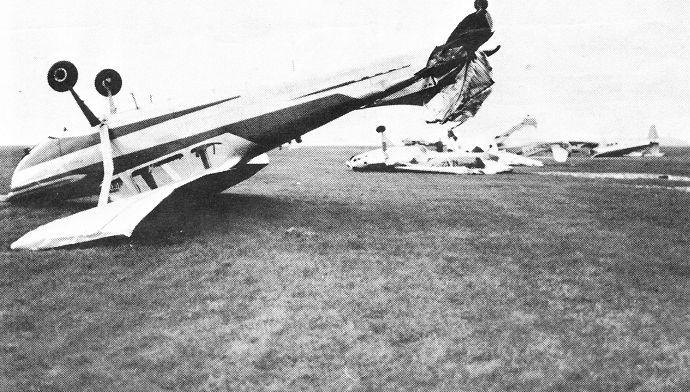
Airplane damage in Blaine/Anoka Co. Airport |
Radar:
|
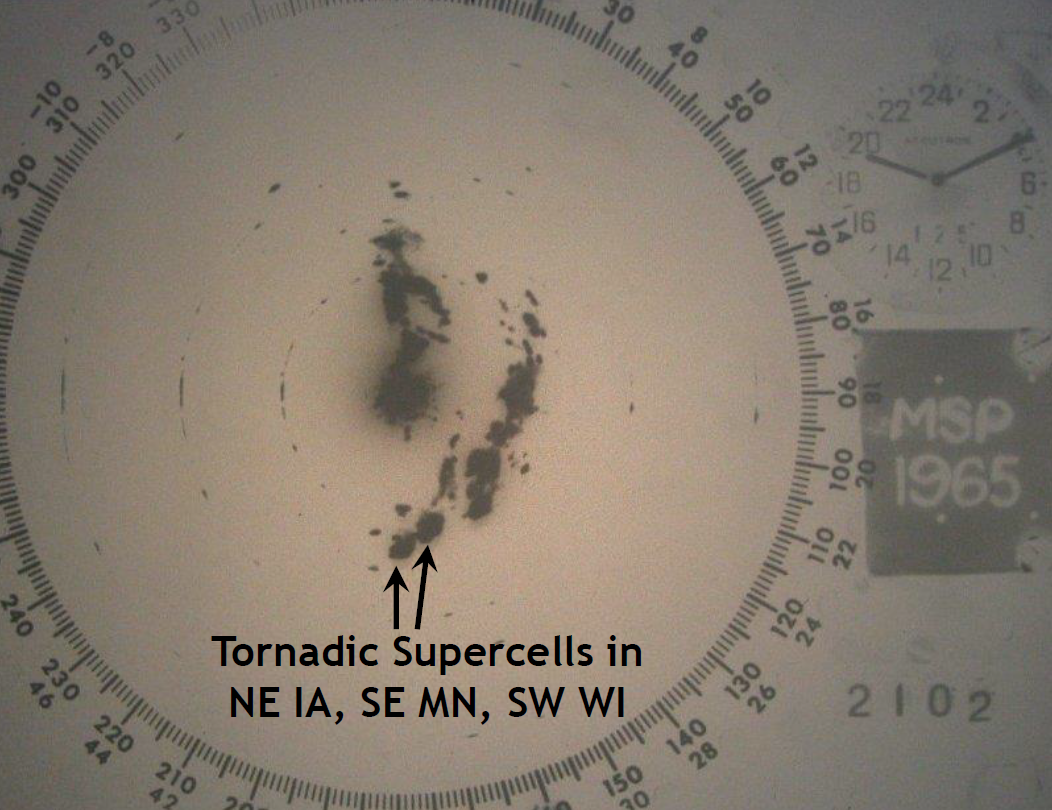
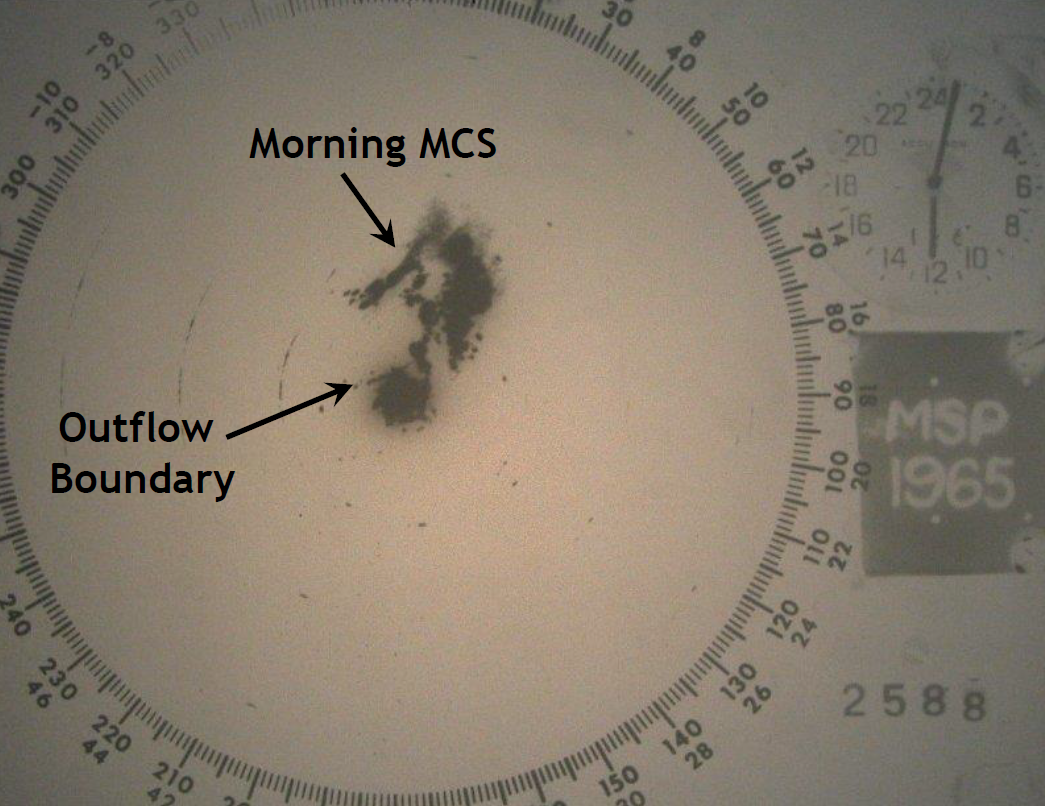
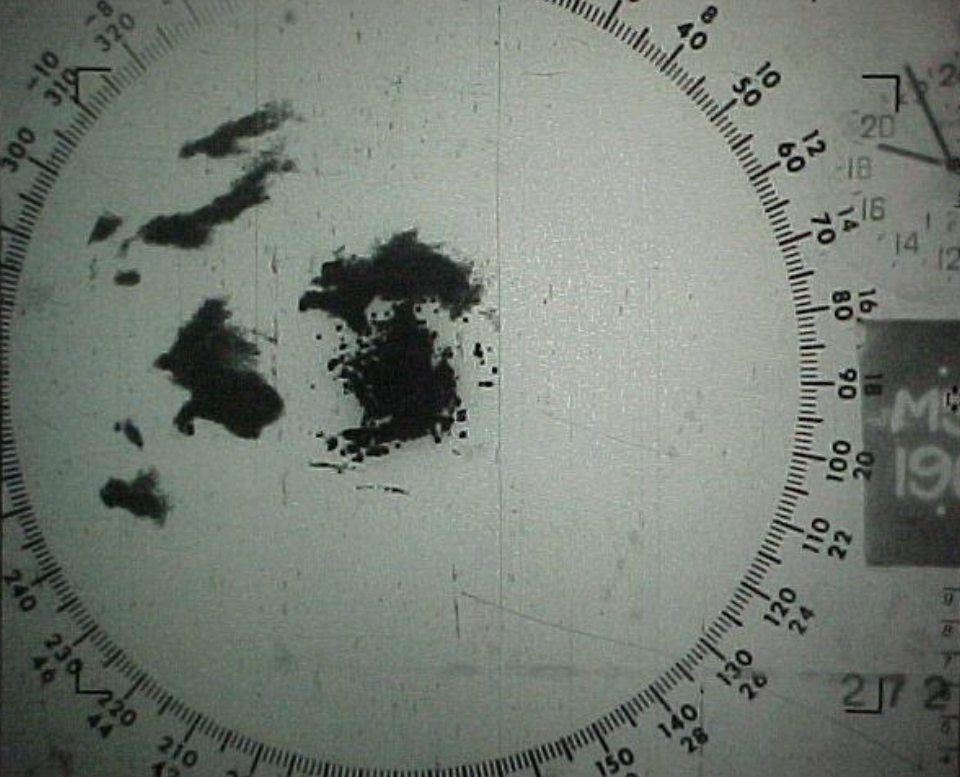
The loop to the right, and images below, are from the Weather Surveillance Radar 57, or WSR-57. In 1959 the first "modern" radar was commissioned at the Miami hurricane forecast center. Over the next few years, many of these radars were installed, mostly east of the Rockies. The Twin Cities WSR-57 was installed at the MSP Airport in 1961. With coarse reflectivity and no velocity data, it was often a challenge to issue tornado warnings in time. In 1965, one had to apply manual attenuation to see some of the finer detail of critical echoes. The radar operator on May 6 was very skilled at this, enabling one to see great detail, including a number of hook echoes. The radar had a camera that could photograph echoes varying from one per minute to a photo every 15 minutes. The operator on May 6 opted for one per minute. One could also adjust the distance that was being viewed by the camera. On May 6, 1965, it was mostly set to record photographs out to 50 nautical miles (58 statute miles). Note that the clock uses 24 hour timing. For example, 2100 would be 9:00 p.m. Throughout the course of the event, 24 separate hook echoes were noted, as described in Storm Data. From a meteorological perspective, however, we know that not every hook echo has an associated tornado. In the late 1980s through mid 1990s, the WSR-88D was deployed across the country, including at Chanhassen in 1994. The "D" in WSR-88D stands for Doppler. And it is the Doppler technology that has revolutionized weather forecasting by allowing meteorologists to observe storm motion. However, this technology was not available in 1965. |
|
 |
 |
 |
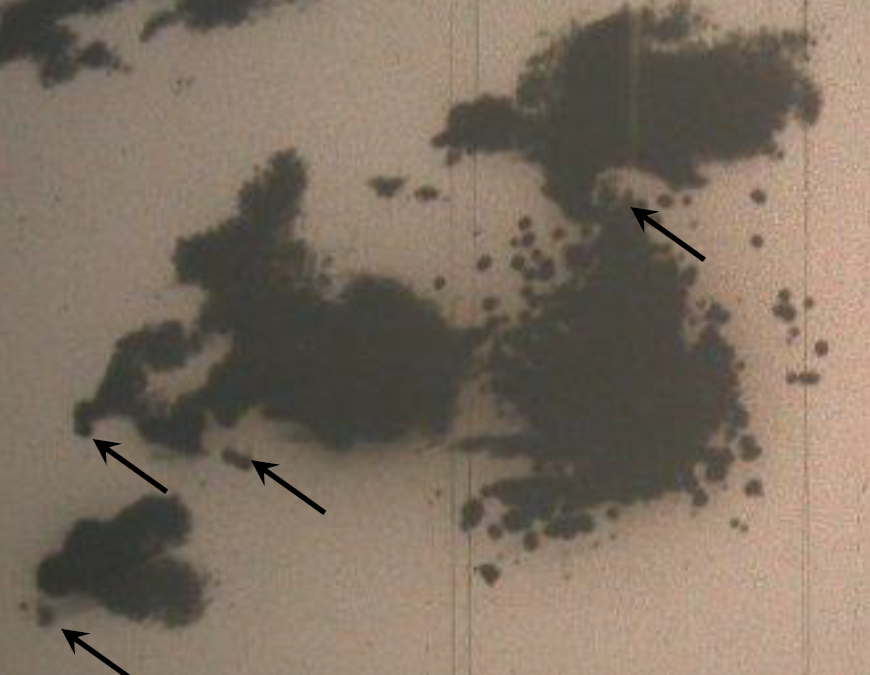 |
| (Day Prior) Radar image of supercells on May 5 at 7:10 PM CST. | (Morning of the Event) Radar image of late morning thunderstorms on May 6 at 12:05 PM CST. Notice the subtle outflow boundary just northwest of the radar. | (During the Event) Radar image of supercells on May 6 at 6:55 PM CST. Notice the "hook-like" appendage on the storm west of the radar. | (During the Event) Radar image of multiple supercells on May 6 at 7:09 PM CST. |
Storm Reports
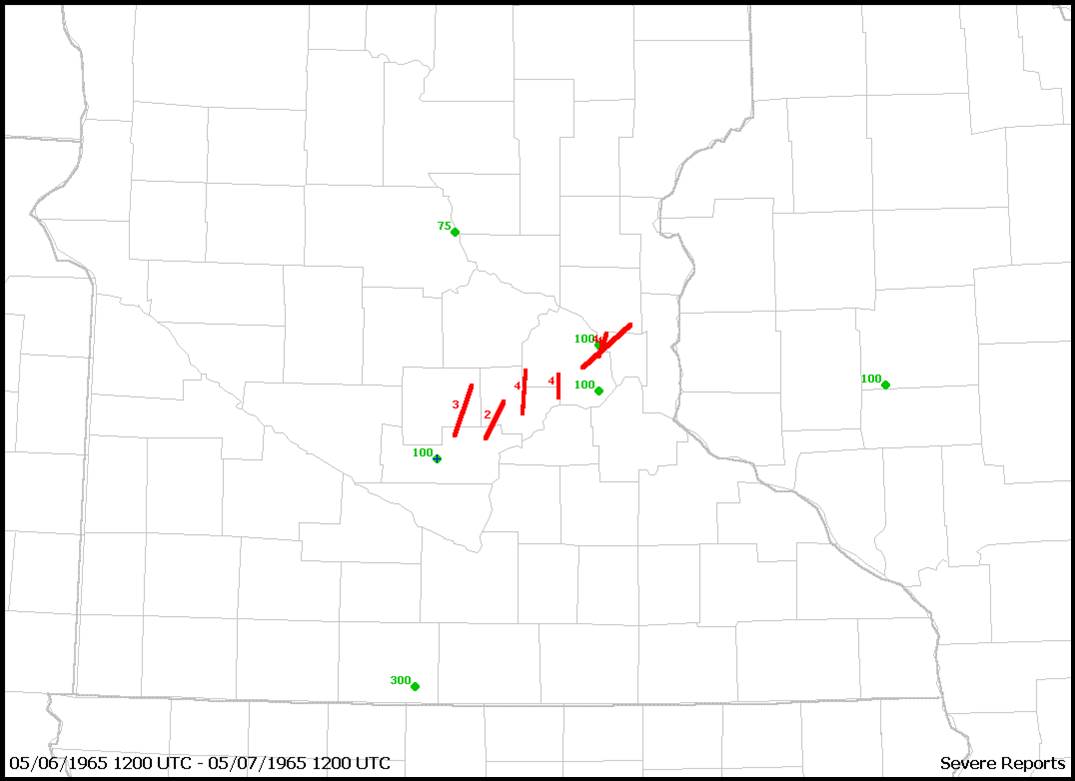 |
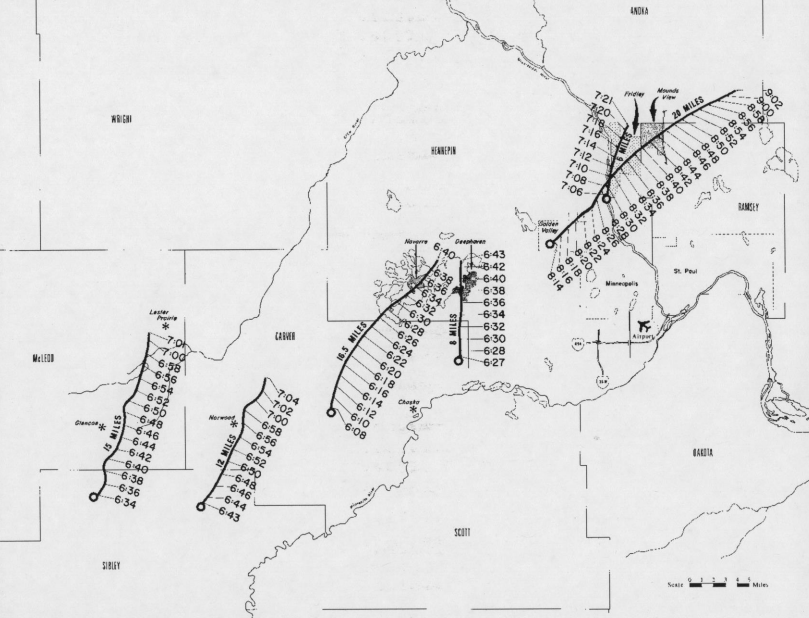 |
| The map above shows storm reports from that day, with the red lines indicating tornado tracks, and the green dots indicating hail. Storm reports back then were not as readily available as they are today, so it is likely that more severe weather occurred than what this map shows. | The image above shows a zoomed-in map of the tracks from that day along with approximate timing. |
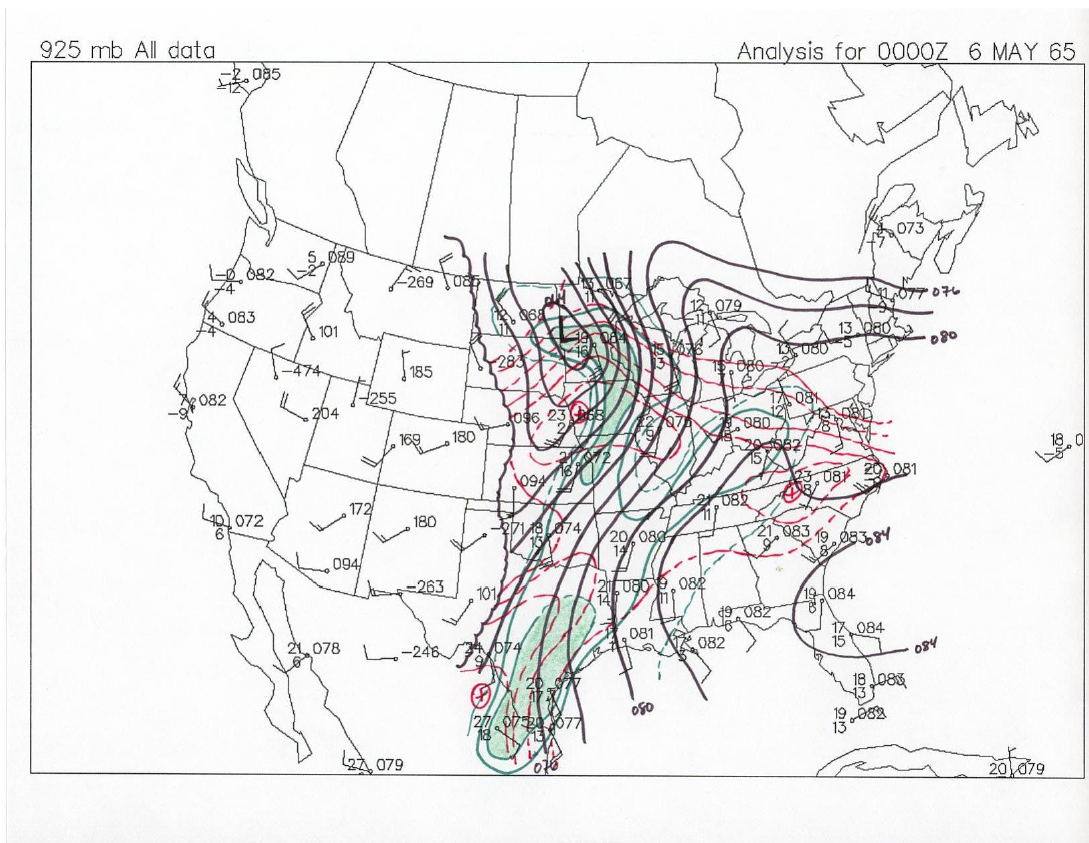
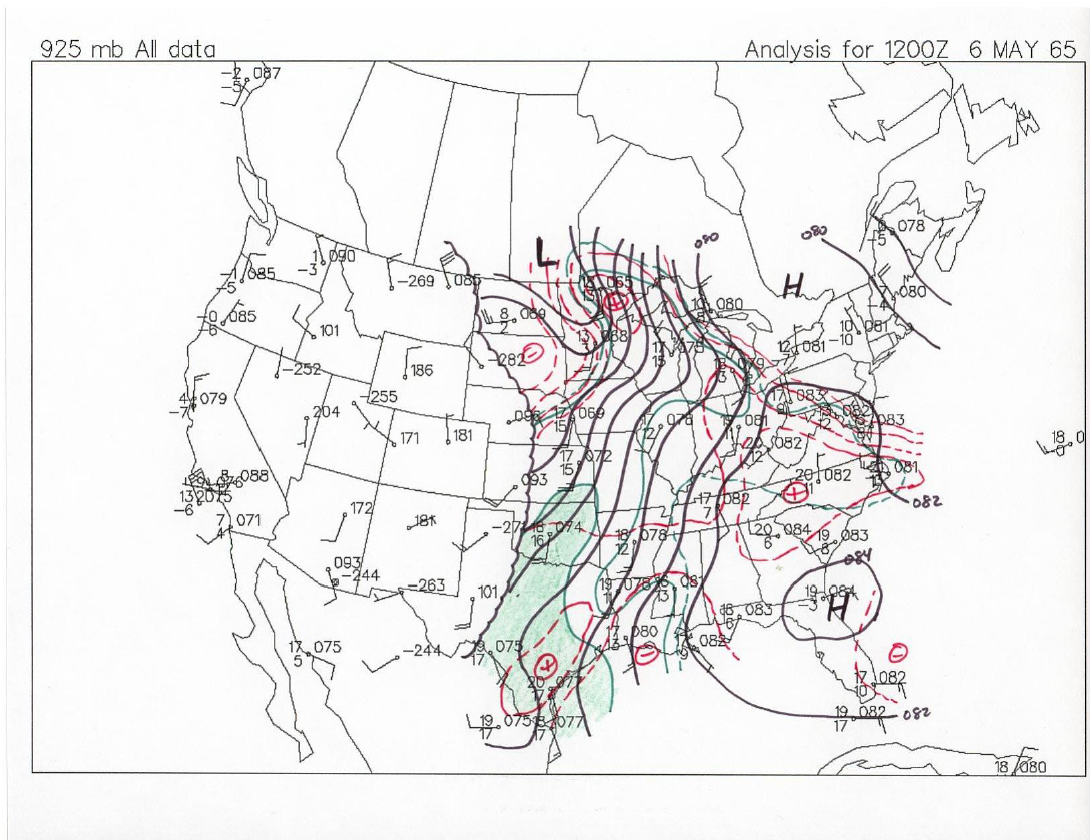
Environment
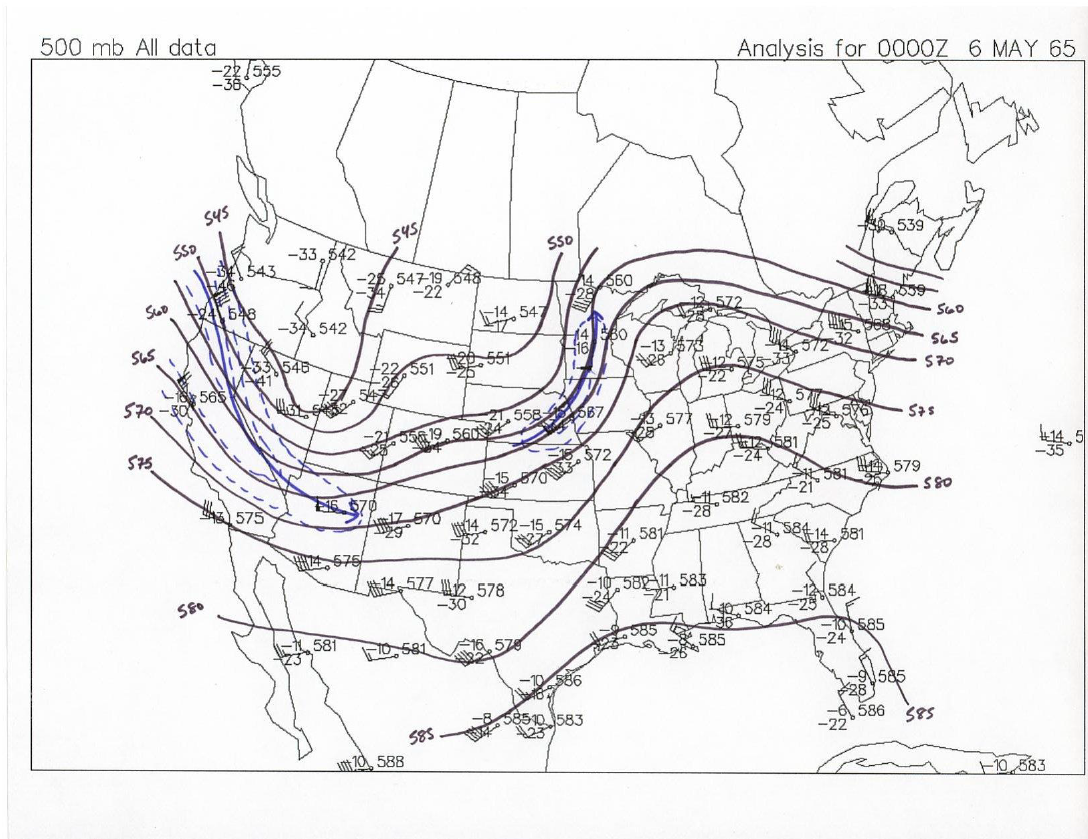
On the morning of May 6, two upper-level low pressure systems were situated over the western U.S. and the North Dakota/Canada border. The flow/circulation associated with these lows created favorable conditions for instability. Later in the evening, warm moist air was located behind the warm front over the Twin Cities area. This environment led to convection and tornadic supercells.
 |
 |
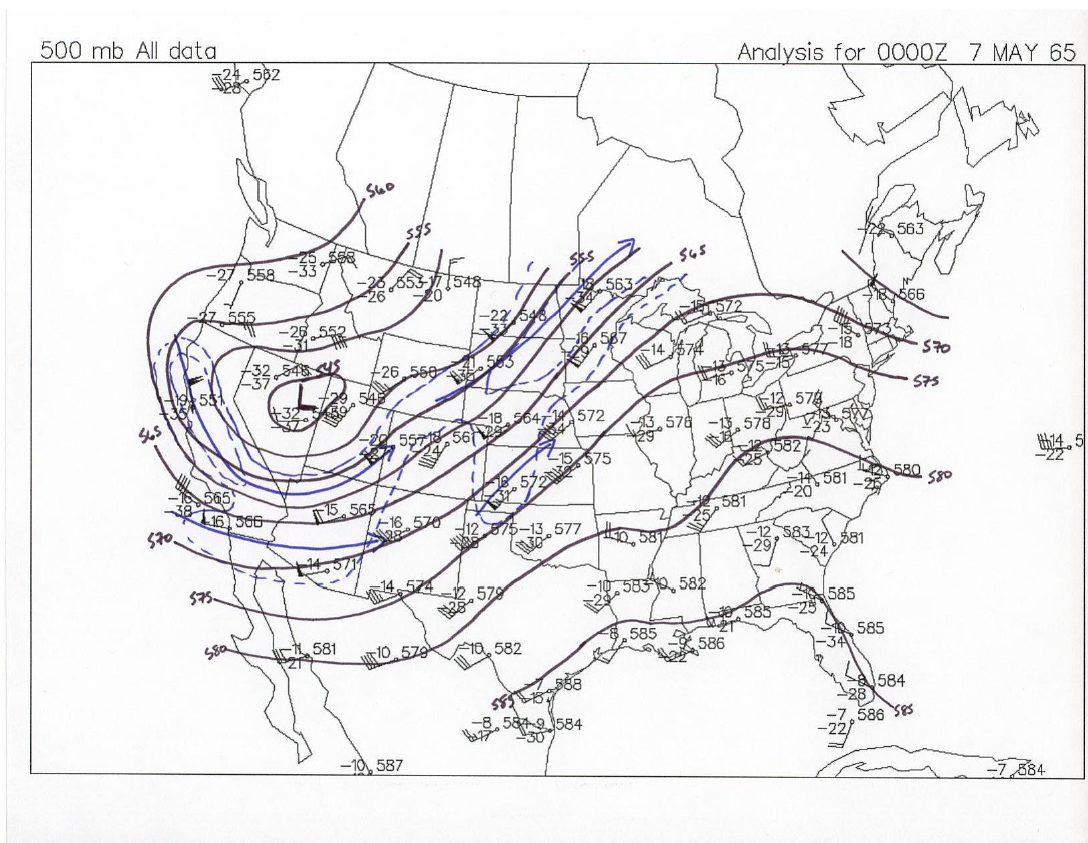 |
| 500 mb analysis from 7pm on May 5. | 500 mb analysis from 7am on May 6. | 500 mb analysis from 7pm on May 6. |
 |
 |
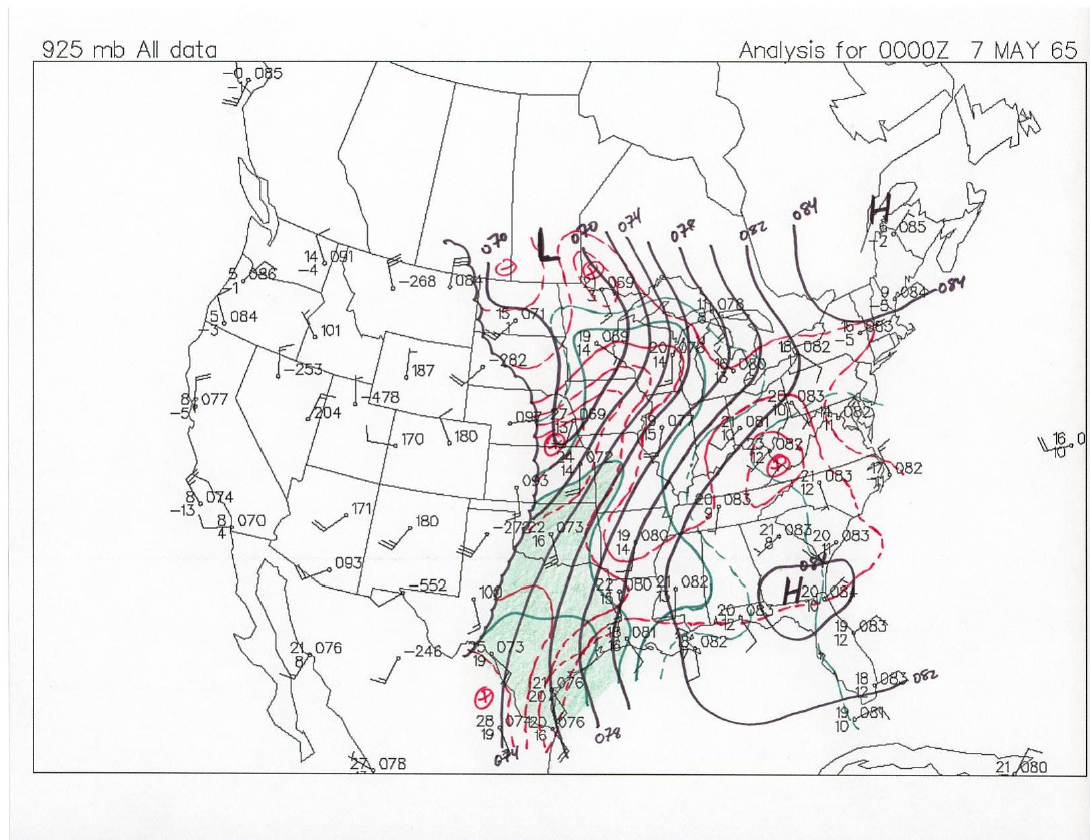 |
| 925 mb analysis from 7pm on May 5. | 925 mb analysis from 7am on May 6. | 925 mb analysis from 7pm on May 6. |
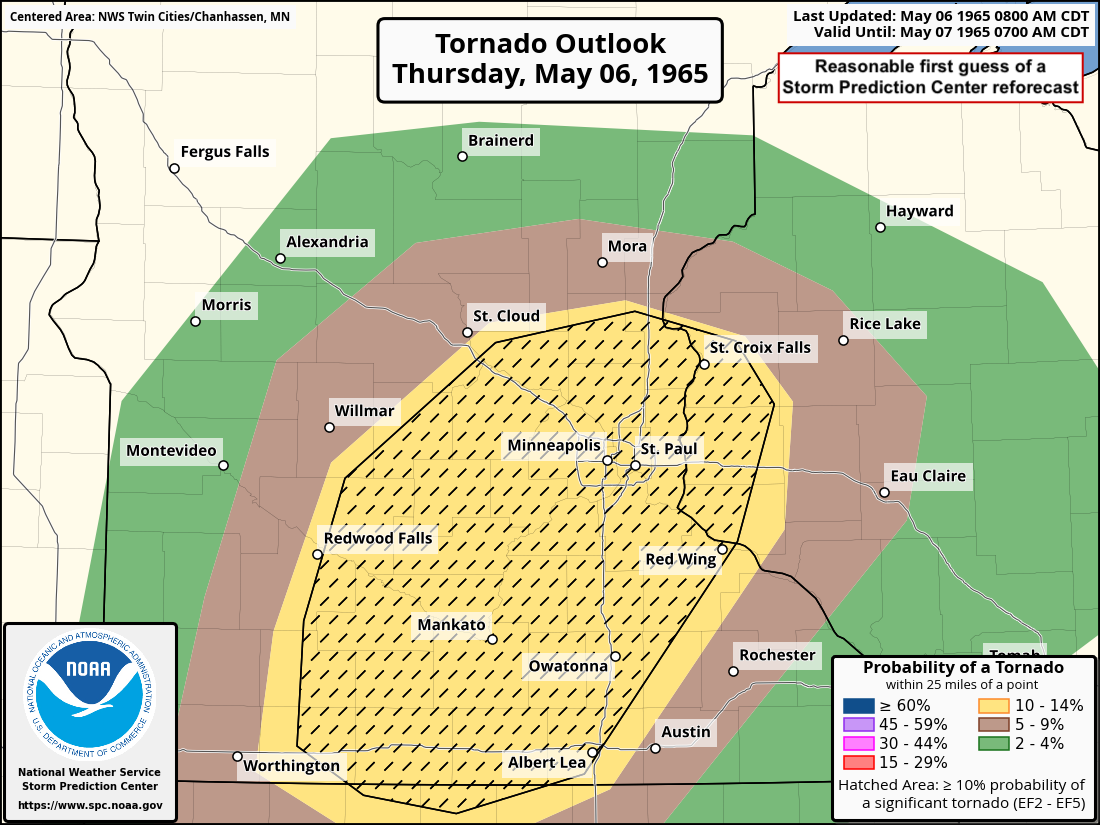
In 1965 the Storm Prediction Center did not produce the outlooks that they do today. However, the images below are a mock-up of what a potential outlook may have looked like from that event. Images courtesy of the Storm Prediction Center **Please keep in mind these were created in hindsight with only limited meteorological data**
 |
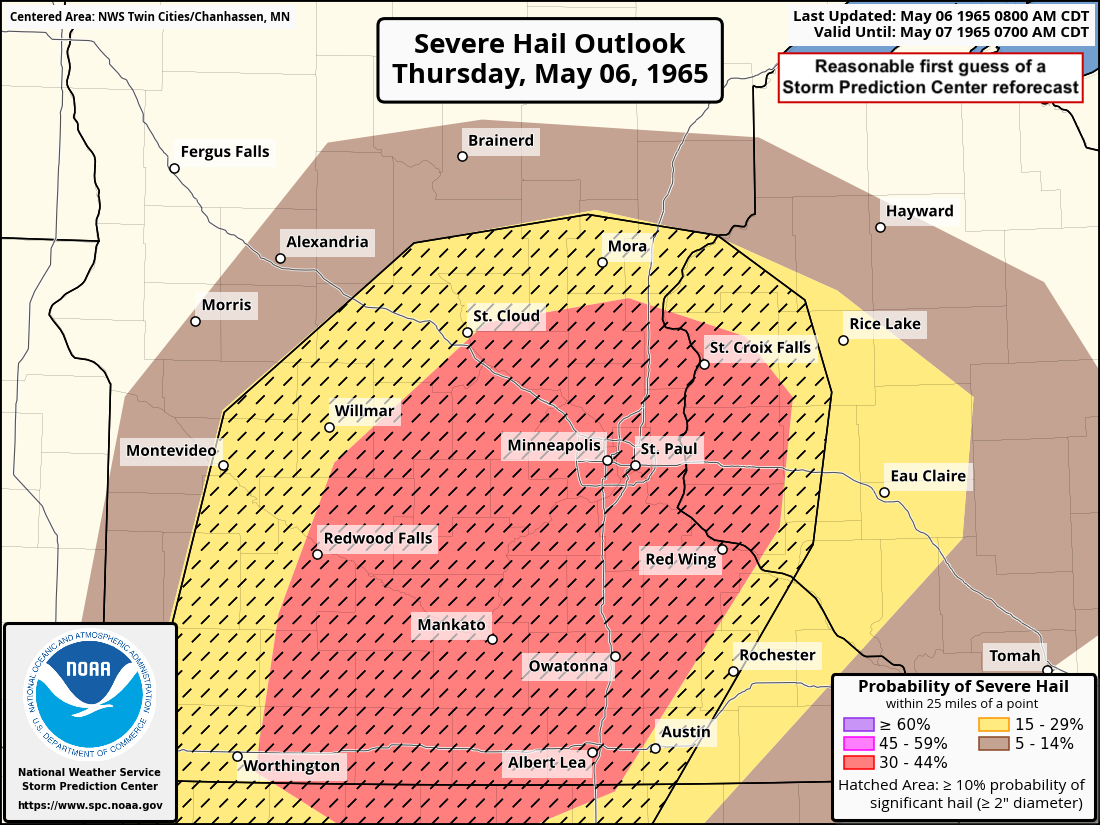 |
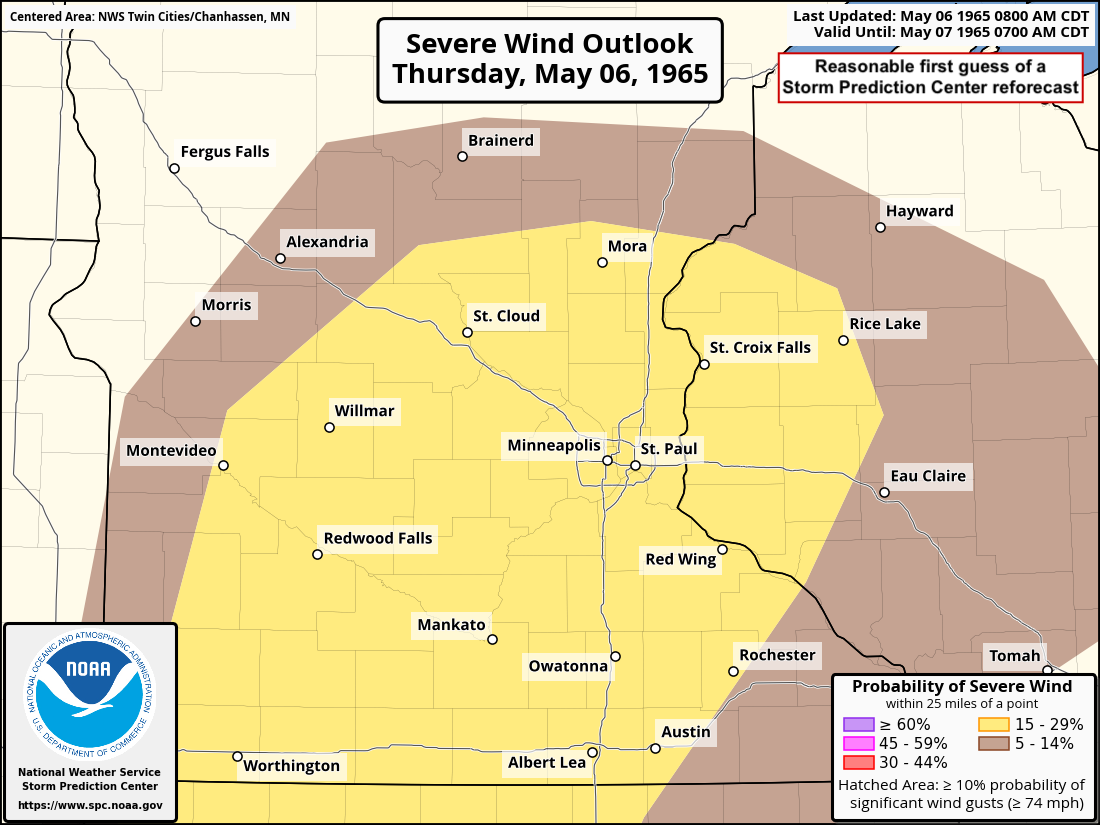 |
| Mock-up of what the Day1 tornado outlook may have looked like from May 06, 1965. | Mock-up of what the Day1 severe hail outlook may have looked like from May 06, 1965. | Mock-up of what the Day1 severe wind outlook may have looked like from May 06, 1965. |
|
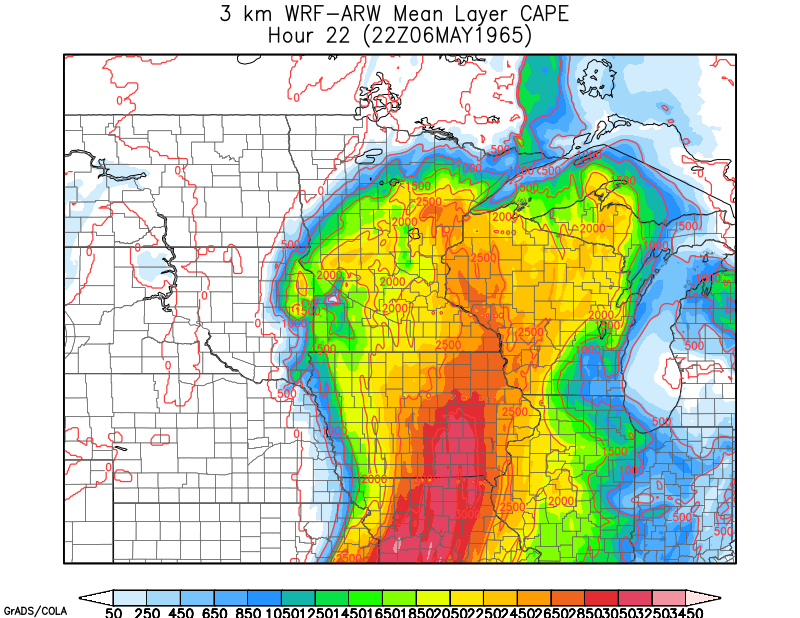
Lastly, numerical simulations based off the limited data from 60 year ago does show a signal for supercell thunderstorms with rotating updrafts. The simulated radar reflectivity loop to the right shows late morning convection across northern Minnesota, followed by late afternoon and evening storms across central Minnesota and the Twin Cities metro. Images and loops courtesy of Tom Hultquist. **Please keep in mind these were created in hindsight with only limited meteorological data**
|
|
.png) |
 |
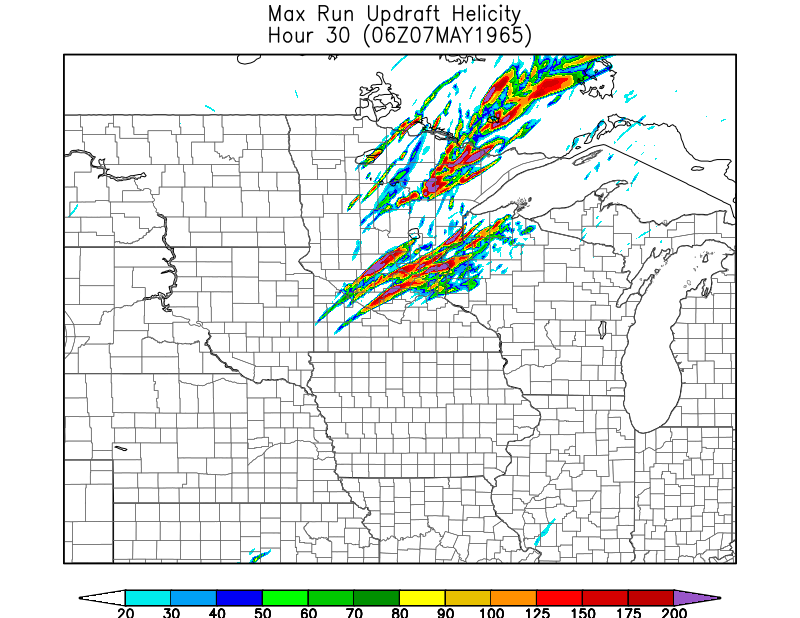 |
| Surface map from 4:00 PM CST showing a warm front lifting through central Minnesota. | Simulated Mean Layer Convective Available Potential Energy (MLCAPE) showing an unstable airmass across the Upper Midwest. | Simulated Max Run Updraft Helicity. This parameter is used as a proxy to identify the potential for supercell storms that have rotating updrafts. Notice the long tracks in the simulation across central Minnesota that match up with the tornadoes that occurred there. |
Interview
For the 50th anniversary in 2015, the NWS spoke with Dean Nesley. Mr. Nesley was on duty May 6, 1965 and had a vivid memory of many of the events that evening. The interview was transcribed, with minor edits for clarity. Dean assisted in the radar room and performed many duties that historic evening. Mr. Nesley passed away in 2021.
“I was the radar operator during the day shift. About 10 in the morning, skies were clear, nothing was on the radar, and we had everything taken care of. I knew it was a day that could be very busy.
By 1:00, we started getting just a little bit of stuff on the radar down by Mankato, then at 3:00, it blossomed. Then in just a half hour, it really expanded. I’ll tell you one thing: when the storms started to develop down around Mankato, the radar went from nothing to 30,000 feet in 30 minutes. We told a couple of the forecasters about it. No one was really excited about it, though. By 4:00, though, it was really off and running, coming up the Minnesota River valley.
I had bad news on the radar already, and by 5:00, they brought in Jim Stone, an older guy who was really great on the radar. I think there was one more guy in there. And the phone calls were going crazy. It wasn’t very long after, and Jim had one on the radar. I remember going out to into the forecast room and told the forecasters, “hey, we’ve got a hook out there, and they were a little bit reluctant to do anything, because the siren box had never been used before. And we were all debating whether to turn on the sirens for the cities. The lead forecaster had the responsibility to activate the sirens and was the only one who had access to the key to turn it on. I believe it was Neil Lampi that day. They did activate the sirens. (Editorial note: siren activation by the Twin Cities NWS ended in the 1980s, and since that time, they have been activated by county and city public safety officials).
We were getting reports all the way from Mankato of high winds, but I don’t know if there were any touchdowns. Then a tornado did come down by Chanhassen, and we did get a report of a lot of damage. And I was watching over Jim's shoulders, and we were alerting the Highway Patrol downtown, and that it was well on the ground by that time, heading toward Minneapolis.
We didn’t know what it meant at the time, but the storms were taking a 30 degree turn to the right. Anyway, we turned the camera down to the 25 mile range, which we rarely did, but at one time, Jim said we had 5 tornadoes on that scope at one time.
We were very, very busy and there were a lot of news reporters in there asking for access to the radar room, and as fast as they would try, we would tell them to get out and say we’re sorry.
I stayed until about 1130 pm. We were doing our jobs.”
Timeline
The WCCO-AM Radio tapes were preserved and digital copies are available online. They were painstakingly transcribed by Jim du Bois, then President of the Minnesota Broadcasters Association. Mr. du Bois kindly provided the timeline, reproduced here. The timeline begins at 1800 (i.e. 6:00 p.m. CST).
The staff at WCCO-AM saved countless lives that evening, as stated by the U.S. Weather Bureau in Minneapolis. Newsman Dick Chapman anchored the announcing duties, and many staff assisted that evening, including Charlie Boone, Rob Brown, and Bob Tibbitts. It was said to be a new way of broadcasting. Before, they would report tornado damage after the fact. On May 6, 1965, however, they were providing live coverage as the tornadoes were in progress, telling people to take shelter. The station received numerous prestigious awards, but in his obituary, it was written that Dick Chapman said “my prize possession is a torn piece of paper from a grocery bag with a message printed in crayon that said: ‘Dear WCCO Radio, Thank you for saving our lives.’ It was signed by nine cub scouts who survived in a school basement while the funnel demolished the building over their heads.”
1800—Tornado Forecast issued for portions of extreme north central Iowa, most of southwest, south central and portions of eastern Minnesota and portions of northwestern Wisconsin
1830—Tornado Warning issued (“we are activating the Civil Defense take cover siren”)
1909—Report of sighting of tornado in Carver County near Hamburg/Green Isle moving toward Norwood (sighted at 1900) another sighted by Delano police touching down at Glencoe and another just east of Lester Prairie
1910—public report of tornado near Waconia heading towards Twin Cities; also public report of tornado near Shakopee heading towards Twin Cities
1910--listener near Excelsior describes extensive damage off of Highway 7 in Christmas Lake area (houses, trees, cars damaged; power out)
1912—Hennepin County Civil Defense calls for all volunteers to report to HQ immediately
1913—reports of heavy winds and hail in Coon Rapids; also trees down at 43rd and Main
1913—listener report from Deephaven describes damage in Cottagewood (houses leveled; boat works severely damaged; power lines down—occurred earlier)
1915—WCCO’s John Walker reports from Wayzata in vicinity of Hwy 12 & County 15; Civil Defense of Hennepin County is mobilized; ambulances have moved in; evidence of wind damage
1916—Counties warned for danger of tornadoes next hour or two: Northern Hennepin County, Isanti, Anoka, Chisago, Polk, St. Croix, Washington, Carver, Burnette, Pine
1916—Recap of initial Tornado Warning with sighting in Lake Minnetonka area. WCCO's Dick Chapman says it moved as far north as Golden Valley and to possibly New Hope/Brooklyn Center
1917—Listener in Excelsior (3/4 mile east of Hwy 101 & about mile south of Hwy 7 near Glen Lake) spots funnel; says two funnels at first merged and then separated; described it as “very weird looking thing”; now third funnel is merging with the others
1920—Second caller in same vicinity at Hwy 101 south of Chanhassen reports funnel directly NW of his location—it’s the second funnel of the night he’s sighted (first was 45 minutes earlier)—moving toward Excelsior—
1921—Flying Cloud airport reports funnel 15 mile west of Minneapolis moving northeast
1922—Chanhassen caller says funnel just west and north of Excelsior
1922—Tornado has hit Chanhassen causing damage but no injuries (Frontier Lumber damaged as well as other businesses and residences)
1924—radar indicates strong cell over northern Minneapolis suburbs moving northeastward but no hook is apparent
1925—caller (Robert Park) reports of tornado that passed through Fridley damaging Fridley Junior High School but causing no injuries to people attending spring carnival. Caller was in car in parking lot and his windows were blown out on one side
1926—Weather Bureau reports 3 apparent tornado cells about 20-30 miles due west of Twin Cities International Airport and two cells 15-20 miles north of airport
1927—caller from Brooklyn Center saw funnel looking eastward (stated two clouds formed together/merged) & saw funnel hit in Fridley (he is in NW Brooklyn Center); reports larger than golf ball-size hail at his location
1928—caller from St. Anthony Village (NE Minneapolis) saw “two tails” in clouds come together and move north (occurred 3 minutes earlier)
1929—caller saw from Marshal Ave the funnel that hit Fridley
(Station ID)
1929—caller west of Glen Lake (on Excelsior Blvd) sees tornado to his south in vicinity of Flying Cloud airport moving west
1931—caller from NE Minneapolis states he was just west of Northern Pump on Hwy 100 & crawled under railroad bridge while observing two funnels damaging 100 Twin Drive-In Theater on Hwy 100 near University Ave (his was one of 7-8 cars sheltering under bridge while tornado went overhead)
1933—caller from Midway area in St. Paul near Snelling and University spotted funnel overhead 3000-4000 feet and slightly to his west; funnel was “hanging down” and appeared to be over Minneapolis
1936—caller from Mound (Orono Village on Hwy 19) reports heavy hail. Saw one “cyclone” form and then retreat into clouds
1937—Weather Bureau radar indicates hook echo over Lake Minnetonka just south of Wayzata
1938—caller one mile north of Snelling and University saw funnel 3 minutes earlier that has since disintegrated
1945—all Northern State Power crews report to Minnetonka Division HQ immediately
1946—Weather Bureau radar reports intense hook echo (“a definite tornado”) between Cologne and Carver moving toward Victoria
1947—caller from Wayzata reports “strange green light” near Wayzata High School approaching from SW; winds are picking up
1948—WCCO’s John Walker reports from Wayzata on County Road 15 (where they “earlier experienced tidal waves”); tornado hit while he was in Brown’s Bay boat works
1949—caller states tornado hit 1 ½ miles north of Wayzata on 101 (minute and a half ago) moving up 101 heading north; his house has blown out windows but he did not see tornado but noted “terrific winds”
1954—Sherriff’s deputy at County Road 6 & Highway 101 1 mile north of Wayzata sighted funnel moving to the north but did not see it touch down (estimated 400-500 feet in air); states it’s heading toward Maple Grove and is only visible when lightning is present
1955—caller north of Wayzata states he drove down main street and witnessed large amounts of water blown on roads; his car was “blown up the hill” and had to apply breaks to slow it; no power in Wayzata; almost continuous lightning
1956—confirmed tornado touchdown in Spring Lake Park; considerable damage; struck 45 minutes earlier
1956—caller at Highways 101 & 7 reports funnel 7 miles south of his location in Shakopee vicinity
2000—on-air confusion over whether Spring Park or Spring Lake Park was hit by tornado
2001—searchlight in operation near Glen Lake
2003—caller states funnel passed over the west edge of Brooklyn Park near Eagle Lake near County 18; was “bouncing” & heading towards Osseo
2003---all available doctors report to Mercy Anoka Coon Rapids Hospital
2003—tornado strike at Spring Lake Park confirmed
2004—semi-trailer overturned at Highways 65 & 10
2004—police report funnel over Southdale (report came from 94th and Normandale); caller from Hopkins confirms that funnel is towards Edina moving to NE; “still pretty high in air” & heading towards Minneapolis
2007—caller reports funnel over Southdale moving east between Hwy 62 & 494 & between 66th and 78th and France; “quite high in sky”; tail is draping on diagonal trajectory; caller at 6335 Peachdale Ave near Hwy 62
2009—police report funnel 2 minutes earlier in the 6800 block of 10th Ave S moving towards Lake Nokomis
2010—caller near County Road 18 & Excelsior Blvd in Hopkins reports funnel to southeast moving west-northwest; “horizontal funnel, very white”
2011—Minneapolis police report funnel high above Lake Nokomis moving northeast
2013—Minneapolis police say funnel is now moving westerly; warn people in Lake Calhoun & Lake Harriet areas
2013—WCCO Radio announcer Jim Hill states that he saw two different funnels from his home near Southdale off of 62 Crosstown: “long funnel, very high in the air”
2015—caller from Lake of the Isles at 26th Street states funnel passed over house; horizontal funnel
2016—safety rules and Station ID
2020—caller states she saw funnel over Lake Nokomis from her location at East 55th Street and 31st Ave
2021—extreme damage reported on Osborne Road in Blaine Village; call from Southdale area says funnel has dissipated
2021—caller from Midway sees funnel forming (“two clouds connected in middle up in the air”) from his location near Hamline and Minnehaha; funnel was NNW of him
2022—Highway Patrol asks motorists to stay off Hwy 65 into Anoka County
2024—caller from Columbia Heights spots funnel moving NW
2026—Station ID
2026—Anoka police report no damage in Anoka; need for doctors is in response to injuries in Fridley and Spring Lake Park; both “hit hard”
2027—caller from Bloomington says funnel is setting down 3 miles east of Southdale and is approximately 500-1000 feet off of ground (just north of Bloomington outdoor theater) & moving “swiftly” NE heading towards St. Paul
2029—St. Cloud Weather Bureau reports possible tornado at Clear Lake just south of St. Cloud; new counties added to Tornado Warning area: Sibley, Scott, Le Sueur and Northern Dakota counties
2030—report of damage in Glencoe; mink farm hit with many dead mink; cars blown off road; injuries; also Hwy 12 blocked with trees and wires 4 blocks west of Wayzata
2031—reports of wind in Lake Minnetonka area
2031—caller confirms funnel sighting in Bloomington over outdoor theater (calling from 81st and 2nd Ave near airport) moving towards the east; “quite high”
2032—Mercy hospital reports that more than 25 people have been injured in Fridley and Spring Lake Park (nature and extent of injuries not reported); tornado hit Spring Lake Park approximately 1915; at Fridley, roof of high school damaged; spokesperson at Mercy Hospital says they are too busy to count the number of injured; Weather Bureau radar shows strong thunderstorms with possible funnels aloft/tornadoes over Le Sueur, Sibley and Scott and Northern Dakota counties; rain and hail 5-10 miles east of Brainerd moving NNE
2034—report from Loring Park (Spruce Place) in Minneapolis that man hid in closet and heard “tornado-like noise”)
2035—caller from Golden Valley reports clouds formed “cone-shaped funnel” that is moving north from Hwys 55 and 100
2036—Station ID and storm safety info
2038—caller reports what might be a funnel moving down Franklin Ave in Minneapolis though he’s “not sure”; reportedly 500-600 feet in air
2038—caller from Columbia Heights (46th and Johnson Street) reports funnel over Fridley (1-2 miles away from his location); it’s “a real big one”
2041—WCCO’s Sherman Schultz calls in with report of being hit by tornado at Anoka County Airport. Reports all planes parked outside are damaged or destroyed. Planes tossed 100 feet in air. Saw tornado.
2041—caller from St. Anthony Village states tornado near Columbia Heights/Fridley area; large funnel; (states it’s 8-9 miles northeast from his location) reports that it dissipated while giving his report
2046—caller from 36th and Van Buren by Columbia Golf Course states tornado sighted NE of him 10 minutes earlier
2048—at least one fatality has been reported; no details available
2050—report of damage east of University Avenue and north of 40th
2052—caller from 50th and Aldrich N reports damage to roofs, fences, windows etc. occurred 5-6 minutes earlier; area hit was north of Camden in Minneapolis. Thought it was tornado but not sure
2056—report of turbulence & wind vicinity Hwys 65 & 100. Same in New Brighton (occurred 3-4 minutes earlier)
2058—radar at 2045 (13 minutes earlier) indicates broken line of thunderstorms, many of which are heavy, extending from northwest of Duluth southward over the Twin Cities then southwestward to the Iowa border. Average width of the line is about 30-40 miles moving very slowly eastward. No hook echoes are apparent indicating a lessening of activity. All counties should remain alert for severe thunderstorms or possible additional tornado activity.
2059—caller from south Minneapolis sees funnel to the north in New Brighton area. Reports another “finger hanging down that’s east of the big finger”; “two fingers hanging down”
2059—reports of ground damage in north Minneapolis and suburbs to the north of Minneapolis
2100—caller near Hwys 100 & 52 watching funnel heading toward Coon Rapids area (saw it 2 minutes ago earlier) and described it as a “finger hanging down”; saw large and small funnels
2102—Station ID
2105—recap of damage reports—less likelihood of tornadoes after dark
2108—tornado on ground in Shoreview moving east; separate caller from Washington County (location about 3 miles west of Lake Elmo and about 2 miles south of 36) states there are two funnels he can see; looks like one over Stillwater; the two are side by side & not touching ground
2109—caller from St. Anthony saw tornado about 10 minutes earlier heading NE towards Forest Lake; “big one touching ground”
2110—caller north of St. Anthony sees funnel close to ground heading NNE
2111—Downtown Dayton’s will stay open to shelter shoppers
2112—caller from Flying Cloud says all planes OK & storm seems to be over; stated he and coworkers saw 5-6 tornadoes pass by; calling from Nelson Ryan
2115—caller from Stillwater watching funnel on Wisconsin side of St. Croix River
2117—Burnsville police report severe lightning…house is burning
2119—caller from Washburn and 75th near 494 & Met Stadium sees funnel 1.5 miles west of his location near Penn Ave by Mann Theater just south of Richfield
2128—WCCO’s Charlie Boone states the previous reports of funnels in southwest Minneapolis are inaccurate; squall line but no funnels
2133—Station ID
2133—WCCO’s Chuck Lilligren in mobile unit at 49th and Camden in north Minneapolis reports “severe wind damage” in area; eyewitness states the storm struck about 30 minutes earlier and “sounded like a train”
2135—Phone circuits are becoming overloaded; no unnecessary calls
2135—John Walker reports from Wayzata on family that heeded radio warning and sought shelter in basement; their home near Lafayette Bay on County 15 just west of Minnetonka Beach destroyed; Walker states “idle curious are beginning to come around and are not helping much”
2140—police advise to stay away from University Avenue and Hwy 100 and 50th and Lyndale areas; debris blocking roads
2142—Lilligren in mobile unit proceeding north on Lyndale; trees, signs, fences all damaged; not much damage to homes; states the damage occurred on “scattered blocks in the area” and is not continuous in coverage
2145—mobile unit in Chanhassen reports that area just north of business district “hit hard”; damage to Frontier Lumber Company and Jerry’s Mileage station; estimated 90% of homes in Scholler & Near (SP?) housing development damaged
2148—1/2” hail reported in Edina
2149—emergency shelter/staging area established at Highways 10 & 65
2149—police warn sightseers to stay away from North and Northeast Minneapolis
2150—caller from Noble Avenue and Golden Valley Road reports on tornado damage that occurred 45 minutes earlier; windows in house broken and “part of somebody’s house crashed through my basement door”
2151—report of first known fatality: 56-year-old Ray Perbix of Norwood; in barn at time tornado hit; body thrown 100 feet; very heavy damage in Norwood area, 15 homes destroyed and 30-40 barns damaged
2157—damage report from 42nd and Humboldt Ave N—trees down, garages wrecked, houses with broken windows, boat tossed in yard
2159—Hennepin County Sherriff states sightseers are hampering rescue efforts; stay away from damaged areas
2204—1/2” hail reported in Hopkins; ping pong ball size hail in St. Anthony Village & fallen trees/power lines are blocking streets
2205—report that “most—if not all—routes to the north, south and west of the Twin Cities are blocked by debris”; Highway 12 closed in many places in Lake Minnetonka area
2206—Station ID
2206—report of “several million dollars in damage” at Northern Ordnance in Columbia Heights
2207—strong thunderstorm moving towards White Bear Lake with large hail and high winds
2210—caller from Fridley Terrace trailer park reports severe damage from storm that hit 10 minutes earlier; states that he did not see funnel but his wife “thought that she did”; address is 74th and Lexington
2214—Fridley Junior High School teacher reports that they are trying to drive children at the school home but most roads are blocked; describes areas between University Avenue and Highway 65 and south of Highway 100 as far north as 61st or Rice Creek are heavily damaged; the Junior High is severely damaged as are Parkview and Hayes; High School also damaged
2218—Lilligren reports from Northern Ordnance calling it an “awe inspiring sight”; facility is severely damaged; high-tension towers are “bent completely over”; fencing is down for “hundreds of yards”; cars are blown off of nearby highway; states they did not encounter the storm that hit Fridley Terrace earlier
2223—report that Fridley Terrace “hard hit with trailers flattened”; severe damage reported in Navarre
2224—at least two persons killed by storms and 50 injured; Ray Purvis (different spelling than previous report) of Norwood and Mrs. Alma Grinde killed in Spring Lake Park; doctor at Mercy Hospital in Coon Rapids reports 50 people being treated there and at least 25 in critical condition
2227—WCCO’s Dick Chapman speculates that damage at Fridley Terrace “must have been highly localized” since Lilligren at Northern Ordnance did not experience that storm
2228—1 ½” hail in Burnsville
2229—caller with relatives in Spring Lake Park can’t reach them as lines are down in the area; states that she called Mercy hospital and was told that rescue workers cannot reach victims because of sightseer traffic
2230—Station ID
2233—“strong hail” reported near Knollwood Plaza in St. Louis Park
2233—John Walker reports that he “just came through Navarre…I mean what was Navarre. Navarre no longer exists, at least the crossroads of County Roads 15 & 19.” Area is “completely leveled.” Houses on Casco Point “severely damaged”
2236—hail moving from Burnsville towards Eagan Township in direction of International Airport
2237—caller from New Brighton reports ½” hail with heavy rain and winds occurred 2-3 minutes earlier
2243—caller from Robbinsdale reports 1 block stretch just west of North Memorial Hospital along Chowen Avenue between Lowry and Oakdale suffered damage; garage demolished, church damaged and roof torn off house; Chapman again notes the “spotty” nature of some of the damage reports “indicating the bouncing effect of tornado funnel”; he also notes that windstorms can produce similar damage patterns
2244—caller in Hopkins reports that he drove in from Hector through Glencoe on Highway 212 & then along Highway 5 to Highway 7 and “crossed the paths of 4 tornadoes. One just outside Glencoe, two around Norwood, one between Waconia and Victoria and another on Highway 7 just east of Christmas Lake.” (Note: he says he crossed 4 tornado paths but describes “two around Norwood” bringing the total to 5.)
2246—police report three persons killed in Island Park area on western edge of Lake Minnetonka with dozens still trapped in wrecked homes. Report of 60 injured at Spring Lake Park and Mounds View, many in critical condition
2250—golf ball size hail in West Bloomington
2251—1” hail in Northeast Minneapolis
2252—caller reports that Holly Center at University and Mississippi is severely damaged; new fire station is “gone”; National store has front blown in; along Mississippi Street from Holly Center to Highway 65 “almost all the houses are damaged or destroyed”
2254—thunder and lightning at Glencoe; Weather Bureau radar indicates broken line of thunderstorms about 50 miles wide from the Faribault and Norwood areas northeast to Lake Superior moving northeast at 35 mph. No hook echoes are apparent although tornadoes may still occur along with heavy thunderstorms with hail and strong winds. If the present movement continues, the activity will move out of the Twin Cities area around midnight. If so, the all clear will be issued. The Tornado Forecast for northwestern Wisconsin has expired. A few locally heavy thunderstorms with hail and strong winds may occur from north of Alma, Wisconsin to Iron Mountain, Michigan until 1 a.m. Central Daylight Time.
St. Croix County Sherriff’s Office reports a funnel was sighted 6 miles north of Hudson earlier and was last seen between Holton and Somerset.
2258—very heavy rain and golf ball size hail at Bush Lake in Bloomington
2258—Station ID
(There is a 51 second gap in coverage here, either due to a delayed tape change or a portion of the broadcast being edited out)
2259—WCCO engineer in mobile unit states that he can readily see the tornado path from Camden in North Minneapolis through Fridley. He describes it as being “straight as a string”
2300—report of heavy damage at Fridley Terrace trailer court; houses are “completely gone” in the Melody Manor subdivision in Fridley at 71st and University; Spring Lake Park north of Osborne Road hard hit
2304—heavy hail in Edina
2305—Lilligren reports from command post at Highways 10 & 65; injured continue to be brought in and house-to-house searches are underway; no power in area; ambulances are coming and going; hospitals in suburbs are full and injured are being sent to hospitals in Minneapolis and St. Paul; Hill View area of New Brighton hard hit; residents should check-in at Hill View Apartments
2309—heavy hail at Blake Road in Hopkins; heavy rain in downtown Minneapolis
2311—heavy rain and hail at University of Minnesota (“worst of the evening”)
2314—Minneapolis Police will begin tagging all people in North Minneapolis starting at 11:30 p.m. who cannot prove that they live in the area
2322—WCCO’s Bob Potter reports from Golden Valley Fire Department and says there is extensive damage starting at Highway 55 and Douglas Drive and extending northeastward across Golden Valley. Damage track is 6-7 blocks wide. Firemen believe 2 tornadoes went through city. (They saw one.)
2325—caller from Christmas Lake area states that he saw a tornado at 1810. He observed it on the ground from Highway 5 to Highway 7. It hit Lotus Lake. Does not believe it is the same tornado that hit Cottagewood.
2336—7 now known dead, 5 of whom have been identified
2339—mobile unit report at Mercy Hospital states 81 patients have been admitted from Spring Lake Park, Fridley and New Brighton
2339—report from U of M area of “Little League baseball size hail” that occurred 15 minutes earlier
2341—caller from Circle Pines reports power lines down at Highway 8 and County Road J with heavy rains and hail (occurred a few minutes earlier)
2343—caller reports damage on the south side of Island Park
2345—attempt to locate 4-year-old Gregory Magsan, missing in the Mounds View area (he was one of the fatalities in the Lois/Knoll Drive area of Mounds View)
2346—caller from Bloomington says he can see the moon and the skies are beginning to clear
2351—all personnel of Company C, 1st Battalion, 135th Infantry ordered to report to East Side Armory in St. Paul immediately
2351—caller from Island Park (Vincent Bernard) states two tornadoes hit the area, one on the east side of the island and the other on the west side. One of them (the same one that hit Navarre) picked up his car with him in it and dropped it in Lake Minnetonka about 100-150 yards from shore. He says the storm hit with “no warning and no sound.” It sank in 20-25 feet of water. His watch stopped at 1941. Says the car rolled “on a different axis from the twister” as it was carried aloft. Says it was rotating around a horizontal axis. Chapman observes that “people who study tornadoes will want to talk to you.”
2358—Weather Bureau issues all clear. No further severe weather expected in Twin Cities. Radar indicates main band of storms now just east and northeast of Twin Cities extending towards Lake Superior.
 |
Media use of NWS Web News Stories is encouraged! Please acknowledge the NWS as the source of any news information accessed from this site. |
|


 WSR-57 radar loop from May 06 1965 showing several storms with supercell structures (reflectivity hook) moving across the region.
  WSR-57 radar loop from May 06 1965 showing several storms with supercell structures (reflectivity hook) moving across the region.