Weather-Ready Nation Marine Ambassadors February Feature:
The National Data Buoy Center (NDBC), part of the National Weather Service, is giving you the SCOOP (Self Contained Ocean Observing Payload) buoy. The SCOOP is an example of recent improvements to oceanic observation capabilities, a requirement for modern weather forecasting models. Large improvements in computer forecast model performance over the past several decades can be attributed to increased computing power, a stronger understanding of coupled Earth systems, and more sophisticated global observation systems.
The SCOOP!
The NDBC SCOOP is the first NDBC payload system that is completely modular. Multiple smaller systems are installed on each buoy. Some systems have meteorological sensors, while others have water temperature and wave sensors. Each system transmits its data via Iridium Short Burst to the ground station in Hawaii, where it gets sent to NDBC servers for processing. Data from each SCOOP is sent every 10 minutes for wind, pressure, temperature, and humidity data and every 30 minutes for wave data.
The messages are held until NDBC receives each small system message, and then the messages are stitched together for one message to be sent to the National Weather Service Telecommunication Gateway for distribution to the public. This process takes about five minutes to complete, from receiving the first system message to sending the final public data message. NDBC receives the final public data message as verification that the data was sent.
Regarding all NDBC buoys, including SCOOP, did you know…
NDBC uses a few different hull sizes: 3-meter discus; 2.3-meter discus; and, 2.1-meter discus. Some are aluminum and some are foam.
Some moorings are more than a mile long! Mooring length depends on the depth of the ocean at the site.
NDBC has redundant sensors for winds and barometric pressure. That way, the station can continue to provide important data if one of those sensors fails.
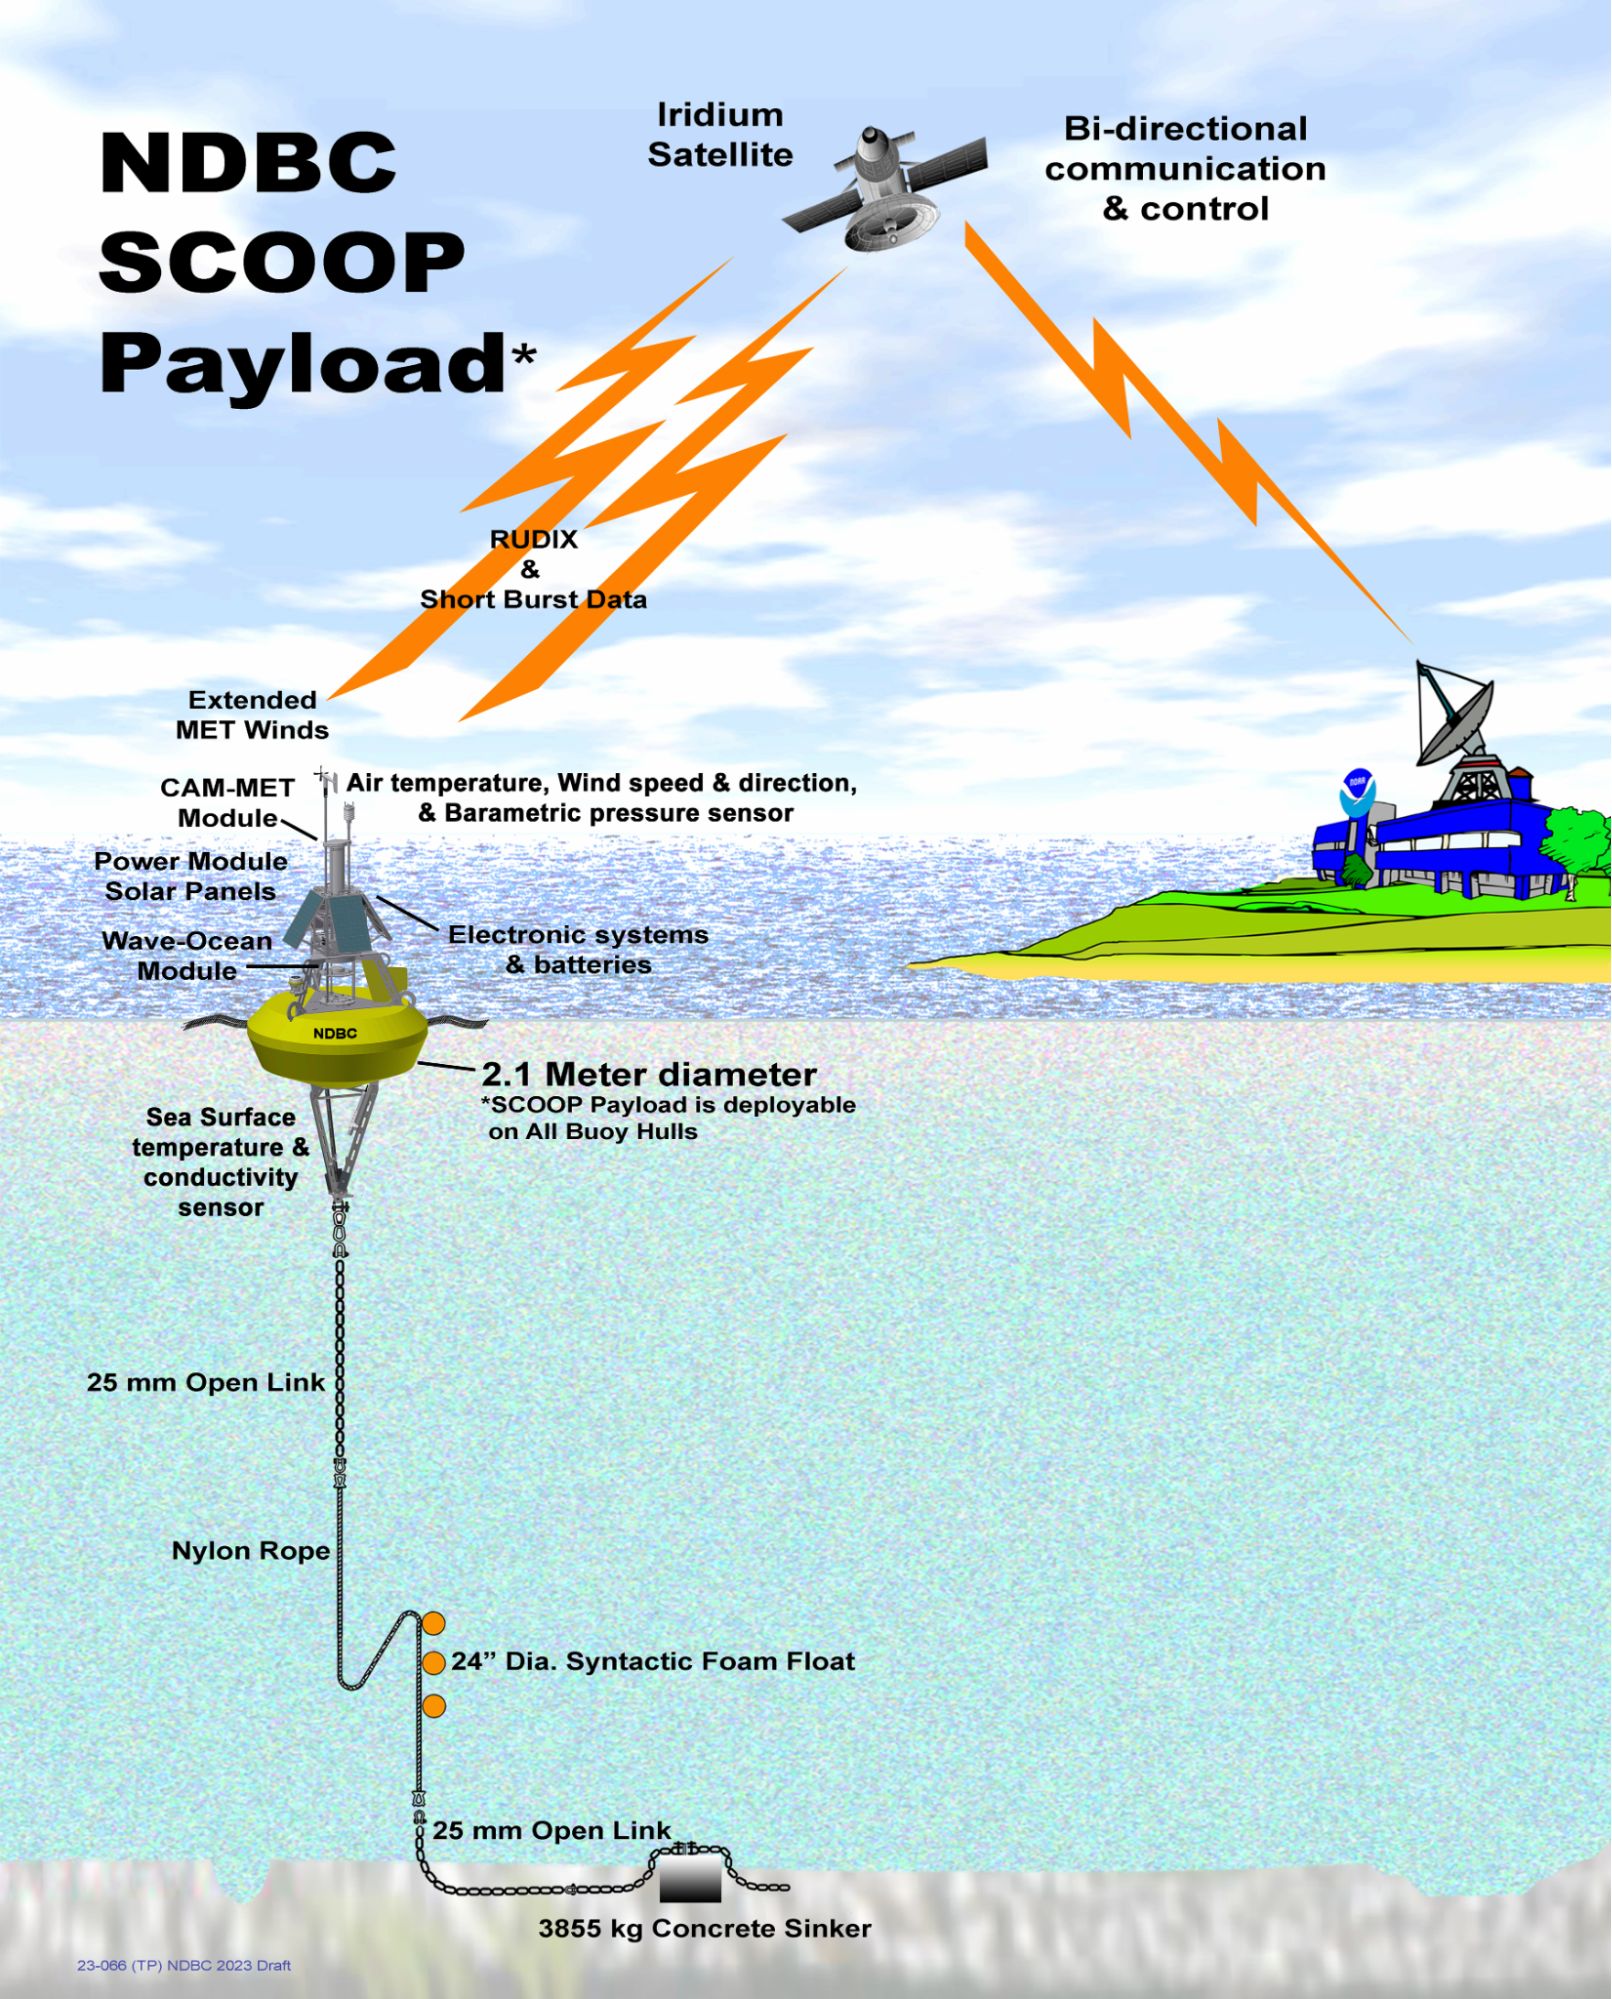
Diagram of the equipment and communications for the NDBC SCOOP buoy
In addition to buoy data, marine forecasters rely on observations made by mariners and their vessels. Marine forecasters use this data to produce and verify forecasts and create analyses of current weather conditions. Observations over the oceans and other marine areas can be quite sparse, so every piece of data is vital in keeping mariner’s lives and property safe over marine areas.
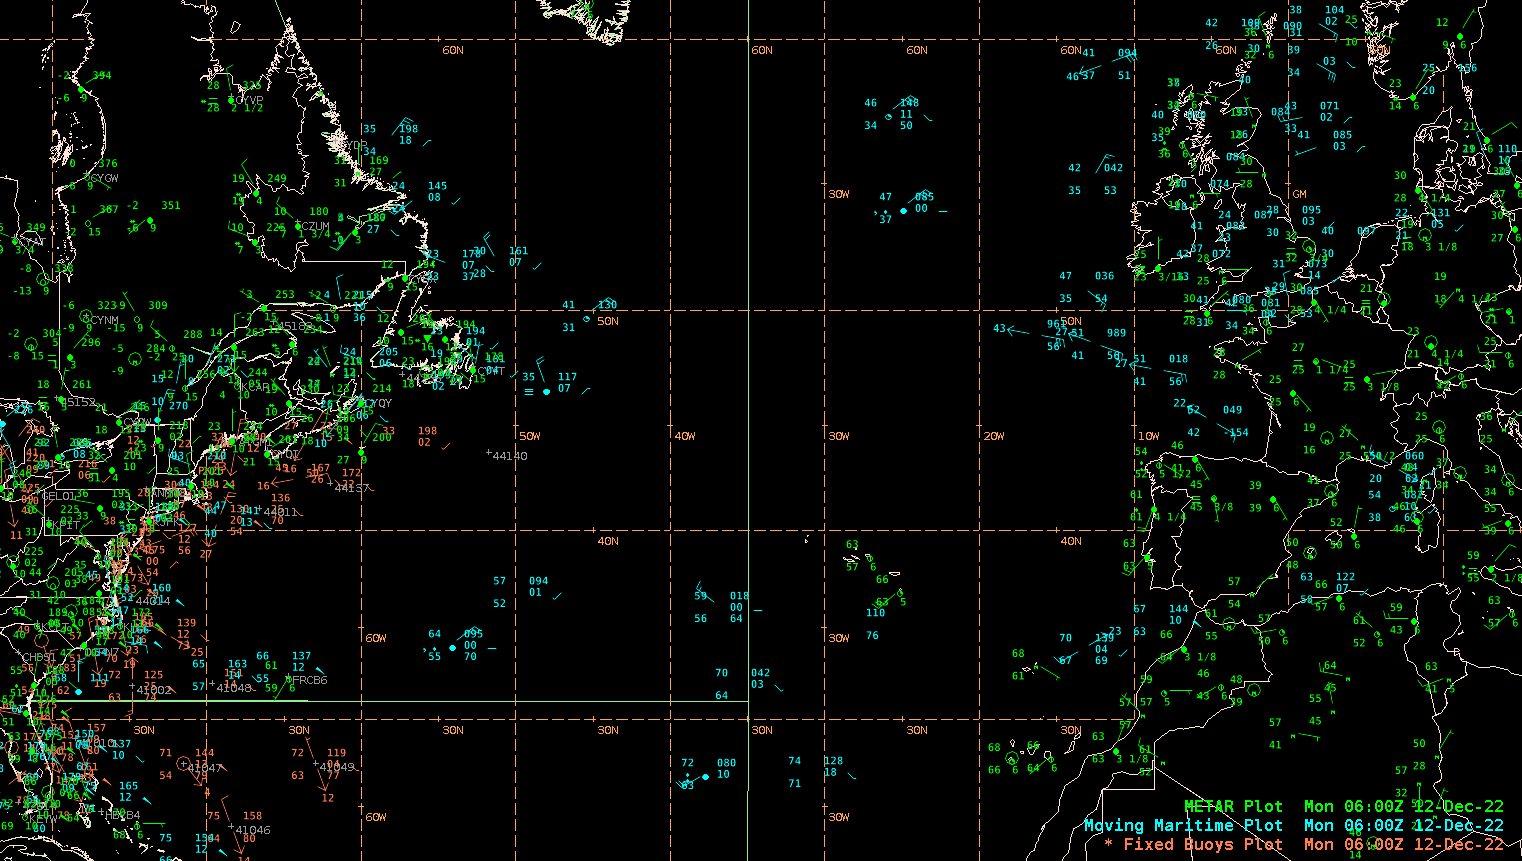
Land observation (green) density is much higher when compared to buoy (orange) and ship (blue) observations over the North Atlantic. Example from 06 UTC December 12, 2022.
The NWS’ Ocean Prediction Center (OPC) compiles all of this data to create a climatology database of hurricane force winds events. Hurricane force wind events (winds ≥ 64 kt) are common over the North Atlantic and Pacific during the colder fall and winter months. These events are typically associated with a strong extratropical cyclone, a post-tropical cyclone, or within areas of strong geographic forcing. Unlike warm-core tropical systems, extratropical cyclones possess a cold core and frontal boundaries, and are primarily fueled by 500 mb vorticity advection and horizontal temperature advection within the atmosphere. A good description of the difference, with examples, is shown in this NDBC article.
In the North Atlantic hurricane force winds events generally peak in January, and are at their minimum in June and July.
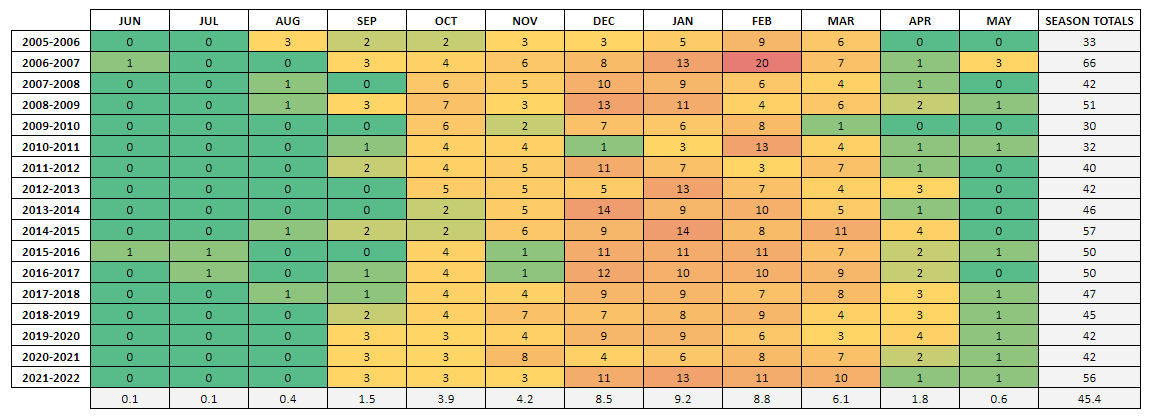
North Atlantic monthly hurricane force wind events quilt from June 2005 through May 2022
In the North Pacific the peak also occurs in January, and the minimum in July.
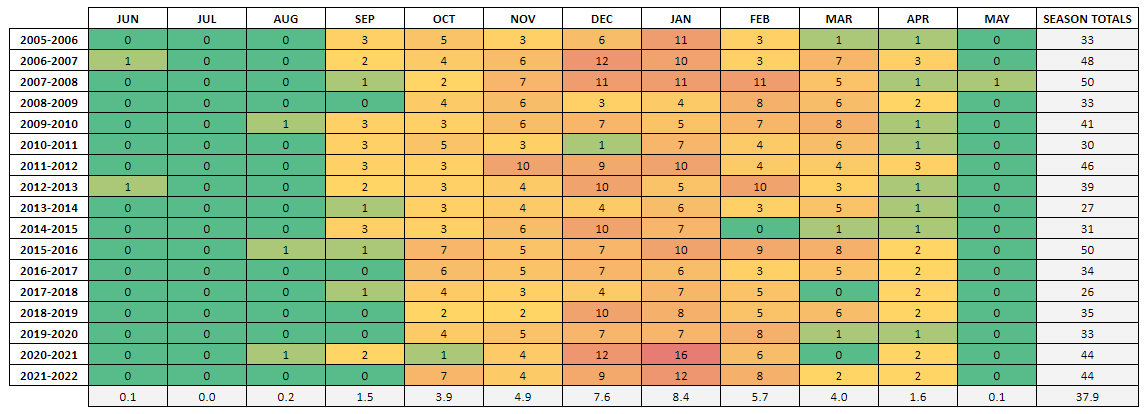
North Pacific monthly hurricane force wind events quilt from June 2005 through May 2022
In the warmer months, hurricane-force wind events are predominantly driven by tropical cyclones that undergo an extratropical transition into strong post-tropical cyclones. Overall, the North Atlantic is typically slightly more active in terms of hurricane force wind events with an average of 45 unique events, whereas the North Pacific has an average of 38 unique events. Be sure to keep abreast of the forecasts for the high seas, and have an avoidance plan ready when needed!
OPC produces a story map annually presenting the most recent hurricane force season, including highlights and how the season stacks up to our climatology records. The most recent and past story maps can be accessed through the links below.
North Atlantic Story Maps:
2021/2022: https://storymaps.arcgis.com/stories/5d24f7b1914f4e1fa825dd48db140fad
2020/2021: https://storymaps.arcgis.com/stories/608b5b390dec433c92dd26b0a7817e44
2019/2020: https://storymaps.arcgis.com/stories/83038d799d7249b68e81be1aa7ff84fd
2018/2019: https://noaa.maps.arcgis.com/apps/MapSeries/index.html?appid=1b961aa22c37424db4cb4a24483dd3a4
2017/2018: http://noaa.maps.arcgis.com/apps/StorytellingSwipe/index.html?appid=cb7868a89c3a46b88c844ade6a13beaf
North Pacific Story Maps:
2021/2022: https://storymaps.arcgis.com/stories/1804ec2305f74b1a84d1ef59c8fcdf91
2020/2021: https://storymaps.arcgis.com/stories/7283fef84fac4ab384b1698812824bb0
2019/2020: https://noaa.maps.arcgis.com/apps/MapJournal/index.html?appid=90a923a6a2964433a1c51be139cbc038&
2018/2019: https://noaa.maps.arcgis.com/apps/MapSeries/index.html?appid=6857ee7eea5a4389ae1556393b61caef
2017/2018: http://noaa.maps.arcgis.com/apps/StorytellingSwipe/index.html?appid=cb7868a89c3a46b88c844ade6a13beaf

