Ohio RFC
River Forecast Center
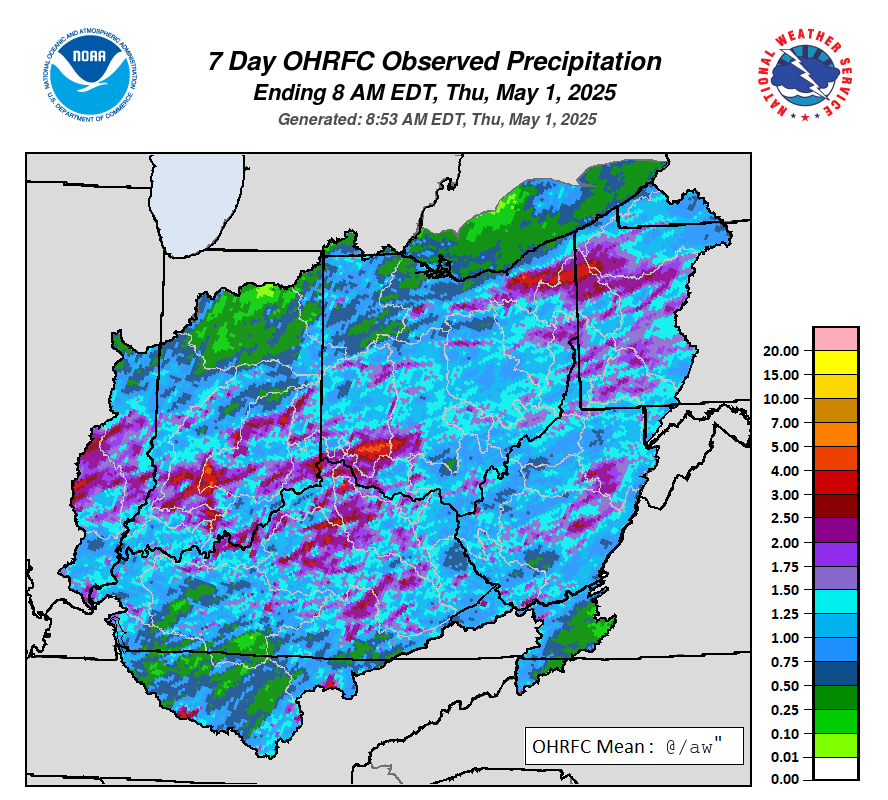
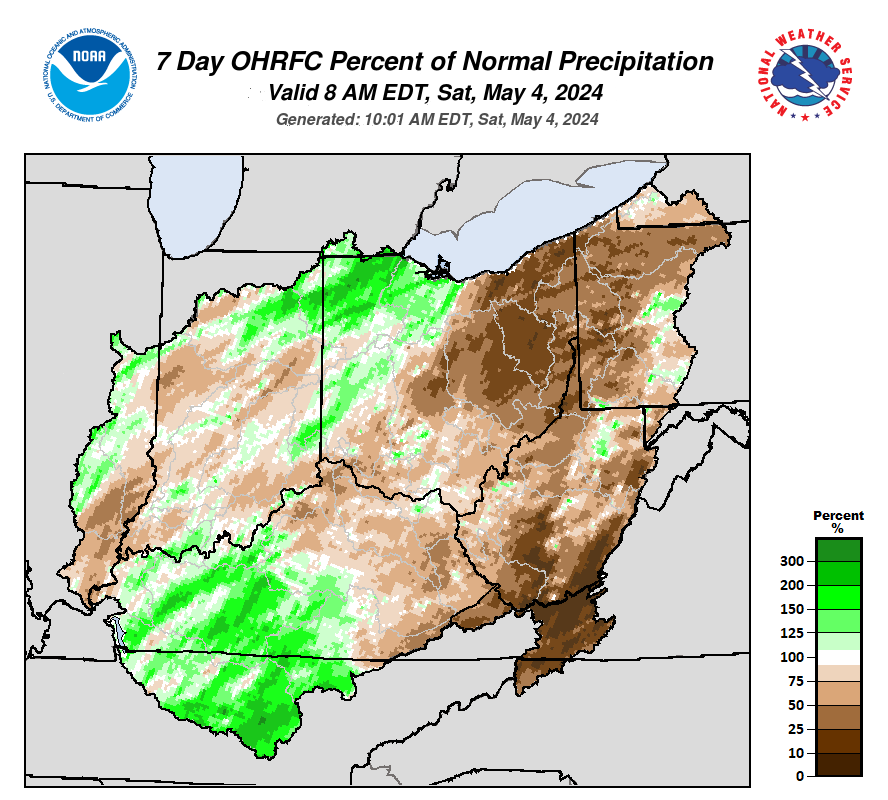
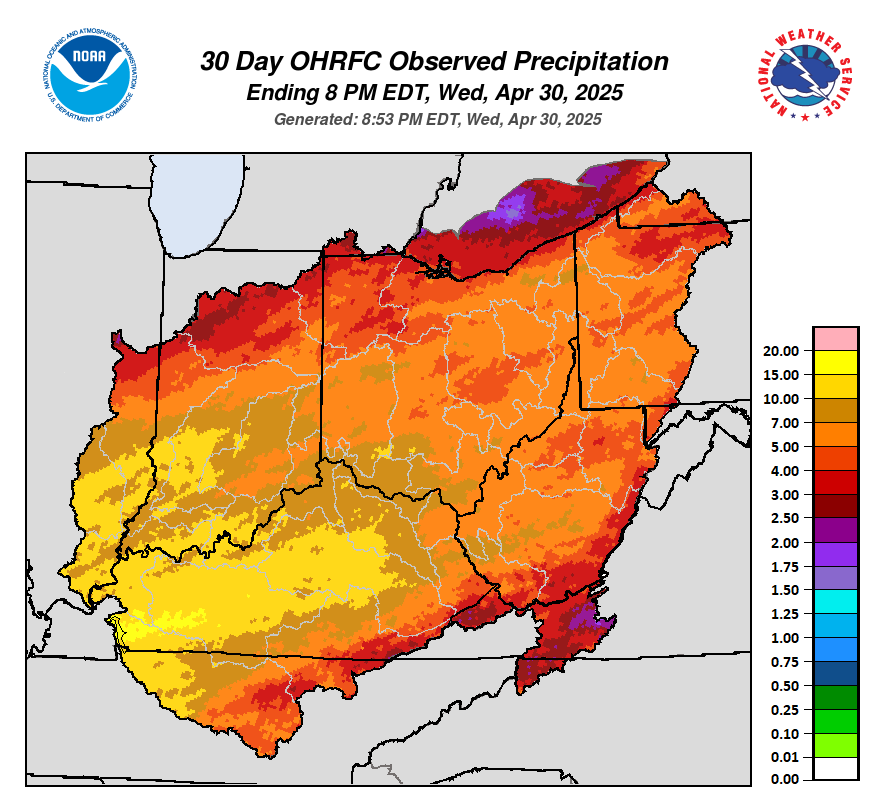
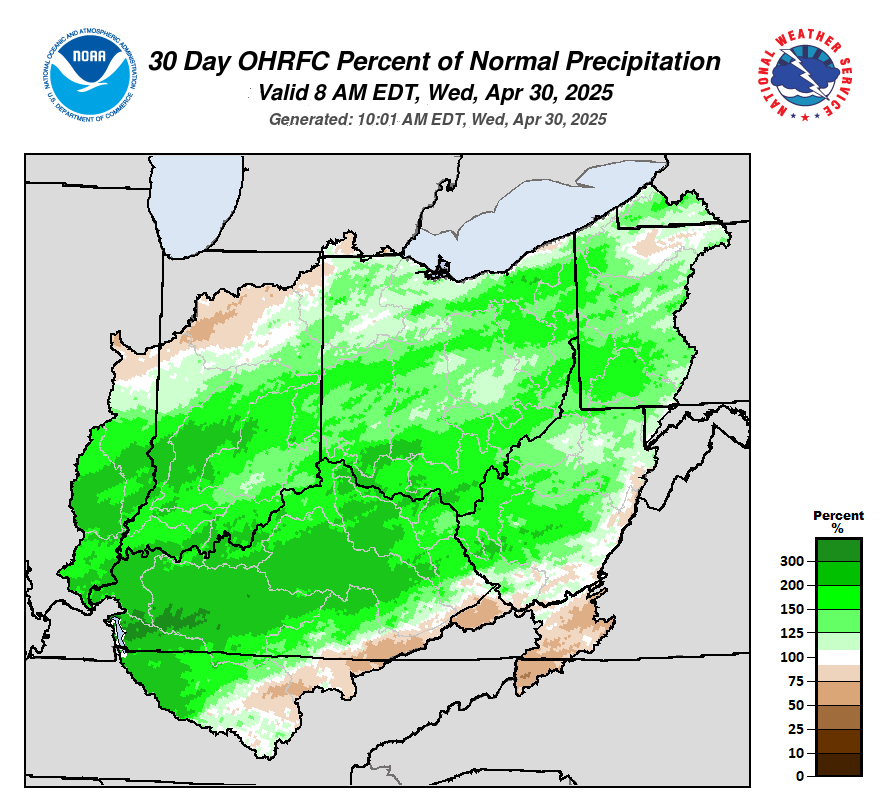
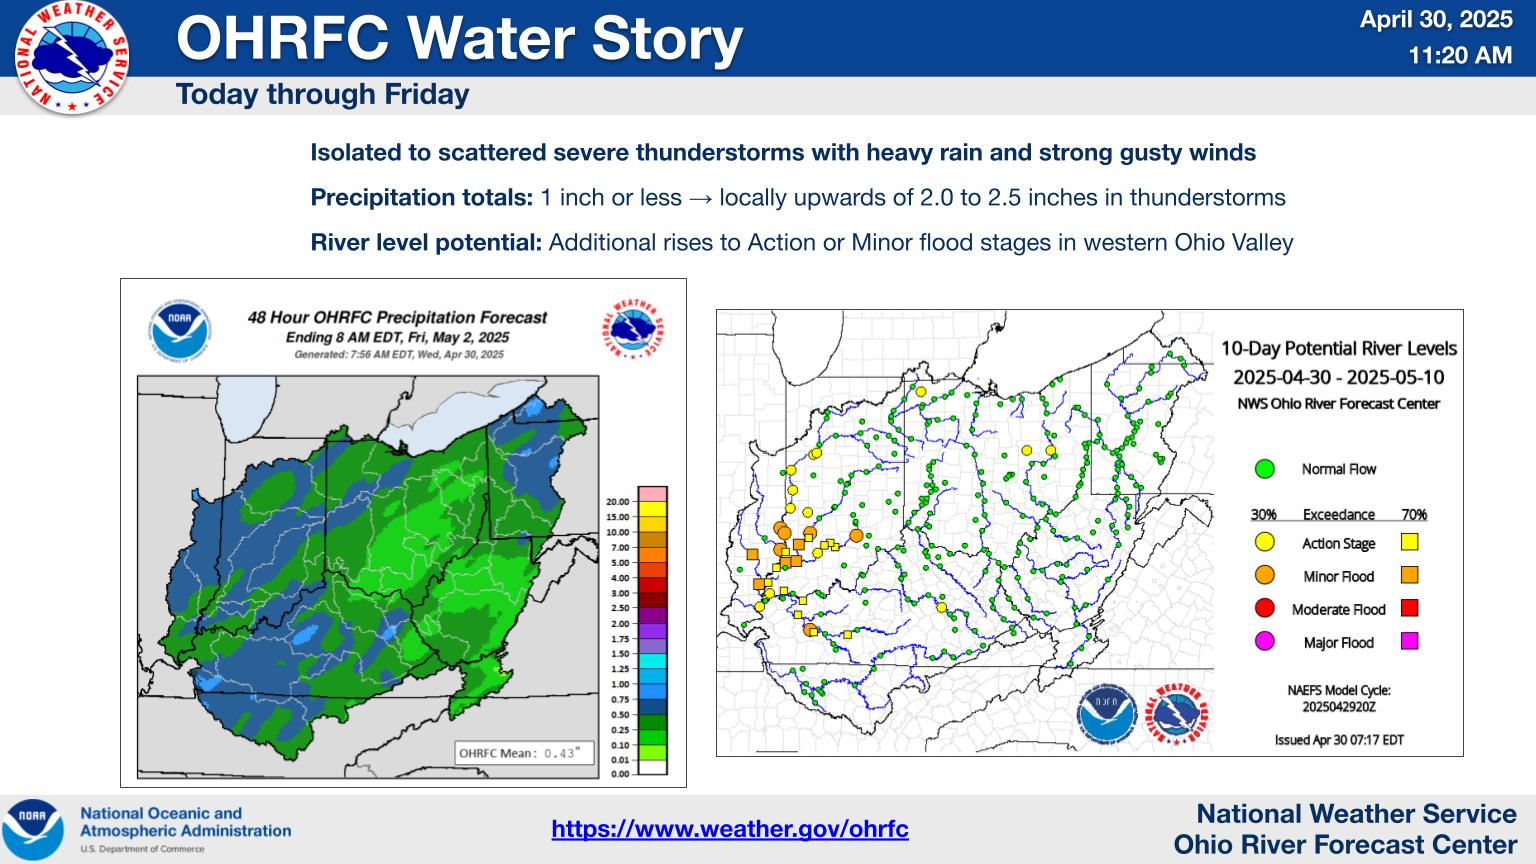
A variety of graphics showing observed data is shown below. The graphics are generated automatically and aren't always quality controlled before they are posted here. Some of the data includes radar estimates.
US Dept of Commerce
National Oceanic and Atmospheric Administration
National Weather Service
Ohio RFC
1901 South State Route 134
Wilmington, OH 45177-9708
Comments? Questions? Please Contact Us.

