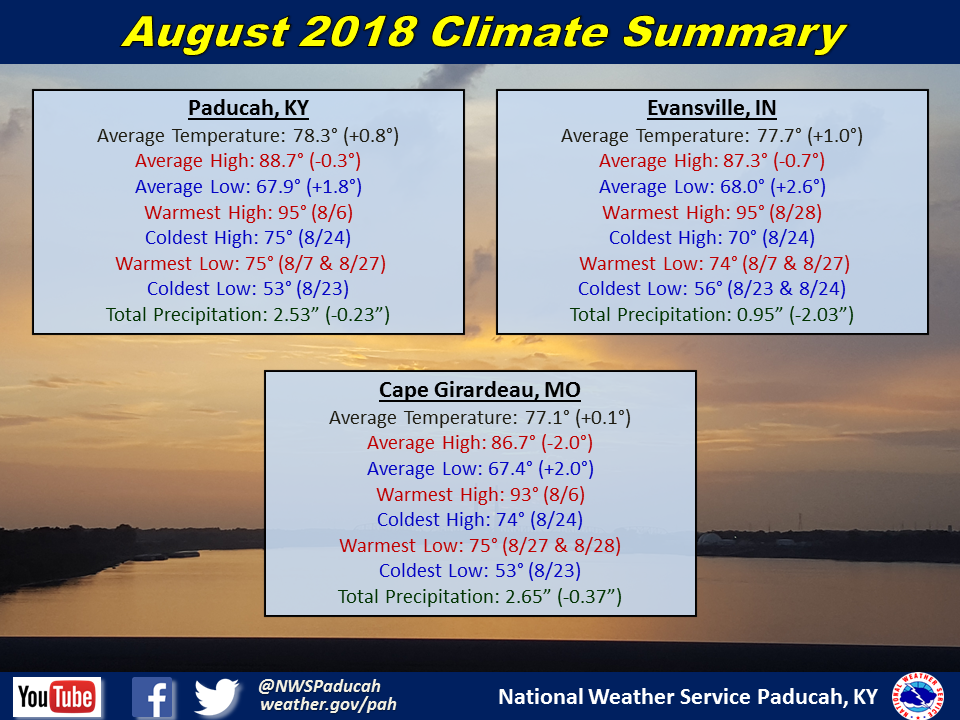
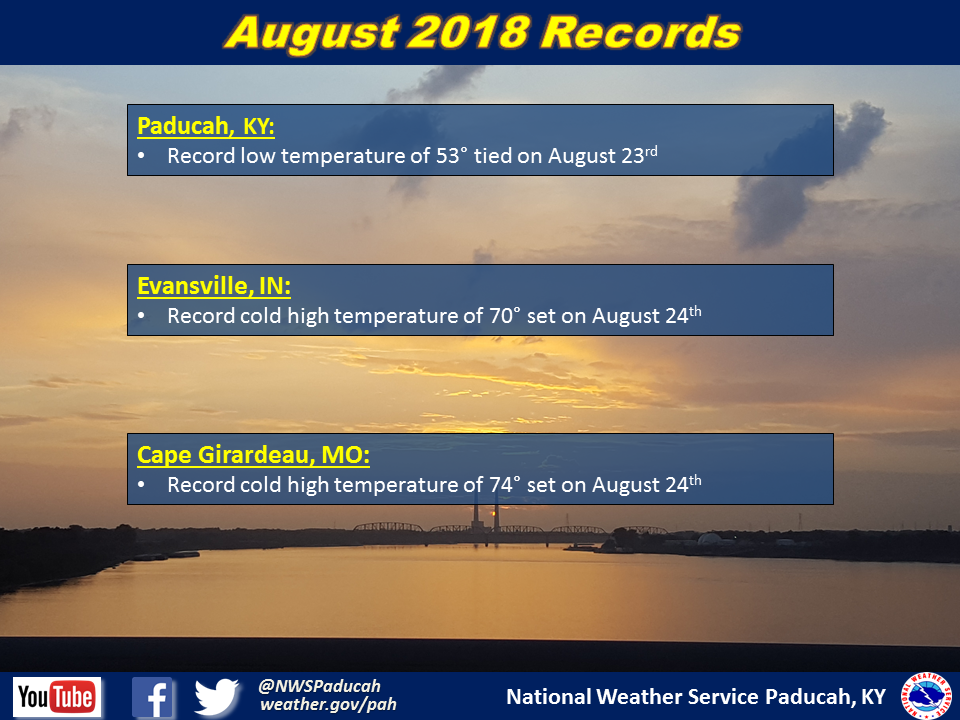
August 2018 Climate Review: Temperatures finished near normal for the month. It was a nice change after the above normal temperatures that dominated much of the May through July period. On August 24th, much of the region only managed to reach the low to mid 70s for highs, which were the coolest high temperatures since early May for many areas. Humidity levels were also not quite as oppressive as they were through much of June and July. In Paducah, the dewpoint only reached 75 degrees or higher on 4 days, after reaching this threshold 15 days each in June and July. However, it is all relative, because Paducah still managed to reach a dewpoint of 73 or higher on 16 days, which was still quite uncomfortable!
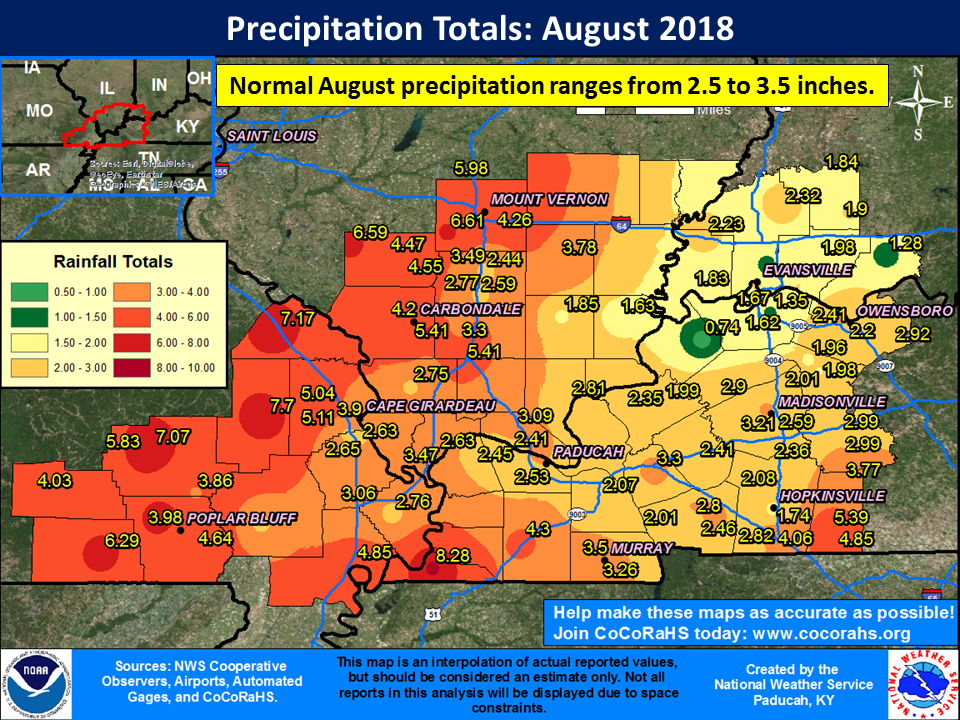
As for rainfall, it was essentially an even split across the region. Much of southeast Missouri and portions of southern Illinois from Jackson County northeastward into Wayne County finished wetter than normal. Bollinger, Wayne, and Perry Counties in Missouri were among the areas that observed the most rain. Greenville, Marble Hill, and Perryville all reported over 7 inches of rain for the month, which is 2 to 3 times more than what you would typically expect in August. On the flip side, much of southeast Illinois to the east of I-57 and south of I-64, southwest Indiana, and portions of western Kentucky observed near normal to drier than normal conditions. This was most pronounced across far northwest Kentucky (Union/Henderson Counties) and into southwest Indiana. Some of this area didn’t even receive 1 inch of rain for the entire month (Evansville, IN – 0.95” and Marion, KY – 0.74”), which was 2 to 2.5 inches drier than normal.
The graphic below is an interpolated rainfall map using actual observations. Please note that there are likely discrepancies in between observations, since the values are estimated based on nearest reports. Due to the convective nature of rainfall in the summer, amounts are more likely to vary over shorter distances, compared to the cooler months.
| August 2018 Review: Precipitation and Temperature Maps (Click on image to enlarge) |
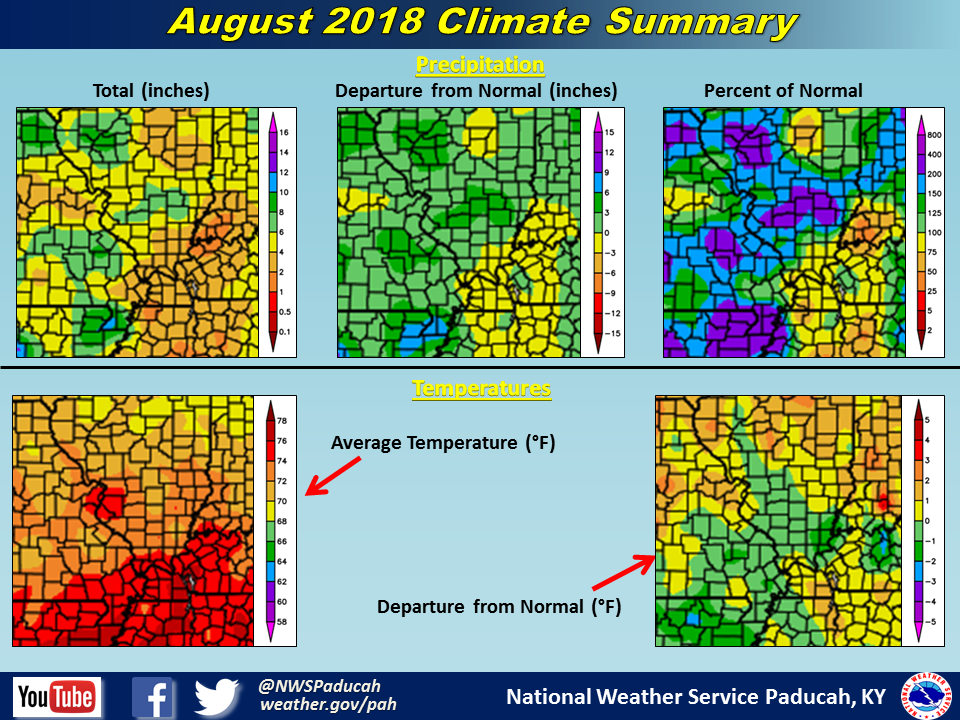 |
| Climate Maps are from the Northeast Regional Climate Center |