Showers and thunderstorms will continue to produce locally heavy rainfall and isolated severe thunderstorms across the Southern Plains and Gulf Coast states through the weekend. Above average temperatures will start building over portions of the West this weekend and peak early next week. Read More >
August 2023 Climate Review:
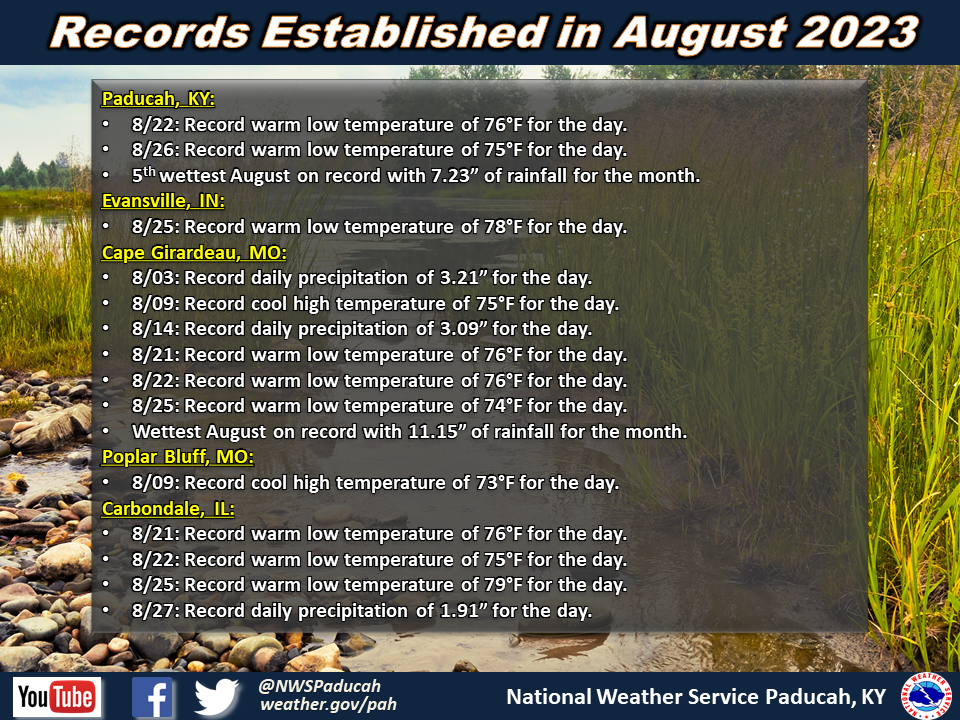
Temperatures averaged around 0.5 degree below normal. High temperatures generally were 1 to 2 degrees below normal, while low temperatures were around a degree above normal. Most of the first 19 days of the month were below normal. Many locations didn’t reach 90 degrees until August 20th including Paducah. This was only the 4th time on record that Paducah went that late in August before reaching 90. After the relatively cooler first 3 weeks, we endured a blistering heat wave from the 20th through 26th. Highs in the 90s combined with very high humidity levels to produce daily heat readings ranging from 105 to 120 (localized readings were even higher). Below normal temperatures returned during the final week of the month with highs back in the lower half of the 80s along with much more comfortable humidity.
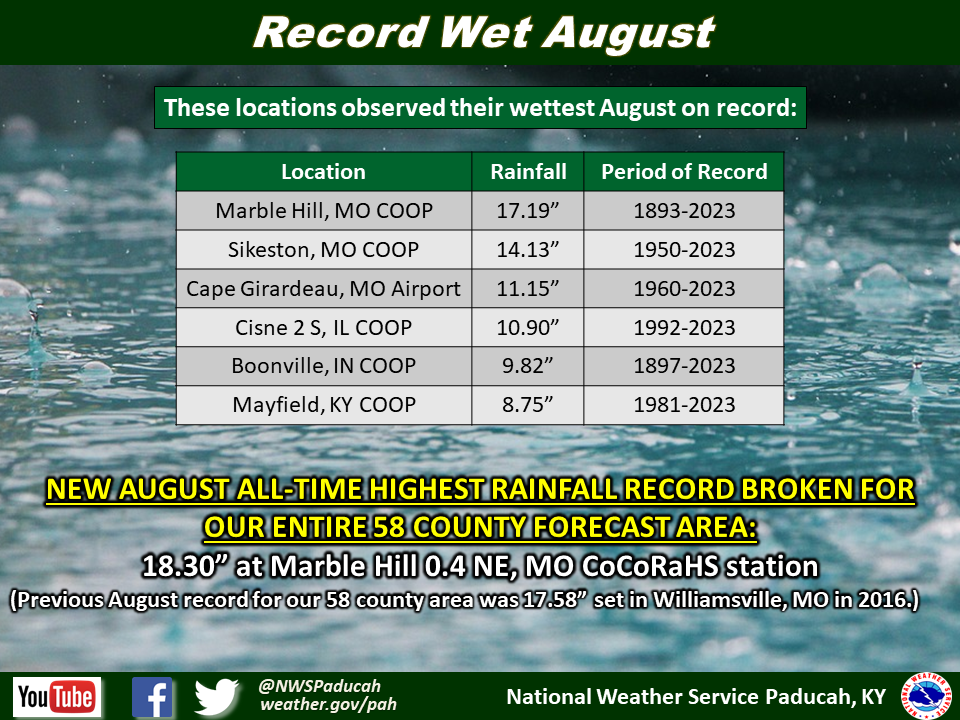
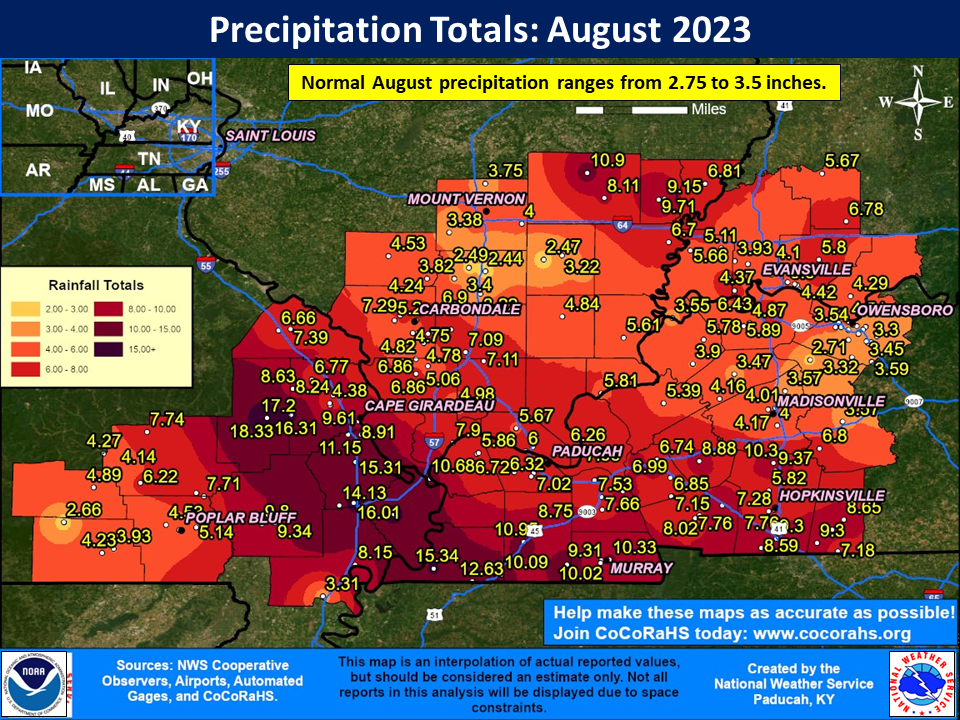
Precipitation was much wetter than normal, with portions of the region experiencing their wettest August on record including Cape Girardeau. Most areas received amounts ranging from 5 to 12 inches, with a localized corridor of higher amounts across southeast Missouri and extreme southwest Kentucky. This was generally 2 to 8+ inches above normal. The heaviest axis included cities like Marble Hill, Cape Girardeau, and Sikeston, Missouri along with Hickman and Fulton Kentucky. The highest observed amount was 18.30” at a CoCoRaHS station in Marble Hill, MO. This was also the highest observed amount on record at any observing site in our 58 county forecast area during the month of August. The previous record was 17.58” set in August 2016 in Williamsville, MO. Cape Girardeau officially picked up 11.15”, which ranked as their wettest August on record. This actually ranked as their 9th wettest month of all-time, which was an impressive feat given most of the months that have experienced 11+ inches are during the spring season.
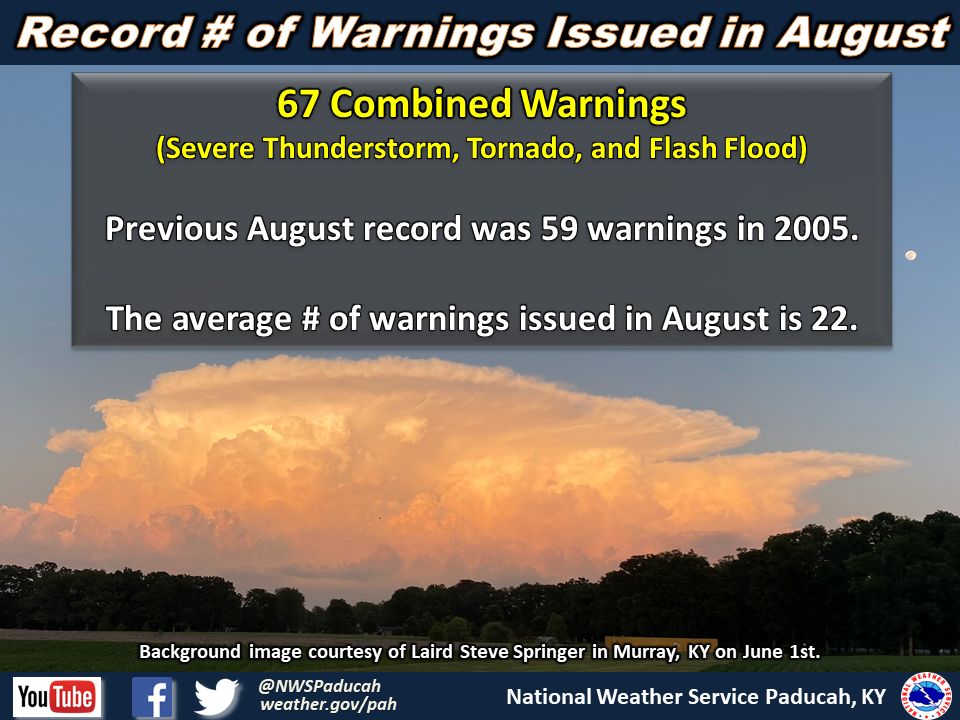
It was another active month for severe thunderstorms across our region. Our office issued 67 warnings, which broke the August record for most number of combined warnings (Severe Thunderstorm, Tornado, and Flash Flood).
| August 2023 Review: Precipitation and Temperature Maps (Click on image to enlarge) |
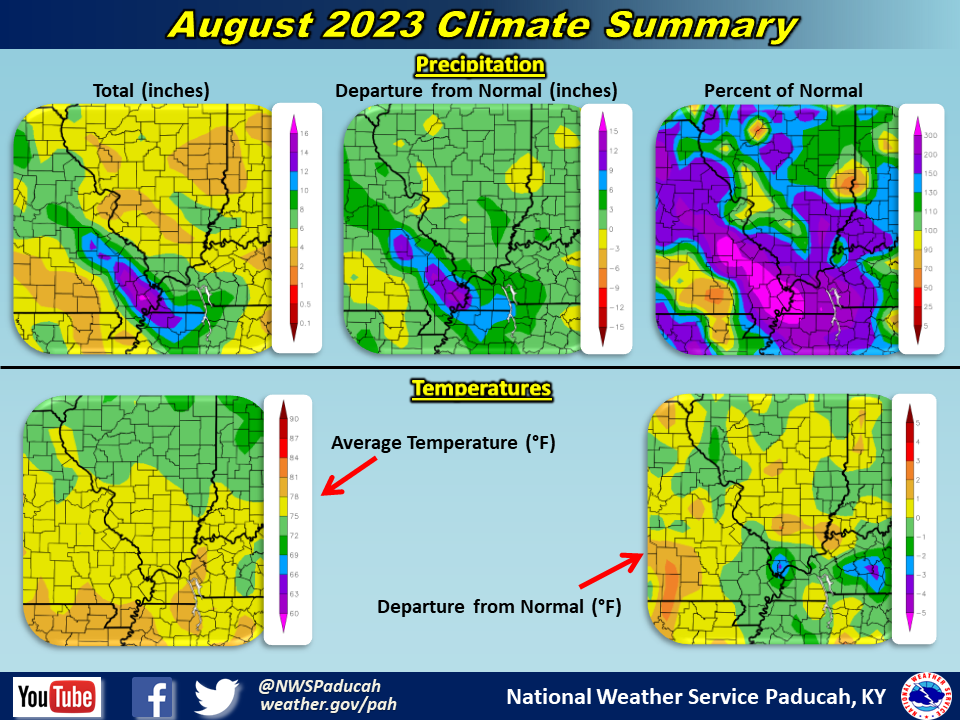 |
| Climate Maps are from the Northeast Regional Climate Center |
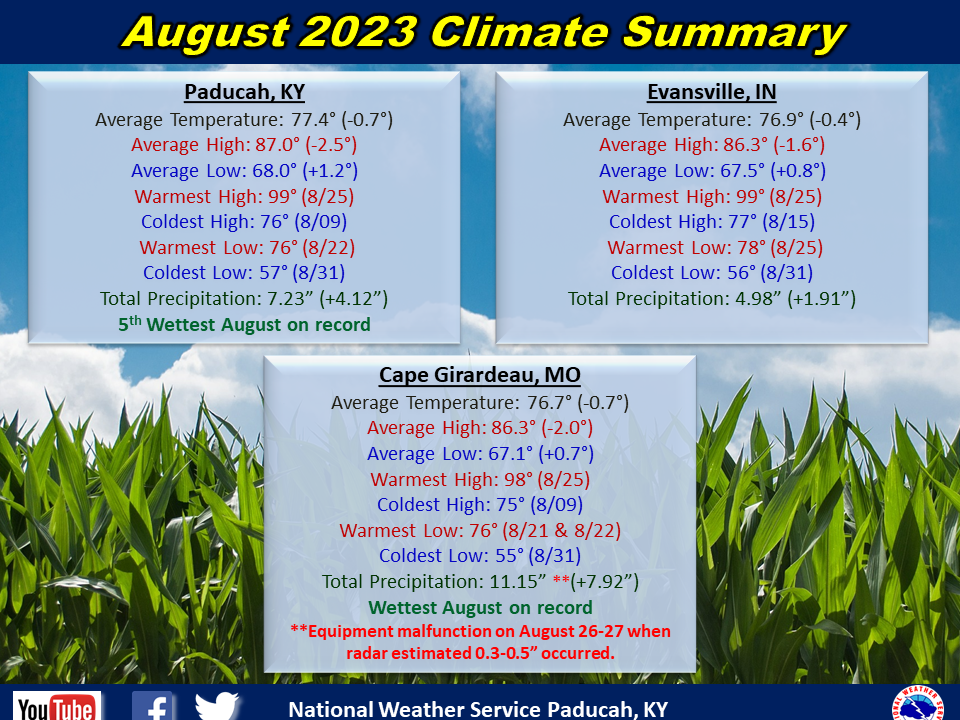
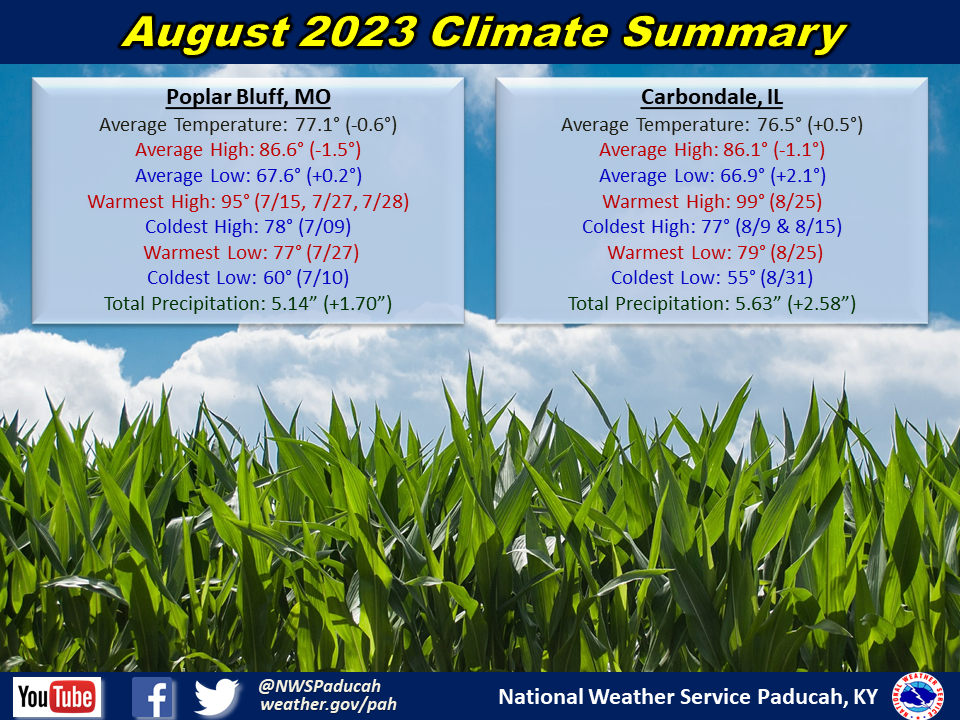
Monthly Climate Report: Paducah | Evansville | Cape Girardeau | Poplar Bluff | Carbondale