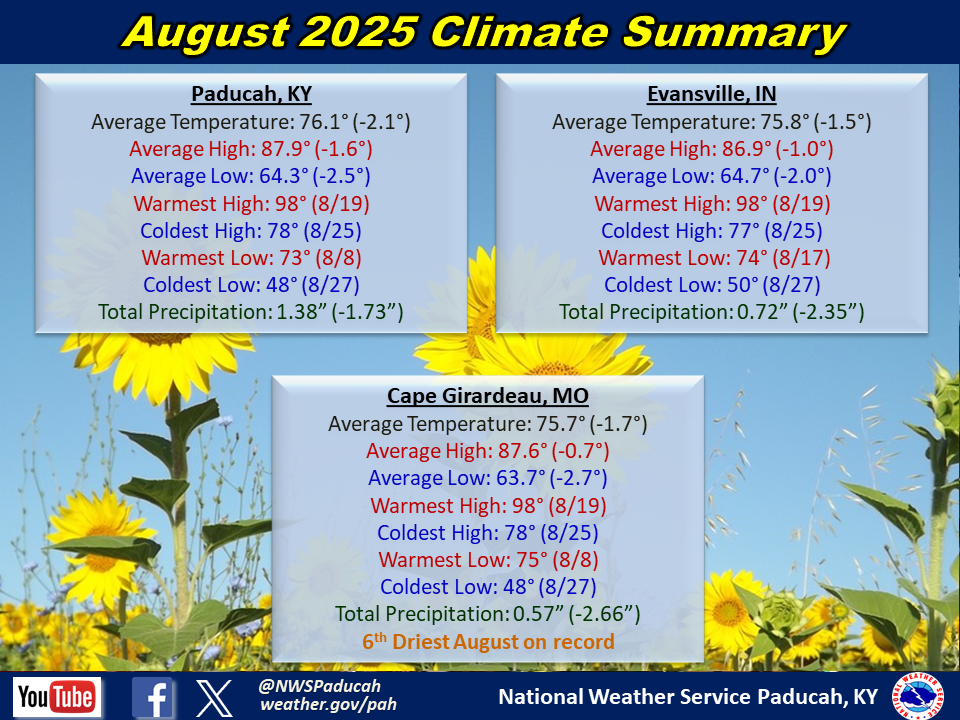
August 2025 Climate Review:
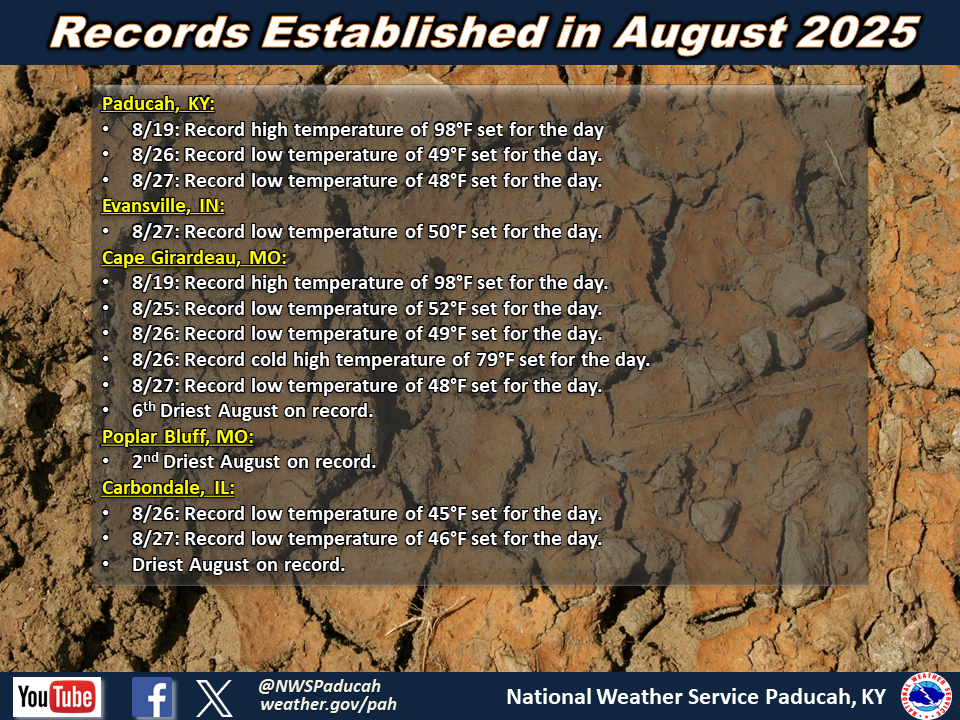
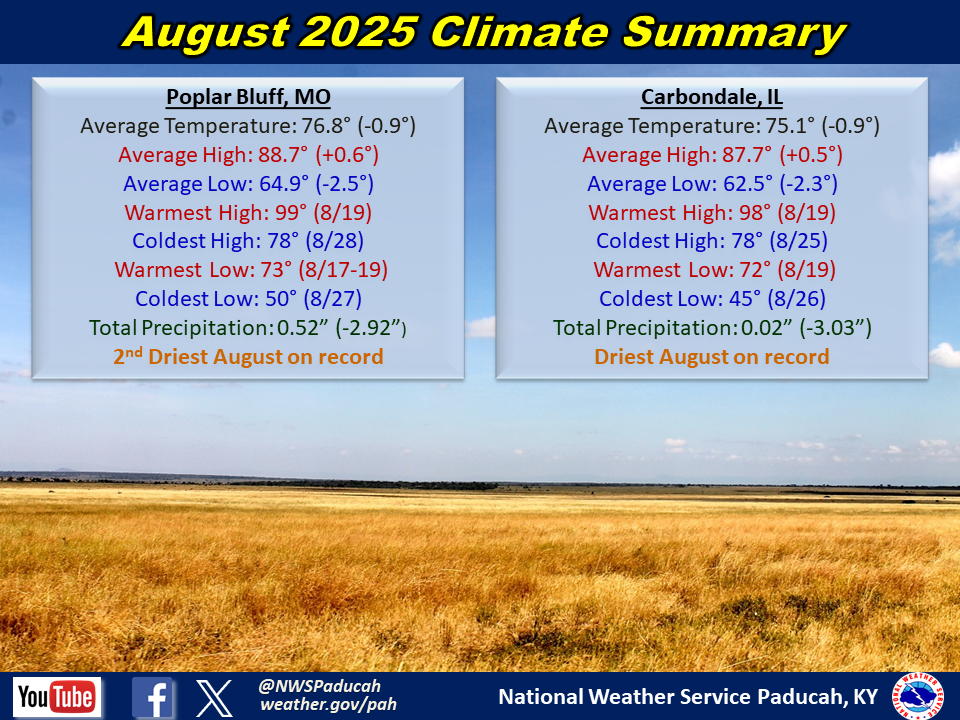
Temperatures averaged below normal by 1 to 2 degrees. The month started off with cooler than normal temperatures from the 1st through the 6th, with highs only in the low to mid 80s. Lows fell into the 50s in several locations on the mornings of the 2nd and 3rd. Humidity levels were also below average to start the month. A prolonged period of above normal temperatures followed with highs reaching 90+ for 14 consecutive days from the 6th through 19th. The hottest stretch of the month was from the 15th through 19th, with highs reaching the mid to upper 90s and heat index readings ranging from 100 to 110. A cold front brought cooler temperatures on the 20th with below normal readings continuing through the end of the month. An unseasonably chilly airmass, more on par with what we would expect in late September, greeted the region from the 25th through 27th. Highs only reached the upper 70s and lows dipped into the mid 40s to low 50s. Record lows were set at several locations. Carbondale observed their coldest August temperature since 1988 when they dropped to 45 on the morning of the 26th. Paducah registered 8 consecutive days with lows falling below 60 degrees, which broke the previous August record of 7 consecutive days set in 2004. Very low humidity levels were also present during most of this period, with dew points falling into the 40s many afternoons.
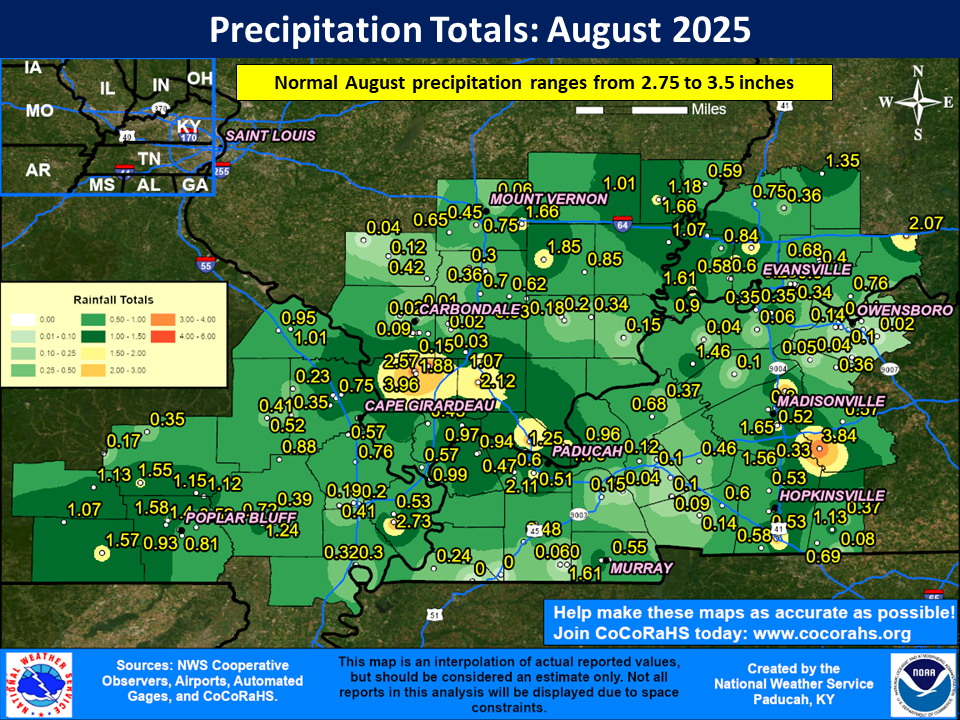
August finished as an extremely dry month across our region, with several locations achieving one of their driest August’s on record (Carbondale, Poplar Bluff, and Cape Girardeau). Rainfall amounts were below 1” in many areas, with some locales only receiving a tenth of an inch or less. Carbondale only picked up 0.02”! Most of our region finished anywhere from 1.5 to 3” drier than normal. There were a few areas that received higher amounts in excess of 2”, but they were the minority. The highest observed amount in our forecast area was 4.28” at a CoCoRaHS station in Union County, IL (Cobden 4.1 ENE). Drought developed and worsened across much of the region as the month progressed. Moderate drought (D1) was in place across parts of southeast Missouri, southwest Illinois, and west Kentucky during the last week of August.
The graphic below is an interpolated monthly rainfall map using actual observations. Please note that there are likely discrepancies in between observations, since the values are estimated based on nearest reports.
| August 2025 Review: Precipitation and Temperature Maps (Click on image to enlarge) |
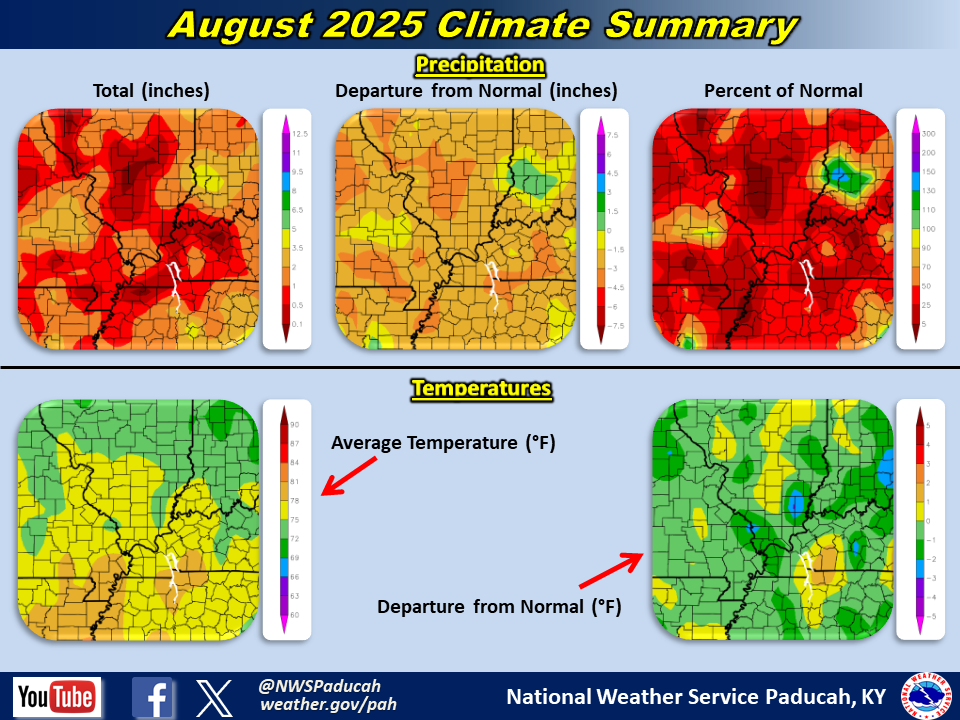 |
| Climate Maps are from the Northeast Regional Climate Center |
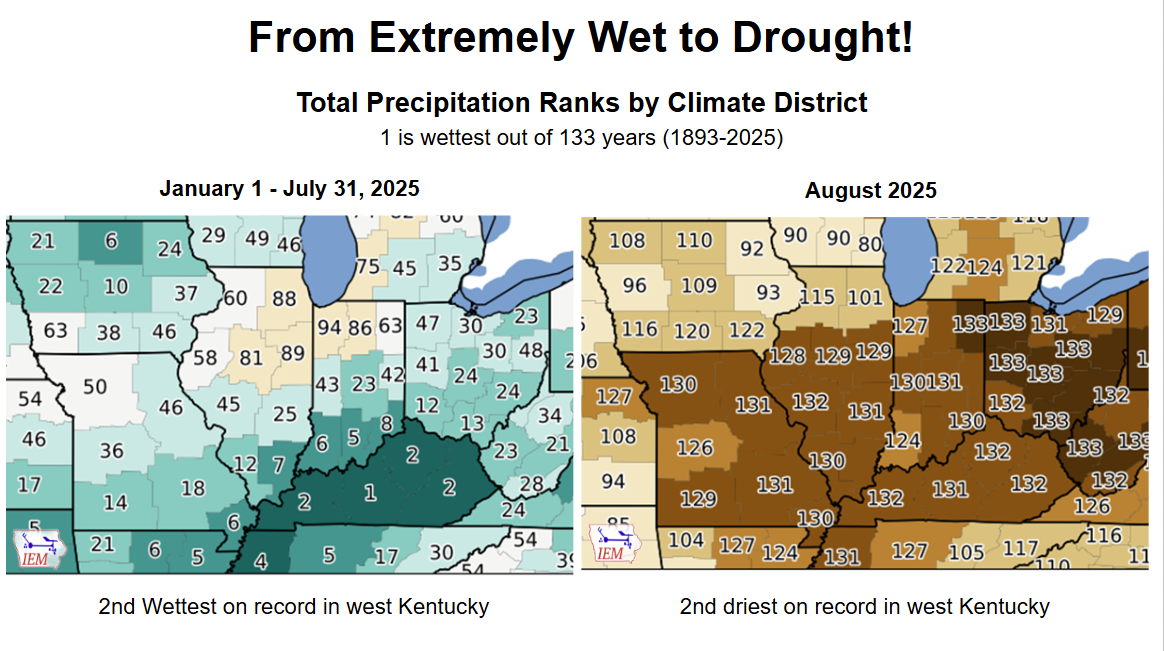
After enduring one of our wettest starts to the year on record (January through July), the faucet turned off and we experienced one of our driest August's on record!
 |
Monthly Climate Report: Paducah | Evansville | Cape Girardeau | Poplar Bluff | Carbondale