February 2023 Climate Review:
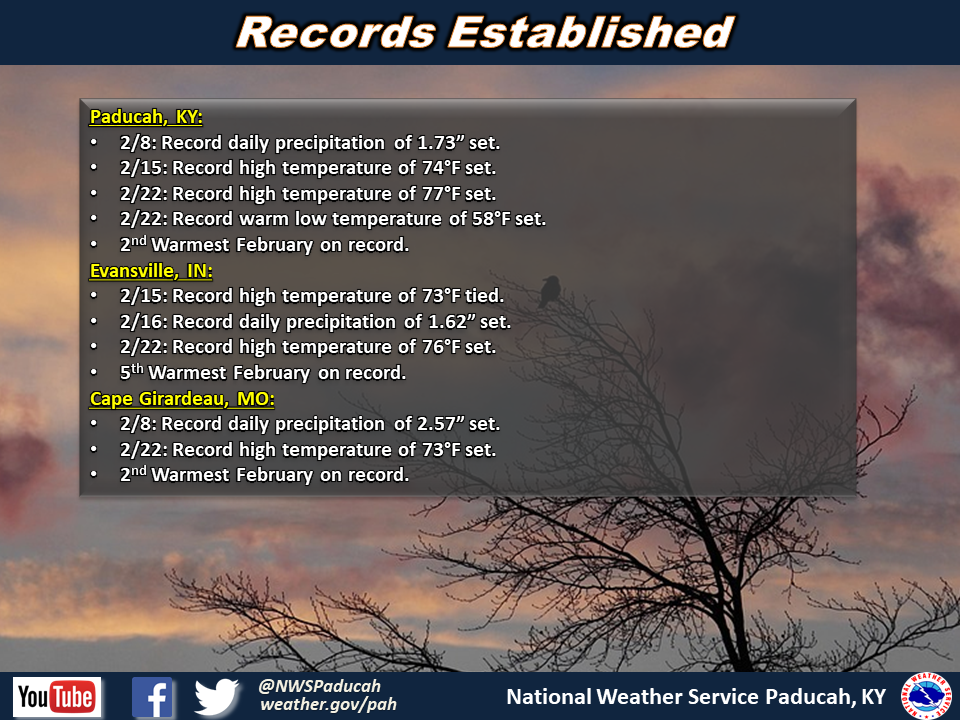
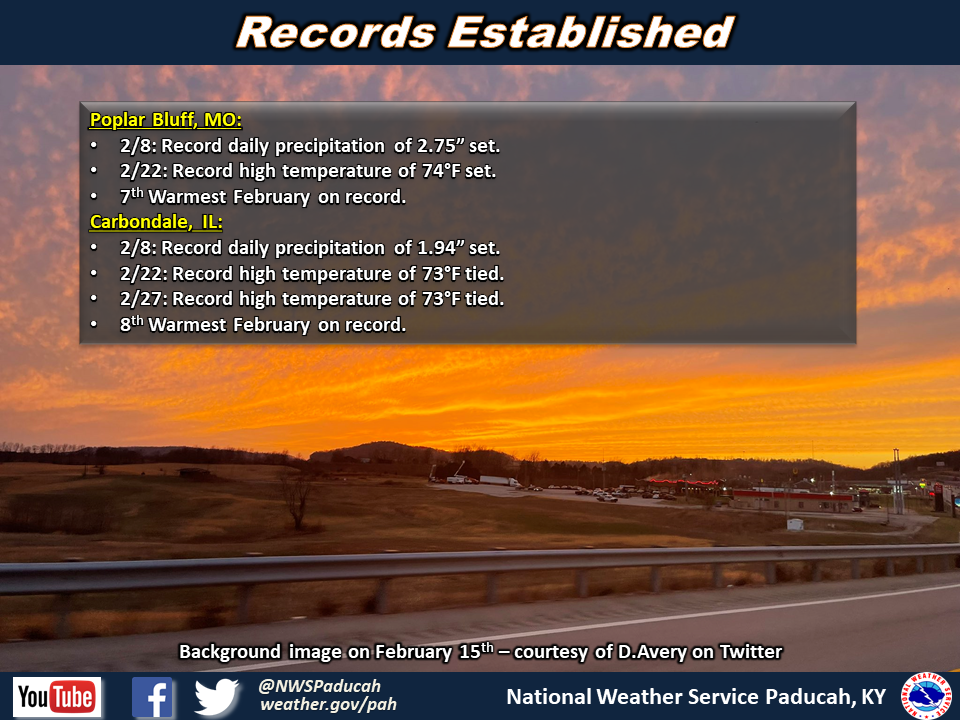
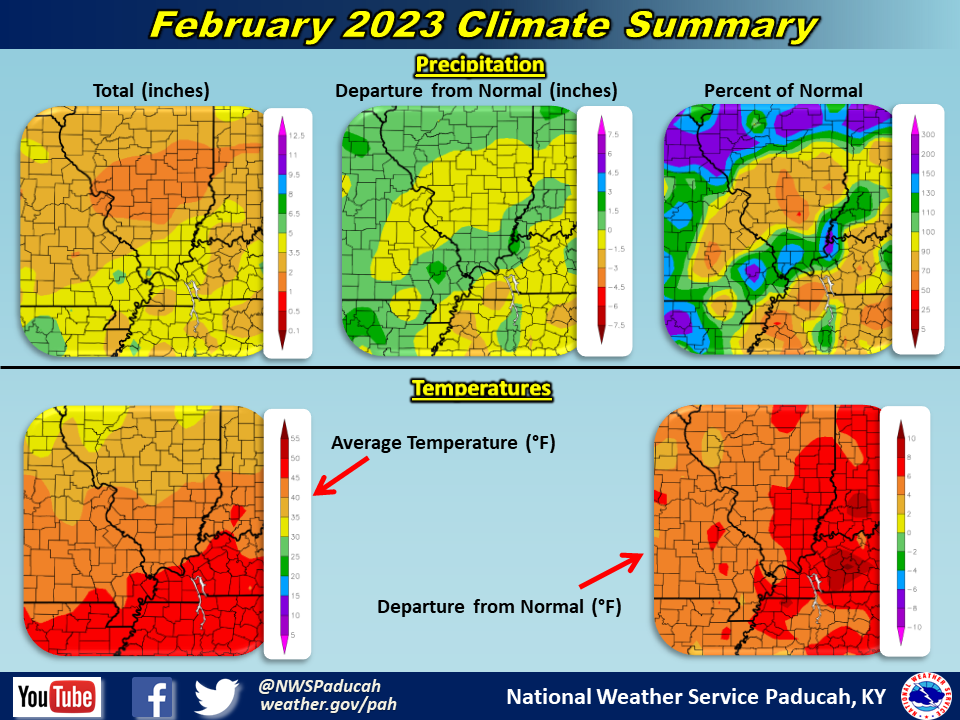
Temperatures averaged well above normal by 6 to 7 degrees. All 5 of our official climate stations finished as one of their top 8 warmest February’s on record. Many days were in the 60s across the area, with Paducah observing 15 such days, which was the 2nd most on record in February (record is 17 days in 1976). Multiple periods of exceptional warmth were experienced including from the 6th-9th, 13th-16th, 19th-23rd, and 27-28th. The 22nd was the warmest day of the month for most locations when mid 70s were widespread. Paducah hit 77 degrees that day, which was one degree shy of the February all-time highest temperature of 78. There wasn’t much cold weather during the month, but the most notable stretch was the opening 4 days of the month when highs were only in the 30s and lows dipped into the upper teens to lower 20s.
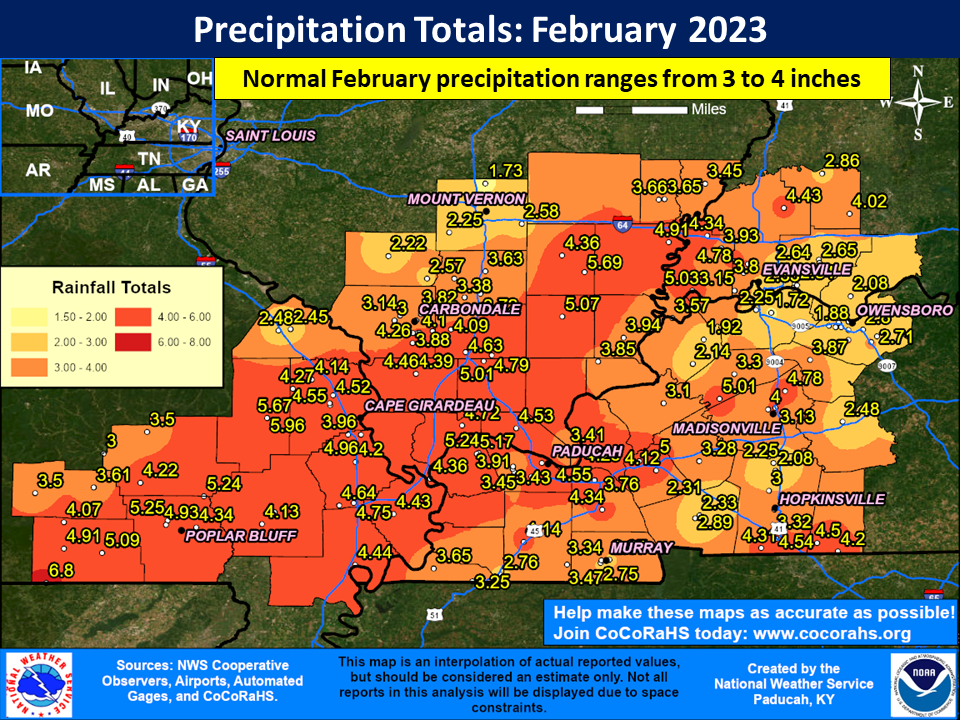
Precipitation averaged wetter than normal across much of the area with amounts of 3 to 6 inches. This was generally 0.5 to 2 inches above normal. The highest observed amount was 6.80” at a CoCoRaHS station in extreme southwest Ripley County, Missouri (Gatewood 5.6 SSE). The exception to the wet month was across far northern reaches of southern Illinois from Perry to Wayne County, across the Henderson and Owensboro, KY areas, and a corridor from Fulton to Murray to Central City, KY where amounts of 1.5 to 2.5 inches were more common. The heaviest precipitation events occurred on the 8th and 16th. Some locations received over 3 inches on these dates, with many areas in the 1 to 2 inch range.
Snow was a no-show for the month with essentially no measurable snow across the entire area. This is a somewhat rare achievement for our entire area to miss out on measurable snow the whole month of February. This was only the 2nd February on record in which Paducah didn’t receive at least a trace of snow. It was also only the 2nd February since 1957 that no station in our 58 county area received over a half inch of snow. The other time was February 2017.
| February 2023 Review: Precipitation and Temperature Maps (Click on image to enlarge) |
 |
| Climate Maps are from the Northeast Regional Climate Center |
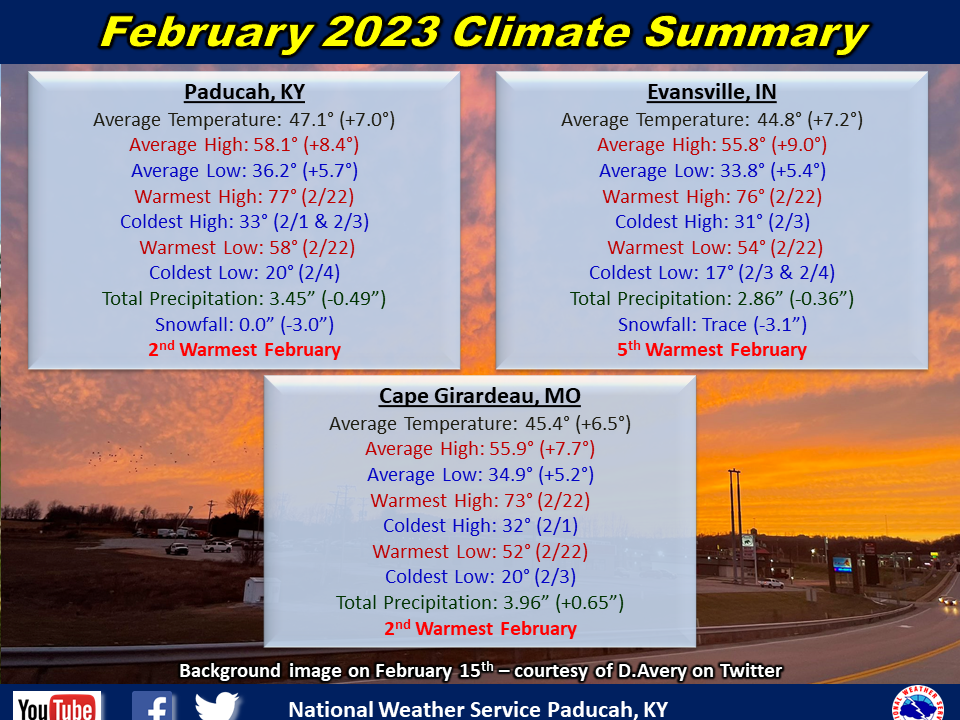
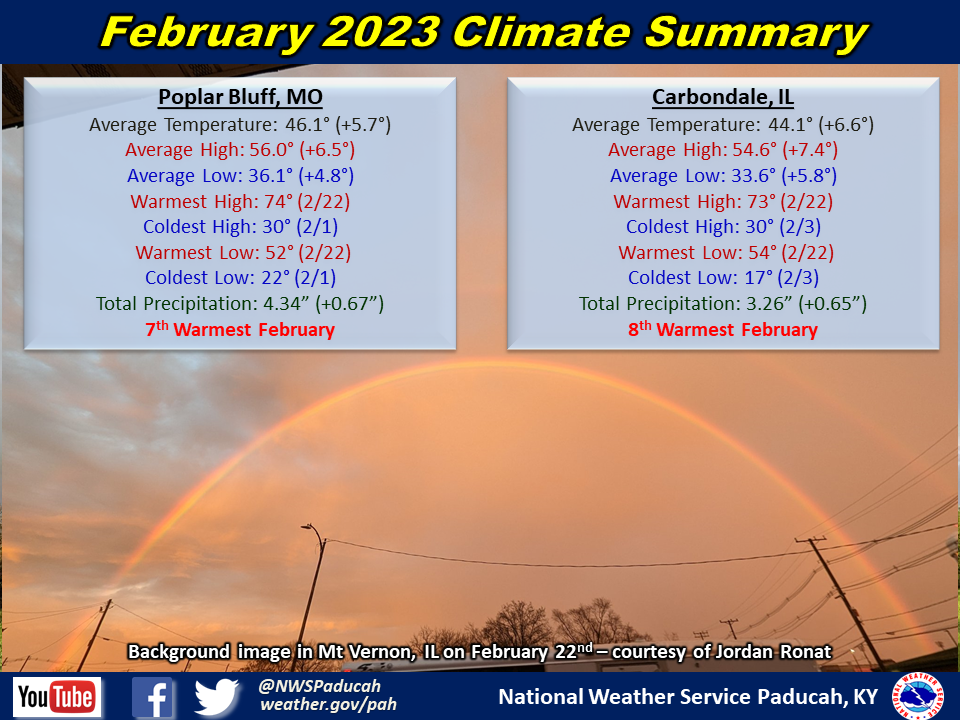
Monthly Climate Report: Paducah | Evansville | Cape Girardeau | Poplar Bluff | Carbondale