*Climate Data has been recorded at Barkley Regional Airport in West Paducah since 1949 and prior to that was observed in downtown Paducah back to December of 1937.
Halloween is a celebration on October 31st every year.
Here is a look at high and low temperature frequencies and extremes as well as precipitation statistics for Halloween in Paducah.
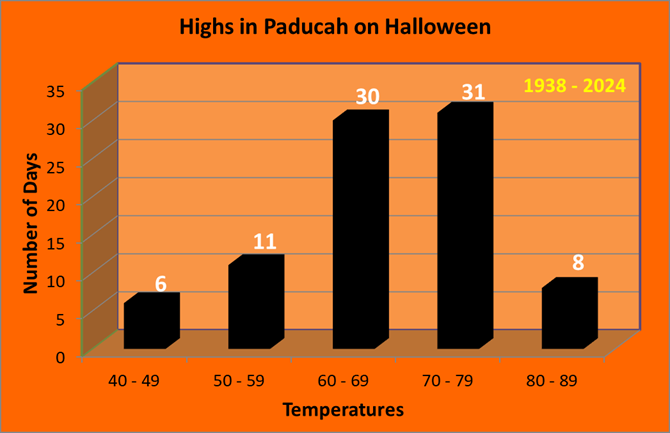
As seen by this graphic high temperatures are typically in the 60s or 70s, accounting for 71% of all years on record
| Warmest Highs | Coldest Highs |
| 85 in 1950 | 43 in 1993 |
| 83 in 2016 | 45 in 1954 |
| 82 in 2000 | 46 in 2019 |
| 82 in 1984 | 47 in 1949 |
| 82 in 1968 | 48 in 2002 |
| 49 in 2023 | |
| Normal High: | 66 |
*Denotes a tie in previous year(s)
Paducah has seen highs above 80 seven times on Halloween, most recently in 2016 when the high soared to 83 degrees. There have been 6 years where the high temperature failed to reach 50 degrees. This last occurred back in 2019 when the high only reached 46 degrees.
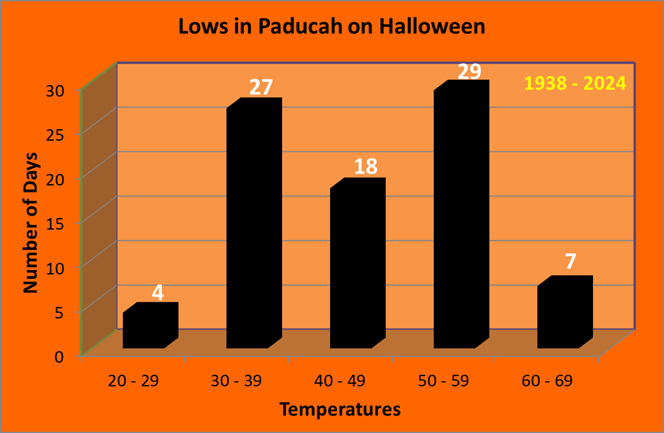
Low temperatures typically fall in the 30s, 40s, or 50s on Halloween with a nearly equal frequency of each. There have been 7 years with lows falling below freezing, most recently in 2023 when a frigid low of 26 degrees was recorded. There have also been 7 years where the low was above 60. This last happened in 2003 when it only managed to fall to 68 degrees.
| Warmest Lows | Coldest Lows |
| 68 in 2003 | 24 in 1993 |
| 65 in 1974 | 26 in 2023 |
| 64 in 1950 | 27 in 2019 |
| 62 in 1946 | 29 in 1988 |
| 61 in 1982* | 30 in 2017* |
| Normal Low: | 43 |
*Denotes a tie in previous year(s)
Measurable precipitation has fallen 34% of the time, with over an inch of precipitation falling on 4 different occasions, with 1972 being the last time this happened.
| Wettest |
| 2.50 in 1941 |
| 2.41 in 2018 |
| 1.95 in 1942 |
| 1.69 in 1972 |
| 1.22 in 1969 |
Here is a look at the observed weather for the past 15 years:
| Recent Weather for Halloween | |||
| Year | High | Low | Precip |
| 2010 | 71 | 39 | 0 |
| 2011 | 66 | 39 | 0 |
| 2012 | 58 | 31 | 0 |
| 2013 | 71 | 56 | 0.93 |
| 2014 | 53 | 36 | 0.01 |
| 2015 | 64 | 50 | 0.19 |
| 2016 | 83 | 54 | 0 |
| 2017 | 51 | 30 | 0.08 |
| 2018 | 71 | 54 | 2.41 |
| 2019 | 46 | 27 | 0.55 |
| 2020 | 66 | 35 | 0 |
| 2021 | 68 | 42 | 0 |
| 2022 | 66 | 58 | T |
| 2023 | 49 | 26 | 0 |
| 2024 | 73 | 56 | 0.70 |
*Climate Data has been recorded at Evansville Regional Airport since January of 1897.
Halloween is a celebration on October 31st every year.
Here is a look at high and low temperature frequencies and extremes as well as precipitation statistics for Halloween in Evansville.
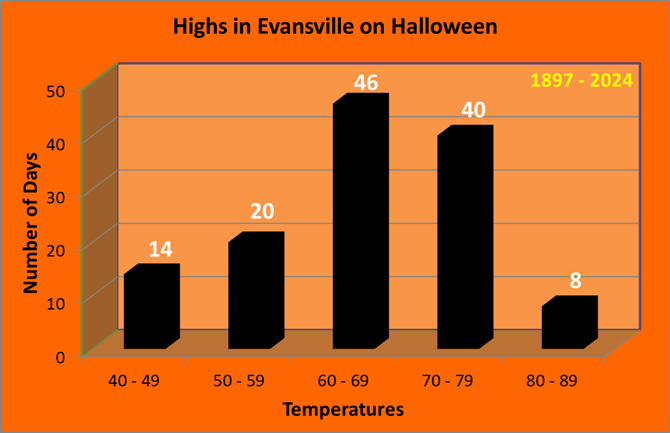
As seen by this graphic high temperatures are predominately in the 60s or 70s on Halloween, encompassing 67% of all years on record.
| Warmest Highs | Coldest Highs |
| 85 in 1950 | 44 in 1993 |
| 84 in 1933 | 44 in 1954 |
| 82 in 1987 | 44 in 1930 |
| 81 in 1935 | 44 in 1925 |
| 80 in 1974 | 44 in 1913 |
| 80 in 1968 | 47 in 2023 |
| 80 in 1944 | 47 in 1949 |
| 80 in 1900 | 47 in 1923 |
| 47 in 1906 | |
| Normal High: | 64 |
Evansville has cracked 80 degrees 8 times on Halloween, with it last occurring in 1987 when it hit 82. There have been 14 years where the high temperature failed to reach 50 degrees, most recently in 2023 when it only hit 47.
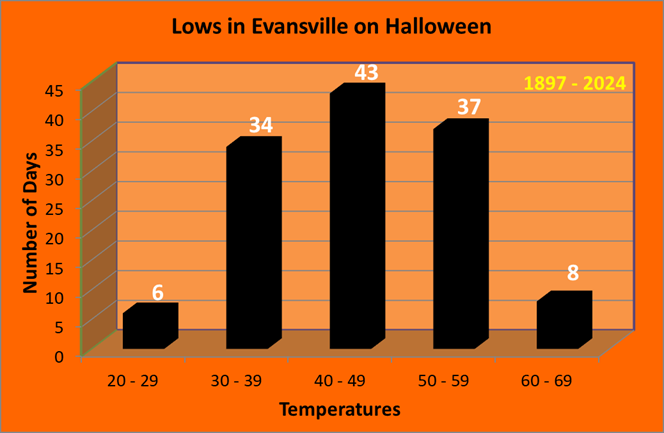
Low temperatures typically fall in the 30s, 40s, or 50s on Halloween with a nearly equal frequency of each. Temperatures have fallen below freezing on 10 occasions, last occurring in 2023 with a reading of 25 degrees. On the warm end of the spectrum, lows have fallen into the 60s 8 times, most recently in 2003 with a reading of 66 degrees.
| Warmest Lows | Coldest Lows |
| 66 in 2003 | 25 in 2023 |
| 63 in 1919 | 25 in 1988 |
| 63 in 1900 | 26 in 1954 |
| 62 in 1929 | 26 in 1925 |
| 61 in 1982* | 27 in 2019 |
| Normal Low: | 42 |
*Denotes a tie in previous year(s)
Measurable precipitation has fallen 36% of the time, with over an inch of precipitation falling on 4 different occasions, but this hasn't happened since 1972.
| Wettest |
| 2.05 in 1941 |
| 1.91 in 1972 |
| 1.35 in 1969 |
| 1.07 in 1919 |
| 0.96 in 2013 |
Here is a look at the observed weather for the past 15 years:
| Recent Weather for Halloween | |||
| Year | High | Low | Precip |
| 2010 | 67 | 38 | 0 |
| 2011 | 61 | 35 | 0 |
| 2012 | 52 | 34 | 0 |
| 2013 | 70 | 54 | 0.96 |
| 2014 | 51 | 38 | 0.01 |
| 2015 | 63 | 48 | 0.12 |
| 2016 | 76 | 55 | 0 |
| 2017 | 48 | 31 | T |
| 2018 | 67 | 53 | 0.93 |
| 2019 | 50 | 27 | 0.42 |
| 2020 | 62 | 34 | 0 |
| 2021 | 66 | 45 | 0 |
| 2022 | 64 | 53 | 0.16 |
| 2023 | 47 | 25 | 0 |
| 2024 | 73 | 50 | 0.55 |
*Climate Data has been recorded at Cape Girardeau Regional Airport, located 5 miles southwest of Cape Girardeau, since June of 1960.
Halloween is a celebration on October 31st every year.
Here is a look at high and low temperature frequencies and extremes as well as precipitation statistics for Halloween in Cape Girardeau.
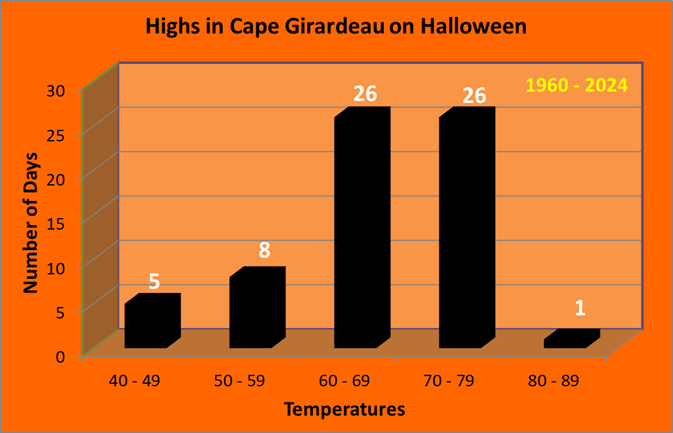
As seen by this graphic high temperatures are predominately in the 60s or 70s on Halloween, encompassing 81% of all years on record.
| Warmest Highs | Coldest Highs |
| 82 in 1968 | 41 in 2019 |
| 79 in 2016 | 43 in 1993 |
| 79 in 1987 | 48 in 2023 |
| 79 in 1999 | 48 in 2002 |
| 77 in 2003 | 49 in 2017 |
| 77 in 1984 | 53 in 2014 |
| 77 in 1982 | |
| 77 in 1974 | |
| Normal High: | 65 |
Cape Girardeau has only seen one Halloween with a temperature above 80 and this happened back in 1968. There have been 5 years where the high temperature failed to reach 50 degrees, most recently occurring in 2023.
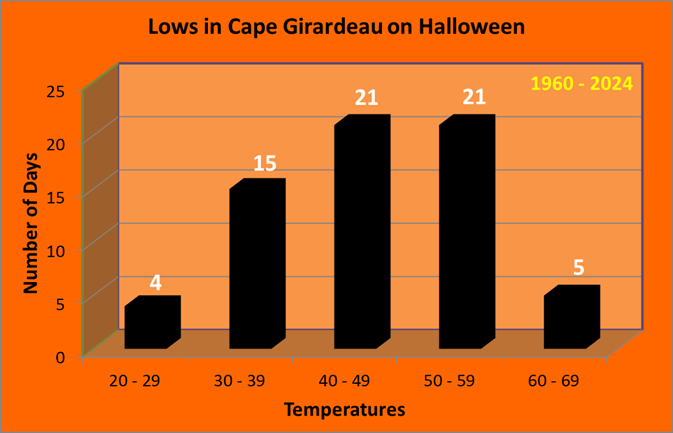
Low temperatures typically fall in the 30s, 40s, or 50s on Halloween with a nearly equal frequency of each. There have been 7 years where the low dipped below the freezing mark, most recently in 2023. On the warm side of the spectrum, there have been 5 years with lows in the 60s, which last occurred in 2003.
| Warmest Lows | Coldest Lows |
| 62 in 1982 | 25 in 2023 |
| 62 in 1977 | 26 in 1993 |
| 62 in 1974 | 28 in 2017 |
| 60 in 2003 | 29 in 2019 |
| 60 in 1984 | 30 in 2012* |
| Normal Low: | 41 |
*Denotes a tie in previous year(s)
Measurable precipitation has fallen 38% of the time, with an inch or more of precipitation occurring three times, in 2018, 2013 and 1972.
| Wettest |
| 2.83 in 1972 |
| 1.88 in 2018 |
| 1.39 in 2013 |
| 0.84 in 1985 |
| 0.76 in 1973 |
Here is a look at the observed weather for the past 15 years:
| Recent Weather for Halloween | |||
| Year | High | Low | Precip |
| 2010 | 70 | 34 | 0 |
| 2011 | 67 | 32 | 0 |
| 2012 | 60 | 30 | 0 |
| 2013 | 69 | 52 | 1.39 |
| 2014 | 53 | 37 | 0 |
| 2015 | 62 | 50 | 0.12 |
| 2016 | 79 | 53 | 0 |
| 2017 | 49 | 28 | 0.07 |
| 2018 | 68 | 53 | 1.88 |
| 2019 | 41 | 29 | 0.34 |
| 2020 | 64 | 35 | 0 |
| 2021 | 67 | 39 | 0 |
| 2022 | 67 | 49 | T |
| 2023 | 48 | 25 | 0 |
| 2024 | 73 | 49 | 0.58 |
Climate Data has been recorded at the Poplar Bluff Airport, located 4 miles east of Poplar Bluff, since December of 1997. Prior to that data was taken at the Poplar Bluff COOP station, located a half mile west of downtown. Data for the COOP station dates back to January 1893.
Halloween is a celebration on October 31st every year.
Here is a look at high and low temperature frequencies and extremes as well as precipitation statistics for Halloween in Poplar Bluff.
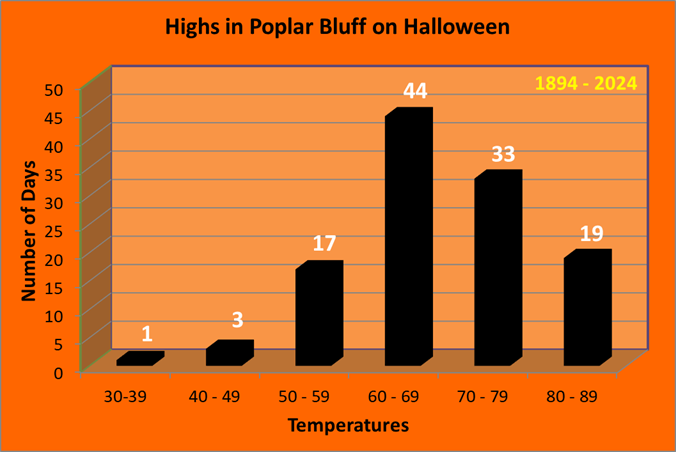
As seen by this graphic high temperatures are predominately in the 60s or 70s on Halloween, encompassing 65% of all years on record.
| Warmest Highs | Coldest Highs |
| 86 in 1950 | 34 in 1925 |
| 84 in 1946 | 43 in 2019 |
| 84 in 1934 | 48 in 2002 |
| 83 in 1999 | 48 in 1917 |
| 83 in 1935* | 50 in 2023* |
| Normal High: | 65 |
Poplar Bluff has experienced highs in the 80s on nineteen occasions, most recently back in 2016. Meanwhile, there have been 4 years with highs stuck below 50 degrees, most recently occurring back in 2019. The only year with highs in the 30s was way back in 1925.
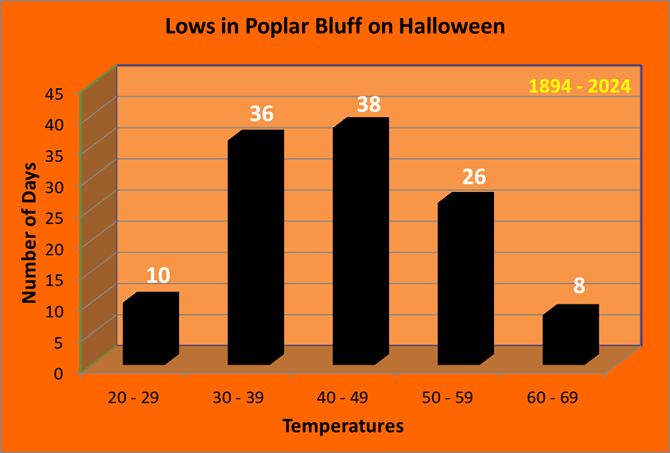
Low temperatures typically fall in the 30s, 40s, or 50s on Halloween with a nearly equal frequency of each. There have been 10 years where the low dipped into the 20s, most recently in 2023. On the warm side of the spectrum, there have been 8 years with lows in the 60s, which last occurred in 2003.
| Warmest Lows | Coldest Lows |
| 67 in 2003 | 22 in 1917 |
| 65 in 1919 | 24 in 1930 |
| 63 in 1922 | 25 in 1923 |
| 62 in 1974 | 26 in 1955 |
| 62 in 1961* | 27 in 2023* |
| Normal Low: | 42 |
Measurable precipitation has fallen 33% of the time, with an inch or more of precipitation occurring eight times, most recently in 2018.
| Wettest |
| 3.08 in 1941 |
| 2.40 in 1932 |
| 2.18 in 2018 |
| 1.52 in 2013 |
| 1.50 in 1961 |
Here is a look at the observed weather for the past 15 years:
| Recent Weather for Halloween | |||
| Year | High | Low | Precip |
| 2010 | 73 | 35 | 0 |
| 2011 | 71 | 33 | 0 |
| 2012 | 67 | 38 | 0 |
| 2013 | 72 | 54 | 1.52 |
| 2014 | 56 | 34 | 0 |
| 2015 | 62 | 51 | 0.21 |
| 2016 | 81 | 55 | 0 |
| 2017 | 51 | 31 | 0.19 |
| 2018 | 69 | 52 | 2.18 |
| 2019 | 43 | 30 | 0.20 |
| 2020 | 62 | 36 | 0 |
| 2021 | 72 | 43 | 0 |
| 2022 | 69 | 46 | 0.07 |
| 2023 | 50 | 27 | 0 |
| 2024 | 73 | 49 | 0.89 |
Climate Data has been recorded at Southern Illinois Airport, located 4 miles northwest of Carbondale, since August of 1998. Prior to that data was taken at the Carbondale Sewage Plant COOP station, located 3 miles east of Carbondale. Data for the COOP station dates back to November 1898.
Halloween is a celebration on October 31st every year.
Here is a look at high and low temperature frequencies and extremes as well as precipitation statistics for Halloween in Carbondale.
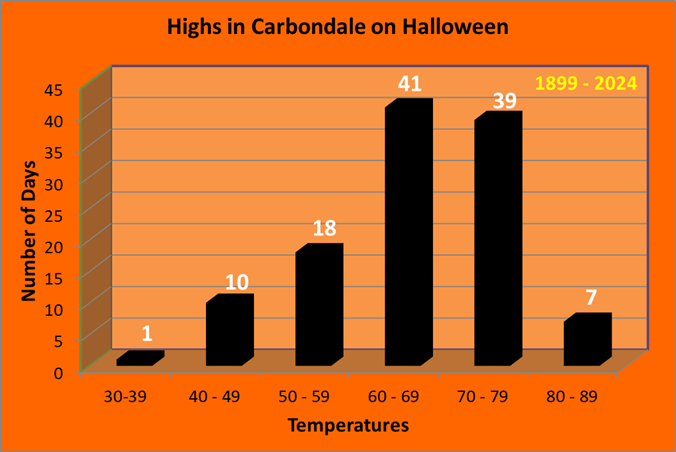
As seen by this graphic high temperatures are predominately in the 60s or 70s on Halloween, encompassing 69% of all years on record.
| Warmest Highs | Coldest Highs |
| 86 in 1950 | 37 in 1993 |
| 85 in 1933 | 41 in 2019 |
| 84 in 1968 | 45 in 2023 |
| 84 in 1922 | 45 in 1954 |
| 82 in 1938* | 47 in 2002* |
| Normal High: | 63 |
Carbondale has observed highs in the 80s on seven different occasions, most recently back in 1968 . There have also been 11 years where the high temperature failed to reach 50 degrees, most recently back in 2023. The only year where high temperatures were stuck in the 30s was back in 1993.
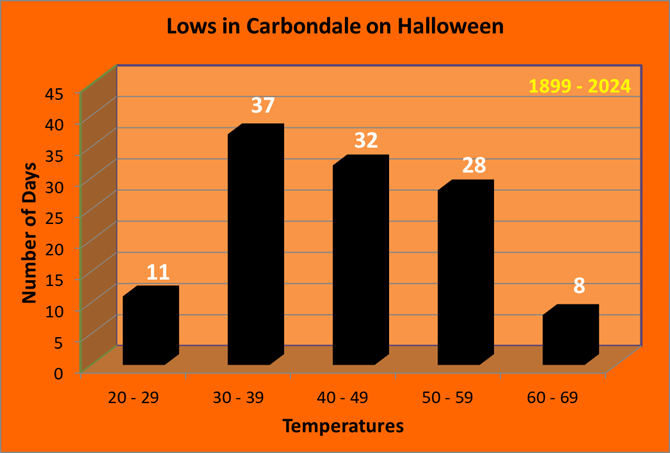
Low temperatures typically fall in the 30s, 40s, or 50s on Halloween with a nearly equal frequency of each. There have been 11 years where the low dipped into the 20s, most recently in 2023. On the warm side of the spectrum, there have been 8 years with lows in the 60s, which last occurred in 1974.
| Warmest Lows | Coldest Lows |
| 64 in 1935 | 20 in 1925 |
| 64 in 1919 | 20 in 1923 |
| 63 in 1950 | 23 in 1988 |
| 62 in 1974 | 25 in 2019 |
| 62 in 1929 | 25 in 1980 |
| Normal Low: | 40 |
Measurable precipitation has fallen 36% of the time, with an inch or more of precipitation occurring six times, most recently in 2018.
| Wettest |
| 2.80 in 1932 |
| 1.82 in 2013 |
| 1.44 in 1941 |
| 1.36 in 2018 |
| 1.30 in 1972 |
Here is a look at the observed weather for the past 15 years:
| Recent Weather for Halloween | |||
| Year | High | Low | Precip |
| 2010 | 67 | 37 | 0 |
| 2011 | 64 | 36 | 0 |
| 2012 | 56 | 30 | 0 |
| 2013 | 68 | 51 | 1.82 |
| 2014 | 51 | 35 | T |
| 2015 | 64 | 48 | 0.12 |
| 2016 | 77 | 53 | 0 |
| 2017 | 49 | 26 | 0.06 |
| 2018 | 69 | 50 | 1.36 |
| 2019 | 41 | 25 | 0.39 |
| 2020 | 65 | 33 | 0 |
| 2021 | 62 | 38 | 0 |
| 2022 | 62 | 47 | 0.04 |
| 2023 | 45 | 26 | 0 |
| 2024 | 73 | 47 | 0.74 |

