Overview
One of our longest lasting heat waves in recent memory occurred during mid to late July 2025. High temperatures in the low to mid 90s combined with very high humidity levels (dew points in the mid 70s to low 80s) to produce heat index values that were routinely in the 100 to 110 range starting on July 16th and continuing through the 30th. Some relief occurred across the northern 1/3 to 1/2 of the region on the 19th and 21st thanks to more widespread showers/storms and associated cloud cover. However, as the ridge amplified and coverage of showers and storms began to dwindle, the entire region became engulfed in widespread heat index readings of 100 to 110 from the 22nd through 24th. Localized readings of 115 to 120 were observed during this time across parts of southeast Missouri and the Jackson Purchase area of west Kentucky. We saw a slight decrease on the 25th and 26th due to more clouds around, largely limiting heat index readings to the 100 to 105 range. This was then followed by the most oppressive heat of the entire heat wave with widespread heat index readings of 110 to 120, along with localized higher readings, on the 28th. The heat wave continued through the 30th and then a cold front moving south through the region finally brought relief on July 31st.
Our office had Heat Advisories or Extreme Heat Warnings in effect for portions of our region on 15 consecutive days from July 16th through the 30th.
Heat Index
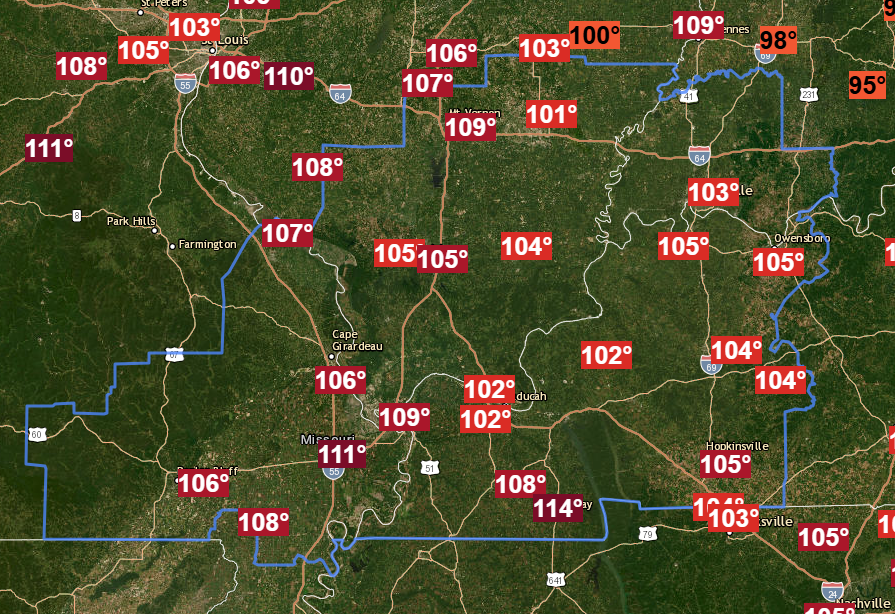
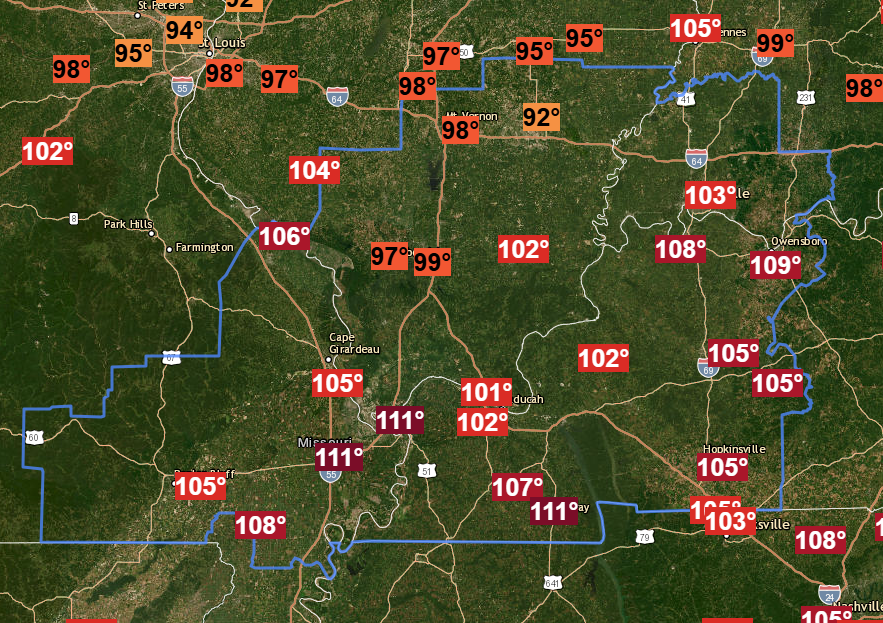
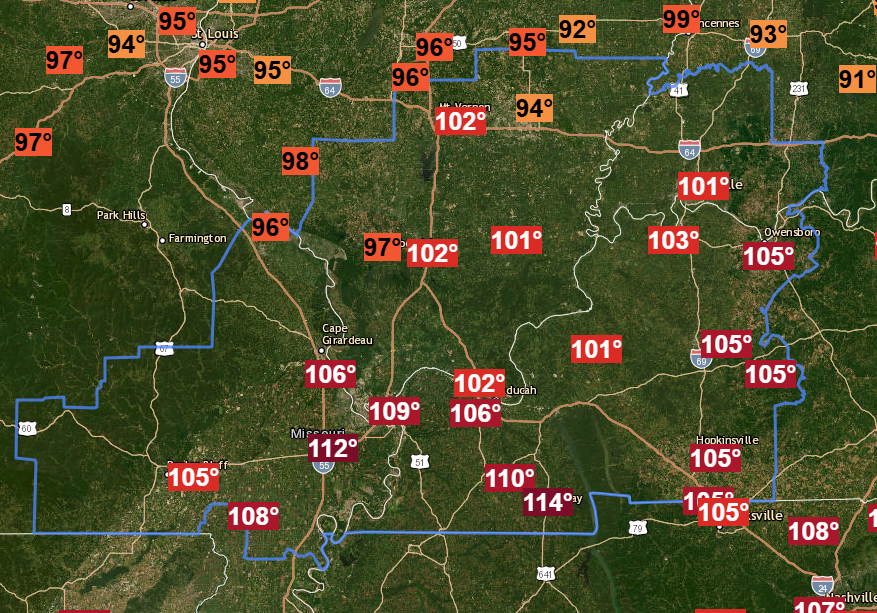
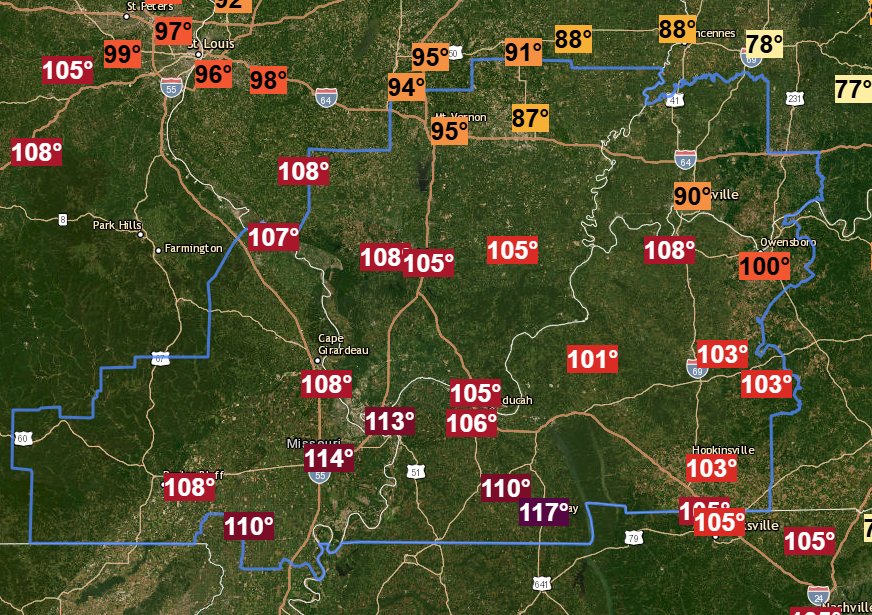
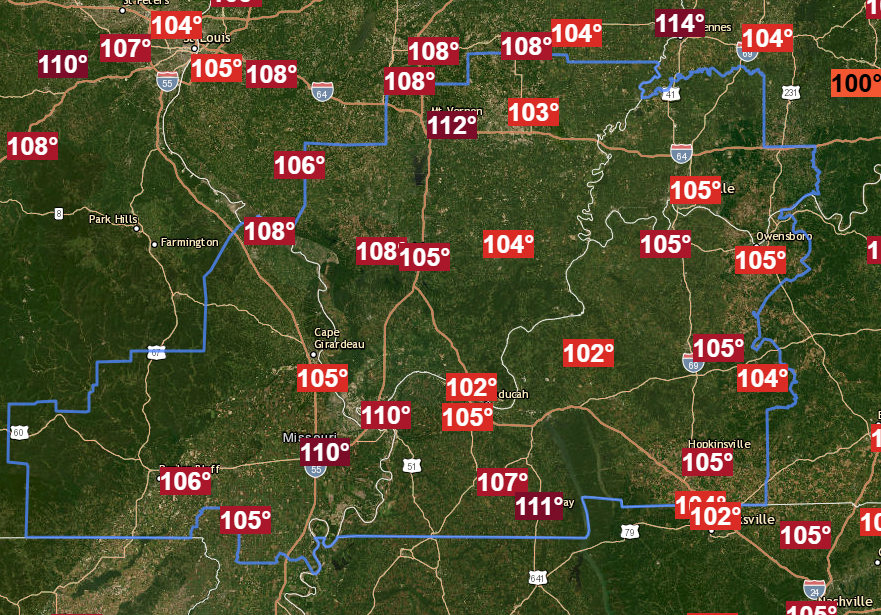
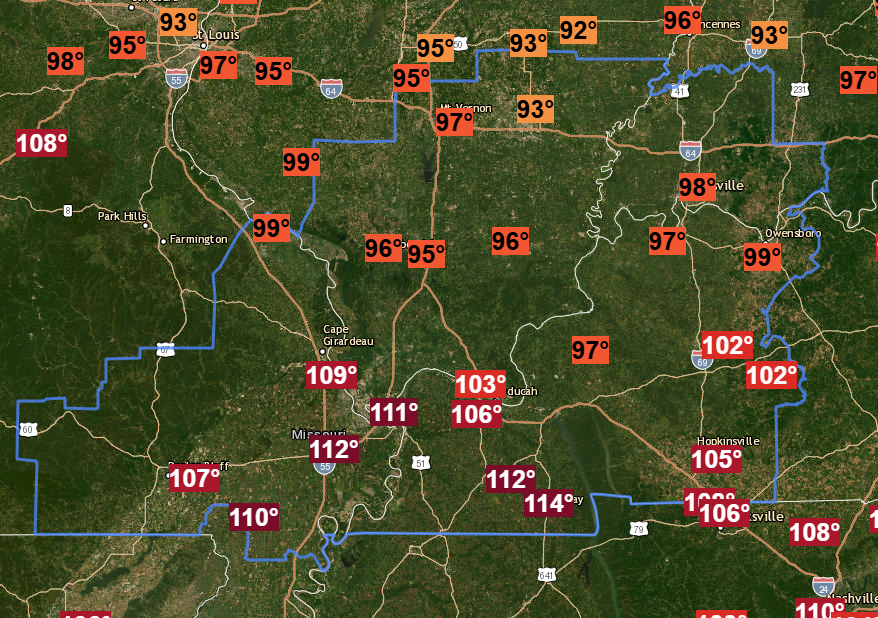
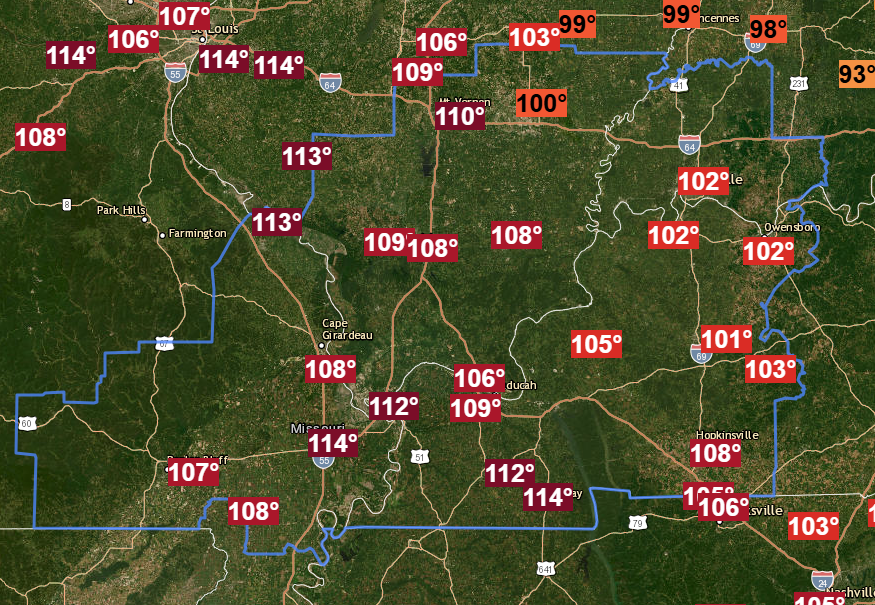
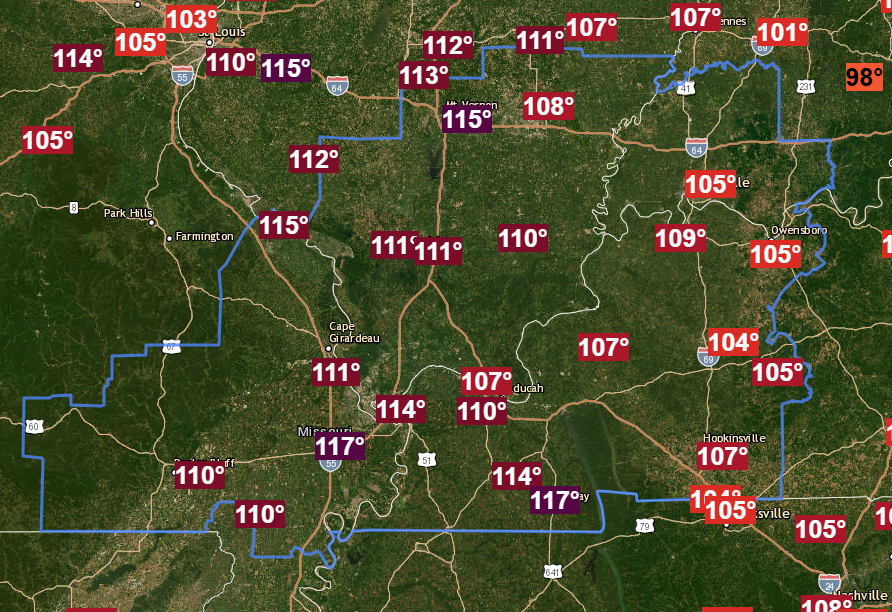
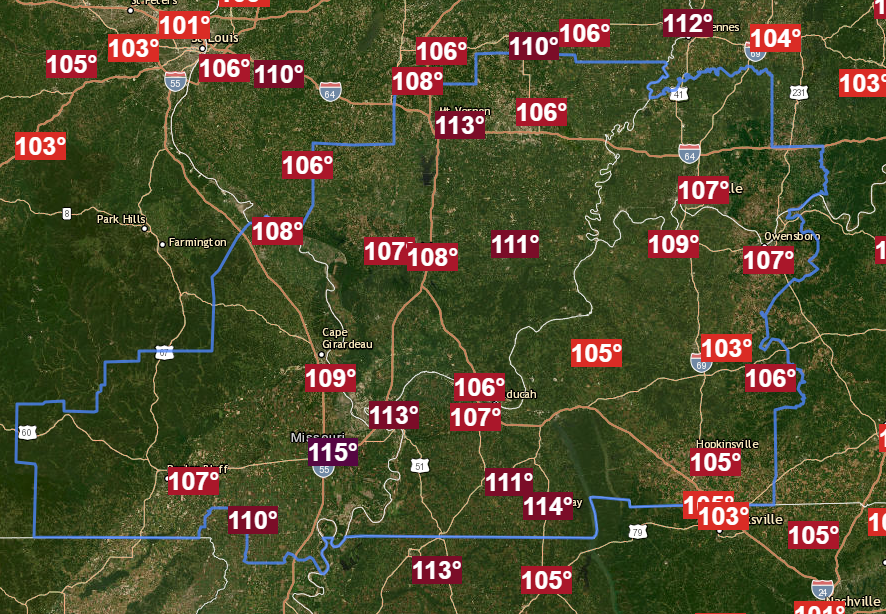
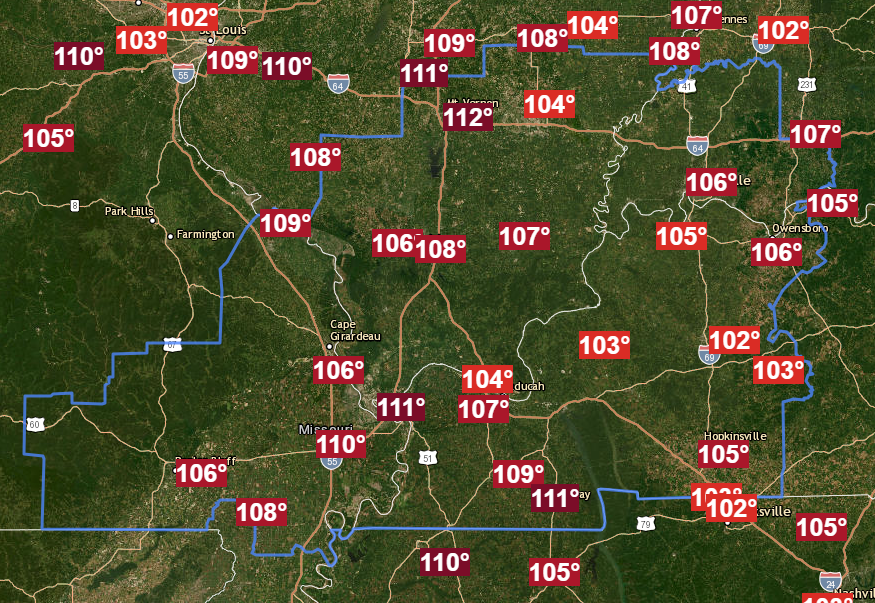
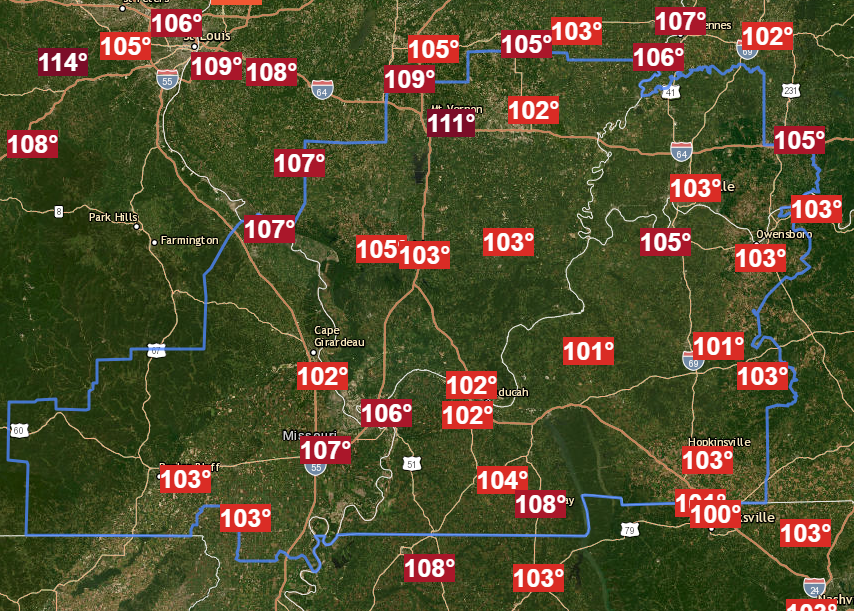
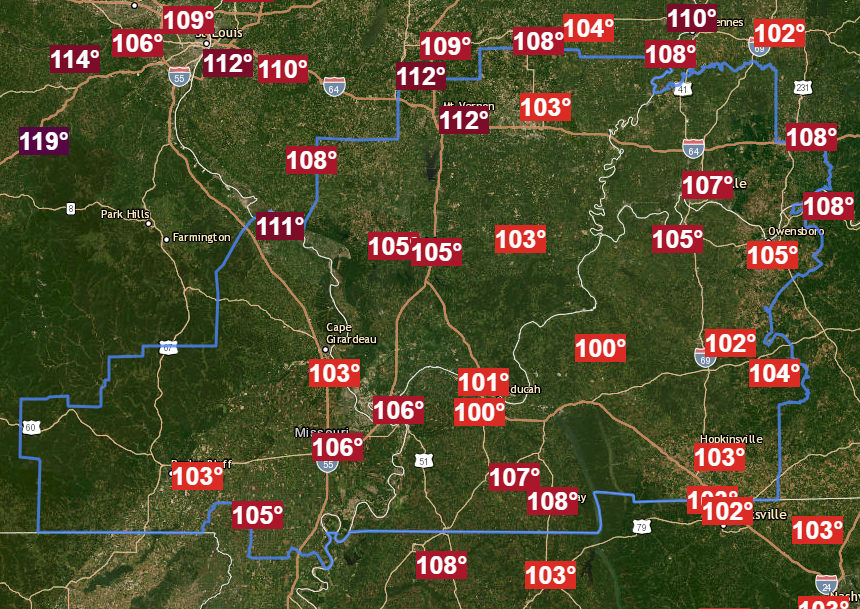
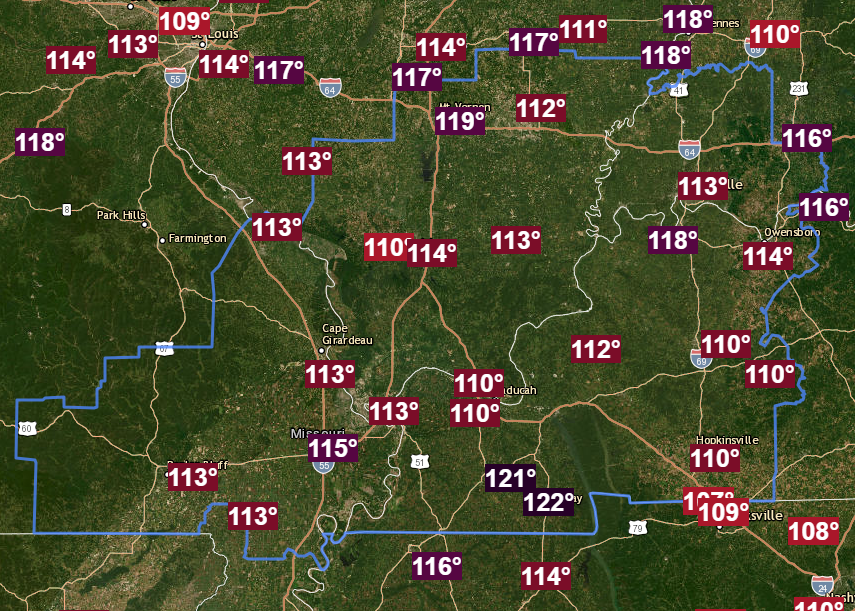
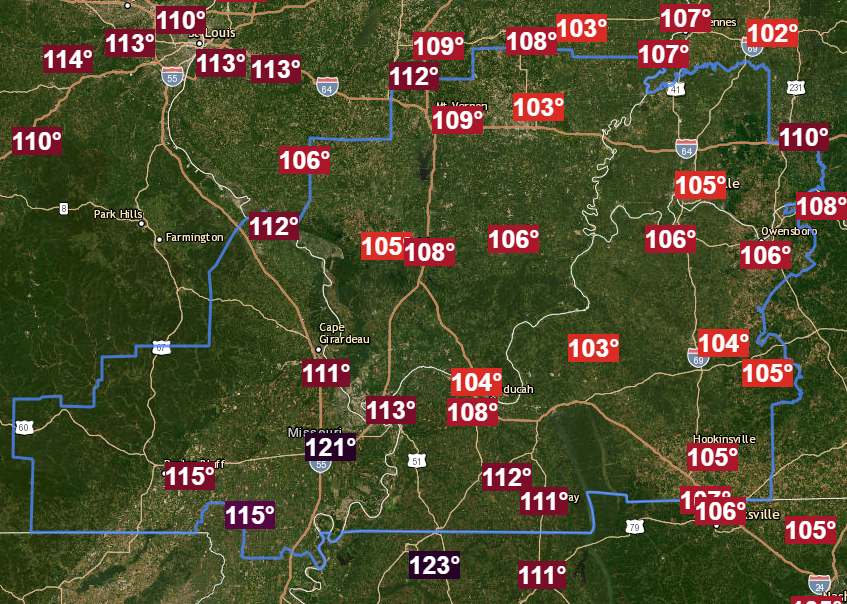
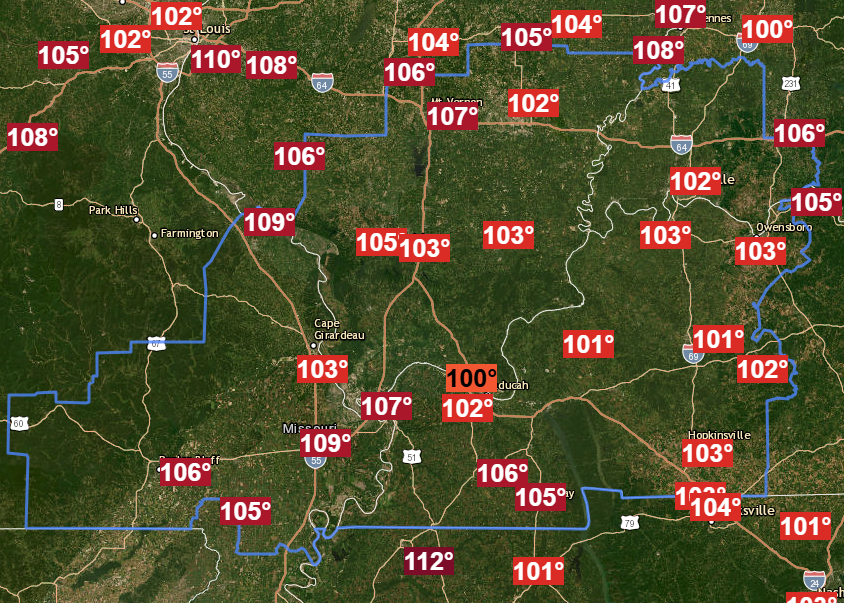
The graphics below display the observed heat index from ASOS/AWOS (airports) stations across our region from July 16-30. Paducah reached a 105 heat index for 8 straight days from the 18th through 25th and we reached 100 for 15 straight days from the 16th through 30th. Meanwhile, Murray, KY and Sikeston, MO both reached 110+ for 10 consecutive days and exceeded 105 degrees every day during this 15 day heat wave! A few readings above 120 were observed, including 122 in Murray and at the KY Mesonet station in McLean County on July 28th. Evansville experienced their 10th highest heat index on record on the 28th, reaching 113.
| Peak Heat Index: July 16, 2025 | Peak Heat Index: July 17, 2025 |
 |
 |
| Peak Heat Index: July 18, 2025 | Peak Heat Index: July 19, 2025 |
 |
 |
| Peak Heat Index: July 20, 2025 | Peak Heat Index: July 21, 2025 |
 |
 |
| Peak Heat Index: July 22, 2025 | Peak Heat Index: July 23, 2025 |
 |
 |
| Peak Heat Index: July 24, 2025 | Peak Heat Index: July 25, 2025 |
 |
 |
| Peak Heat Index: July 26, 2025 | Peak Heat Index: July 27, 2025 |
 |
 |
| Peak Heat Index: July 28, 2025 | Peak Heat Index: July 29, 2025 |
 |
 |
| Peak Heat Index: July 30, 2025 |
 |
Environment
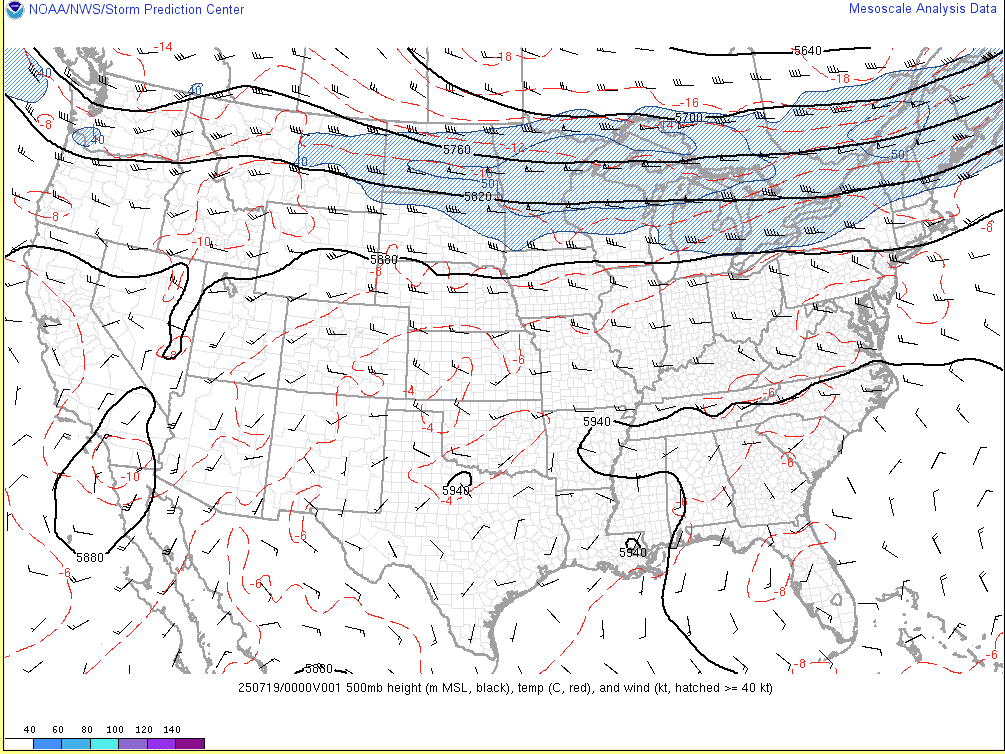
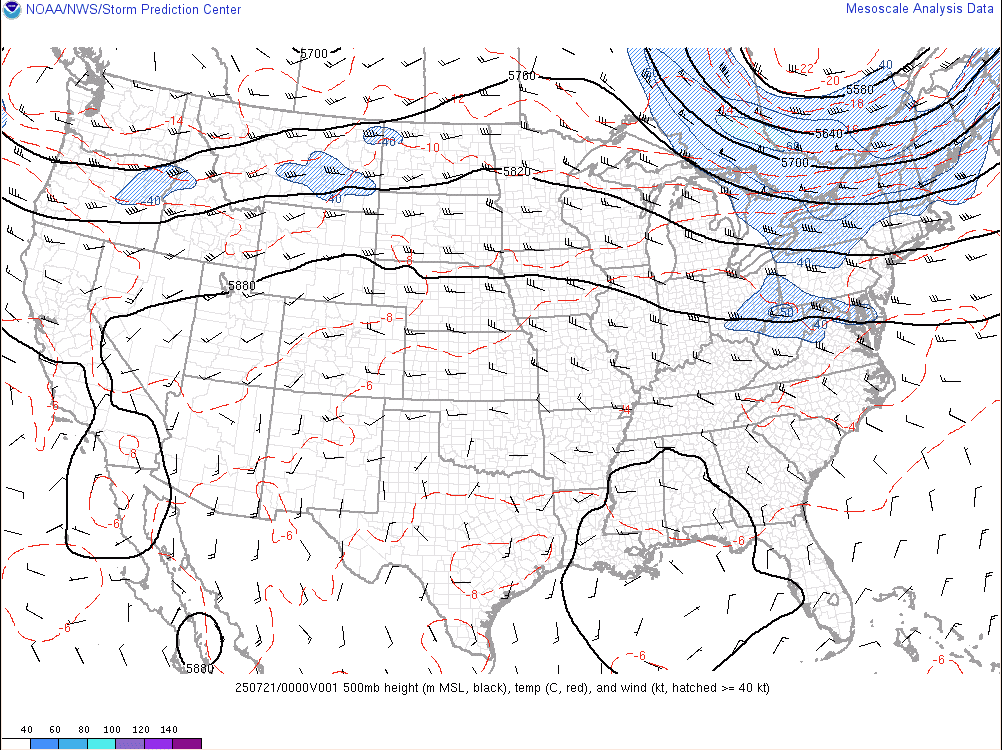
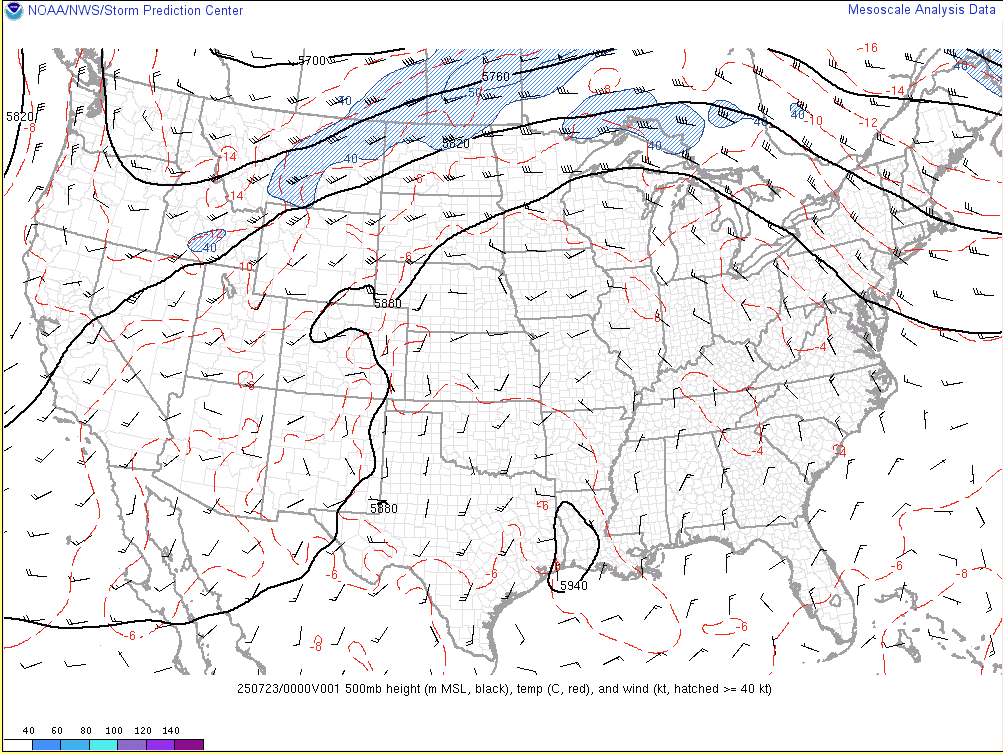
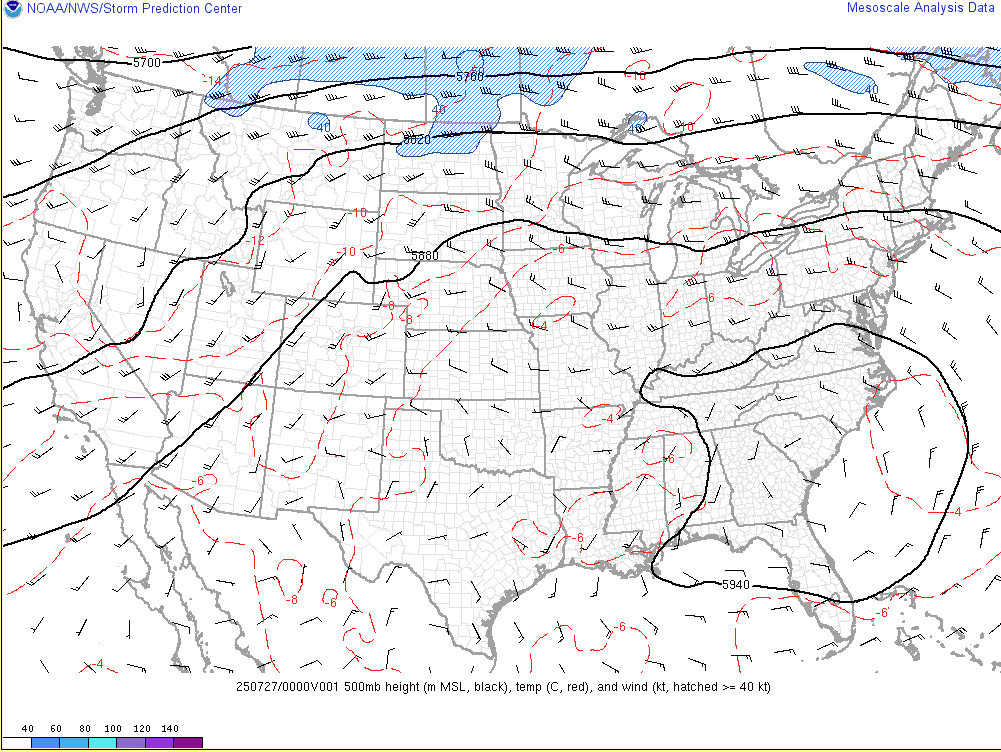
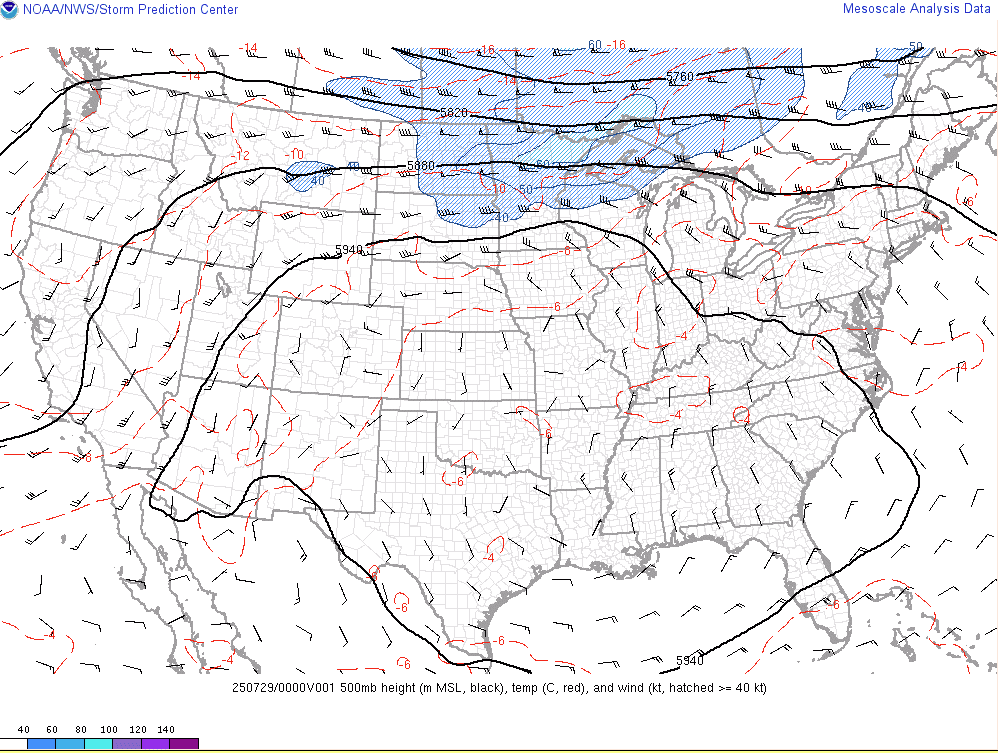
The upper level pattern at 500mb (roughly 18,000 feet above the surface) featured a 594dam ridge across the southeast U.S. initially, which gradually built northward to encompass the Ohio Valley and Great Lakes by July 22-23. Our region was initially on the edge of the ridge from the 17th through 20th, which resulted in greater coverage of showers and thunderstorms. Coverage of convection became more isolated from the 22nd through 25th as the ridge strengthened over the Ohio Valley. The ridge relaxed slightly on the 26th and 27th, before the worst days of the heat wave arrived on the 28th and 29th. A cold front finally moved through on the 31st, allowing a much cooler and far less humid airmass to filter across the region.
 |
 |
 |
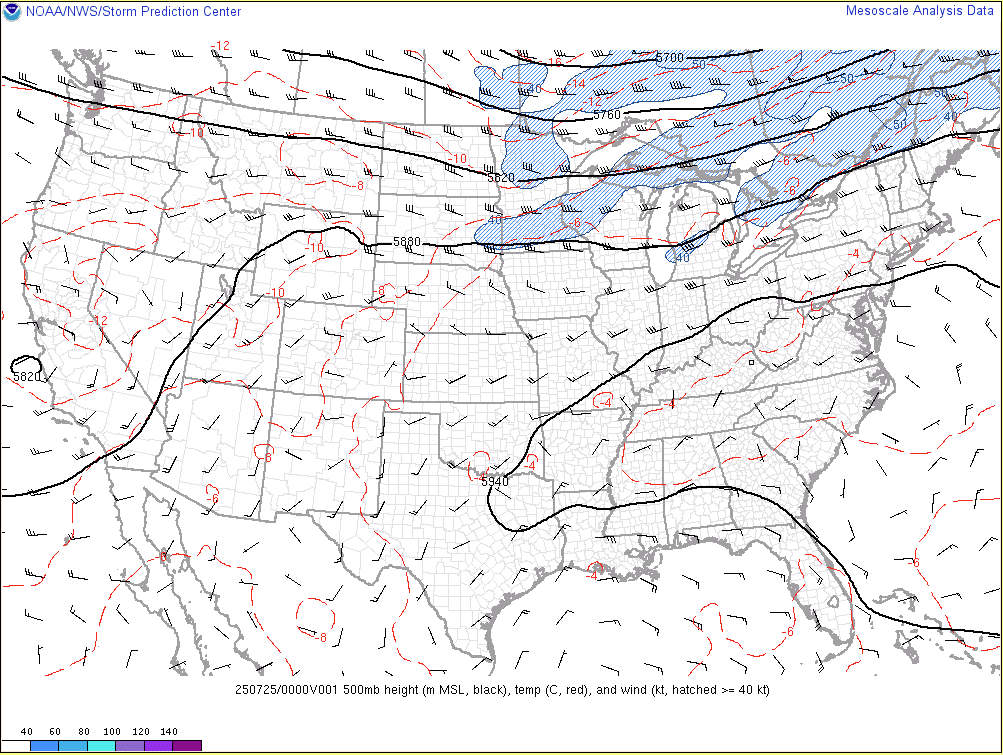 |
| July 18 - 7 PM CDT | July 20 - 7 PM CDT | July 22 - 7 PM CDT | July 24 - 7 PM CDT |
 |
 |
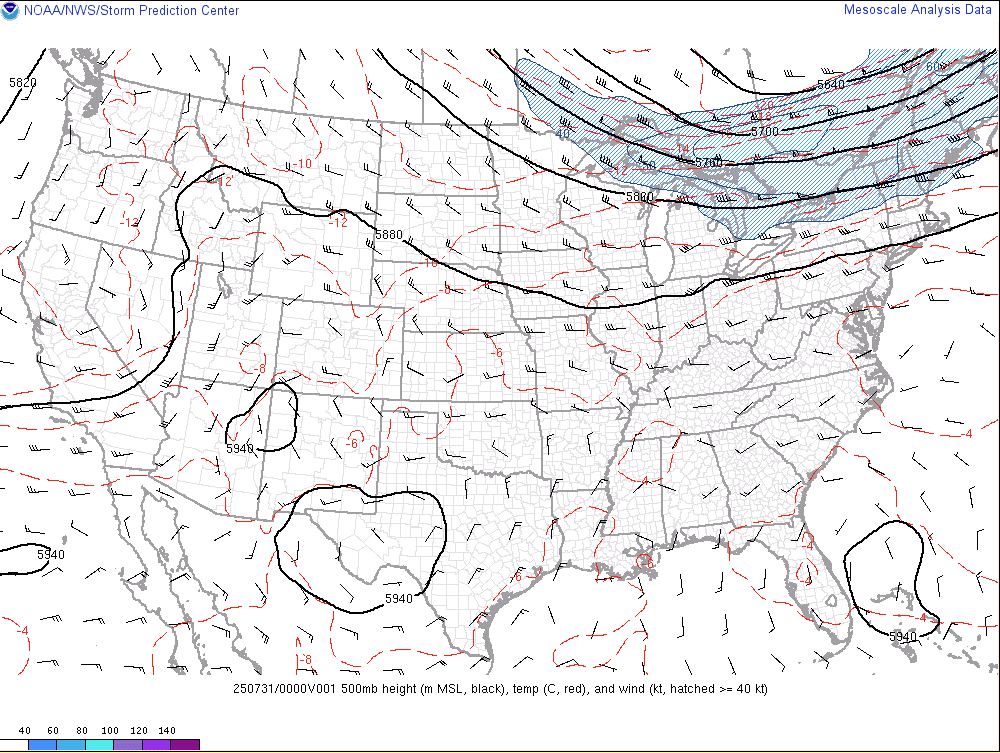 |
| July 26 - 7 PM CDT | July 28 - 7 PM CDT | July 30 - 7 PM CDT |
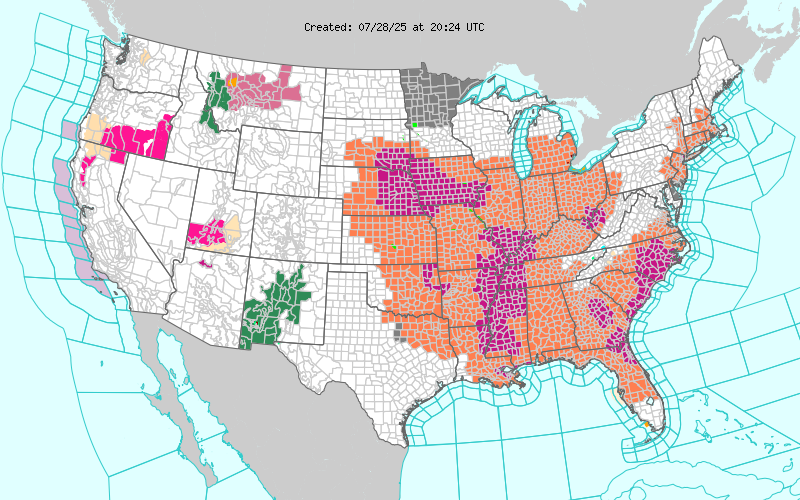 |
| Map showing all of the National Weather Service Watches, Warnings, and Advisories that were in effect the afternoon of Monday, July 28th. The magenta color shows where the Extreme Heat Warnings were in effect on this date. |
Records
Dew Point Records /Notable Streaks
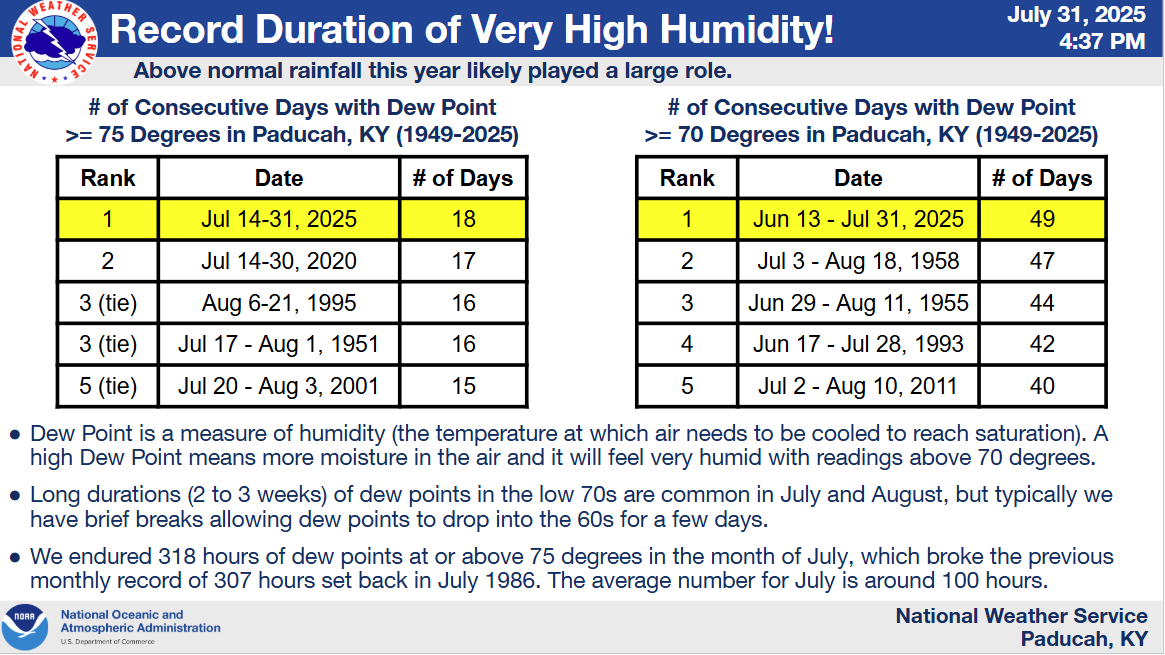
Paducah, KY broke their all-time record for consecutive days with a 75 degree dew point. They observed 18 straight days reaching this threshold from July 14-31. The previous record was 17 straight days set July 14-30, 2020. Paducah also broke their all-time record for consecutive days with a 70 degree dew point, registering 49 straight days from June 13-July 31. The previous record was 47 days set July 3 - August 18, 1958.
Cape Girardeau, MO broke their all-time record for consecutive days with a 75 degree dew point. They experienced 26 straight days reaching this threshold from July 6-31. The previous record was 18 straight days set July 14-31, 2010. They experienced 49 straight days reaching a 70 degree dew point from June 13-July 31, which was one shy of the record of 50 days set July 3 - August 21, 2016.
Evansville, IN experienced 18 consecutive days with a 75 degree dew point. This was their 2nd longest streak on record (dating back to 1948), which was 23 days set July 29-August 20, 1988.
Carbondale, IL broke their all-time record for consecutive days with a 75 degree dew point. They observed 21 straight days reaching this threshold from July 11-31. The previous record was 19 straight days set July 17 - August 4, 2001.
Poplar Bluff, MO experienced 25 consecutive days with a 75 degree dew point from July 6-30. This was tied for their 3rd longest streak on record. The longest streak is 34 days set July 5 - August 7, 2011. They also experienced 51 consecutive days reaching a 70 degree dew point, which is 1 day shy of the all-time record of 52 days set June 29 - August 19, 2015.
 |
Heat Index Records /Notable Streaks
Paducah observed 8 consecutive days reaching a heat index of at least 105 degrees from July 18-25. This was their longest streak reaching this threshold since July 1999, and one shy of the all-time longest streak of 9 days set in August 1989. They also observed 15 straight days reaching 100 degrees, which is the longest streak since a stretch of 16 days back in July 1993.
Cape Girardeau experienced 10 straight days reaching a heat index of at least 105 degrees from July 16-25. This tied their all-time longest streak, previously set July 18-27, 1999. They also reached 100 degrees on 16 straight days, which was one shy of the all-time record of 17 days set July 16-August 1, 1999. Records for Heat Index only date back to 1996 in Cape Girardeau.
Evansville observed 9 consecutive days reaching a heat index of at least 100 degrees from July 22-30. This was 2 days shy of their longest streak on record, which is 11 days set on 4 different occasions, most recently June 28-July 8, 2012.
Carbondale observed 9 consecutive days reaching a heat index of at least 100 degrees from July 22-30, which is tied for their 3rd longest streak on record. The all-time longest streak is 13 days set back in July 1999. Records for Heat Index only date back to 1996 in Carbondale.
Poplar Bluff observed 9 consecutive days reaching a heat index of at least 105 degrees from July 17-25. This was their longest streak reaching this threshold since July 1999, and 3 days shy of the all-time longest streak of 12 days set July 20-31, 1999. They also observed 15 straight days reaching 100 degrees, which is tied for the 2nd longest streak on record. This was 2 days shy of the longest streak of 17 days set July 18 - August 3, 2011. Records for Heat Index only date back to 1997 in Poplar Bluff.
 |
Media use of NWS Web News Stories is encouraged! Please acknowledge the NWS as the source of any news information accessed from this site. |
|

