June 2025 Climate Review:
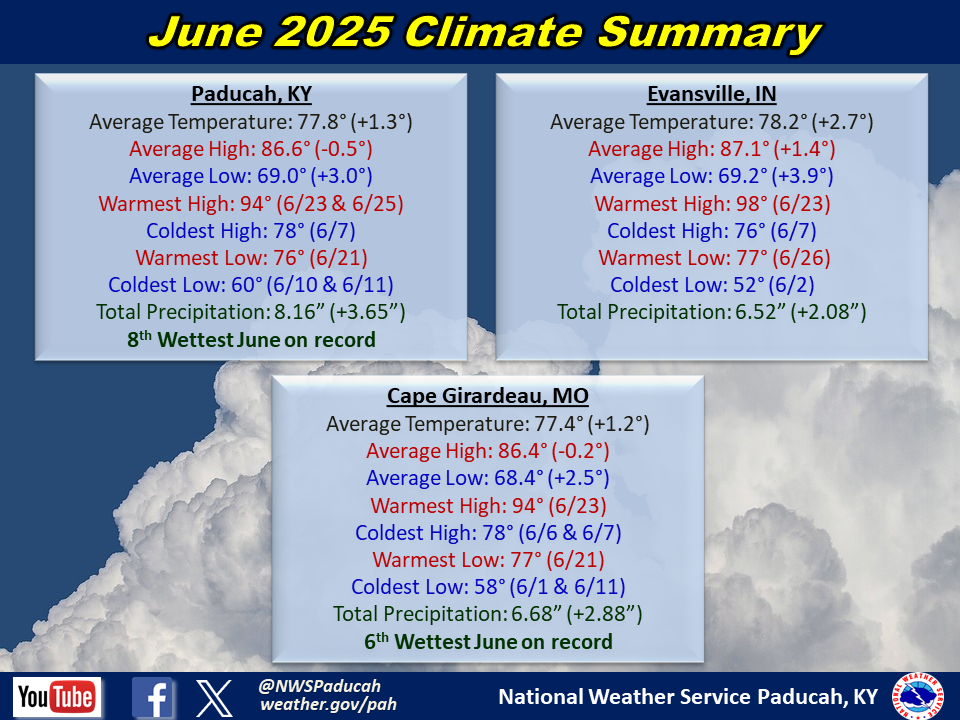
Temperatures averaged above normal by 1.5 to 2.5 degrees. Low temperatures were particularly mild averaging 3 to 5 degrees above normal, which ranked in the top 5 warmest June's for most locations. Several mornings during the first half of the month (1st, 2nd, 10th, and 11th) featured lows falling into the 50s across portions of our region. Most locations only reached the 70s for highs on the 7th and northern stations reported several days with highs in the 70s during the first half of the month. Most of the region didn’t reach 90 degrees until the 20th or 21st. This was the 3rd latest first 90 degree temperature of the season in Paducah and 2nd latest in Cape Girardeau. This was roughly 3 to 4 weeks later than normal. Once the heat set in though, we experienced a long duration of highs in the 90s along with high humidity levels. Most areas observed 7 straight days with a heat index reaching 100 degrees from the 21st through 27th. This was only the 4th time on record that Paducah observed this long of a stretch of consecutive days with heat index values above 100 in the month of June, and the first time since 2009. Most locations peaked between 100 and 105 each day, but a few sites observed readings up to 110 (Mt Vernon, IL and Murray, KY). Somewhat cooler temperatures were observed from the 28th through 30th thanks to more abundant clouds and rain, although humidity levels remained above normal to close out the month. Paducah observed 9 straight days with dew points reaching 75 degrees which was the 2nd longest streak on record in the month of June. A testament to just how unusually high the humidity was during the final 10 days of the month!
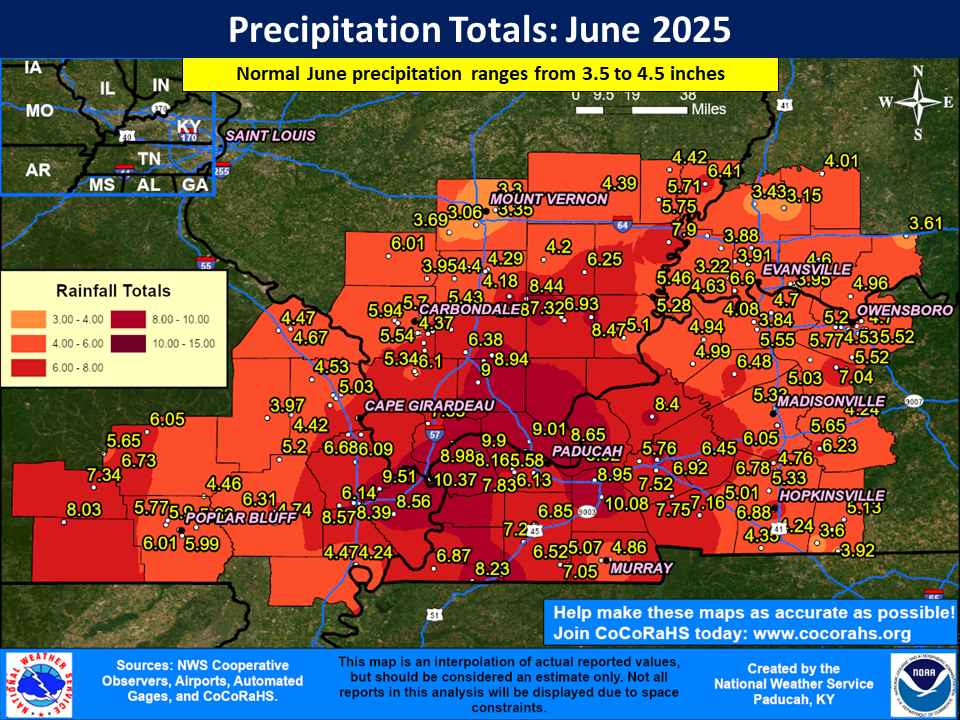
Precipitation averaged wetter than normal across the region with most areas receiving between 4 to 9 inches. These amounts were roughly 1 to 5 inches above normal. Localized higher amounts exceeded 10” including 10.57” at the Fort Massac State Park COOP station in Massac County Illinois. Portions of western Kentucky have already received 45 to 50 inches for the year, including the Marshall County mesonet which has received 50.99”. This is roughly the amount of rain we typically see in an entire year, and they’ve received it in 6 months! Several days featured amounts exceeding 2” in portions of our area, including the 5th, 6th, 13th, 16th, and 28th. There were totals around 5” in parts of southeast Missouri on the 5th, around 4.5” in Evansville on the 13th, and just over 4.5” in Hopkinsville on the 28th. A Flash Flood Emergency was issued for Evansville on the 13th, where significant flash flooding impacts were observed including numerous water rescues. The official total at the airport was 3.93" which is the 3rd wettest June day on record for Evansville. There were only a handful of stations that received less than 4” for the month, including several in southwest Indiana, southern Todd County Kentucky, and parts of Jefferson County Illinois.
The graphic below is an interpolated monthly rainfall map using actual observations. Please note that there are likely discrepancies in between observations, since the values are estimated based on nearest reports.
| June 2025 Review: Precipitation and Temperature Maps (Click on image to enlarge) |
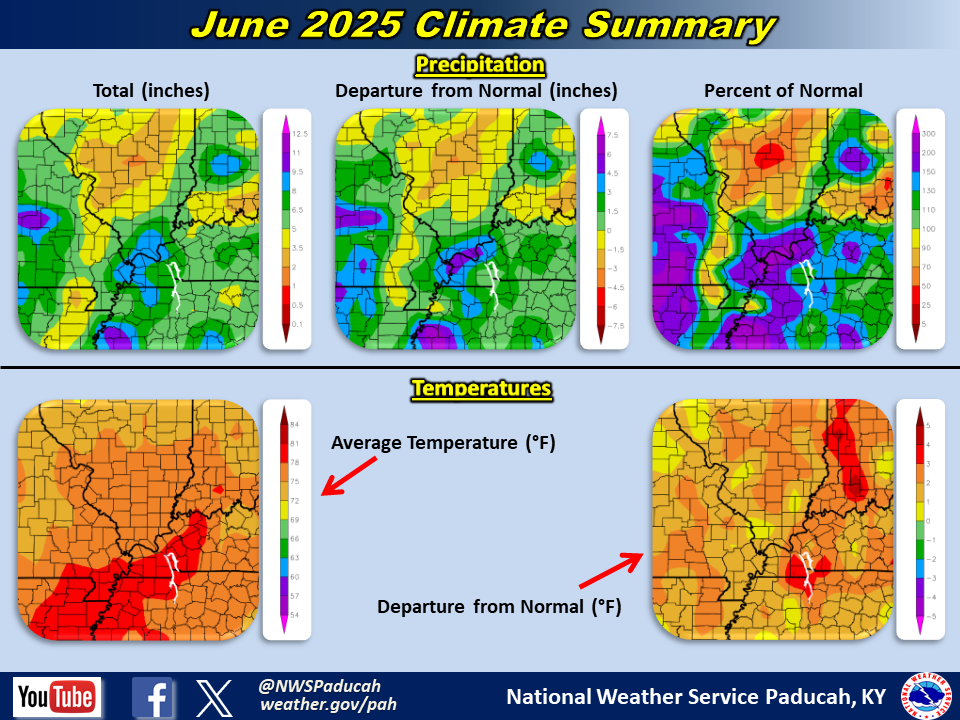 |
| Climate Maps are from the Northeast Regional Climate Center |
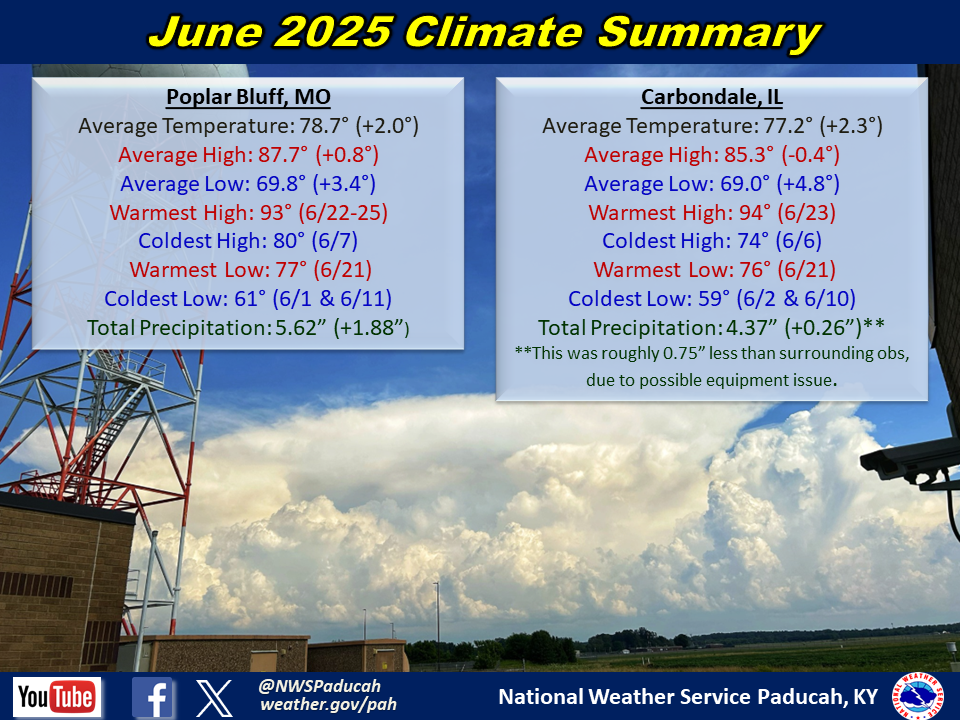
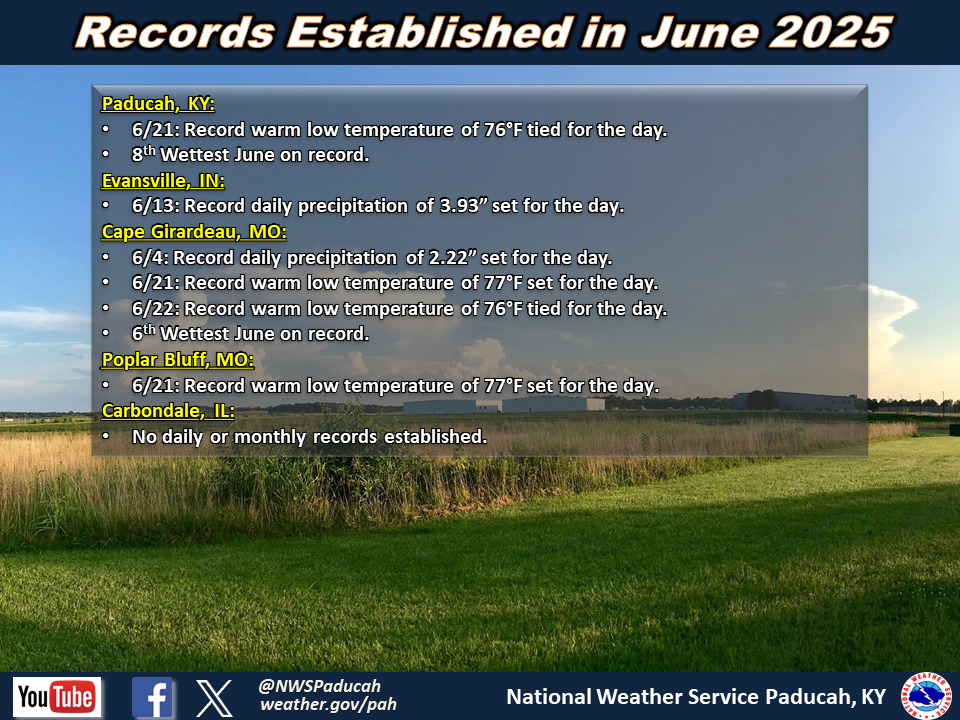
Monthly Climate Report: Paducah | Evansville | Cape Girardeau | Poplar Bluff | Carbondale