November 2021 Climate Review:
Temperatures: After one of the warmest Octobers on record, the month of November went the other direction as weather tends to do in an attempt to even things out. Monthly average temperatures ranged from around 2 to 3.5 degrees below normal. This was primarily due to the chilly nighttime lows, which averaged from 4 to 5.5 degrees below normal. In fact, the average low temperature for the month made the top ten coolest for November at Paducah, Evansville, and Cape Girardeau. Meanwhile, the monthly average high temperature was only slightly below normal at Paducah and Evansville, and actually a shade above normal at Cape Girardeau, Poplar Bluff, and Carbondale. This larger diurnal temperature range was likely attributable to the relatively dry air that prevailed through the greater part of the month.
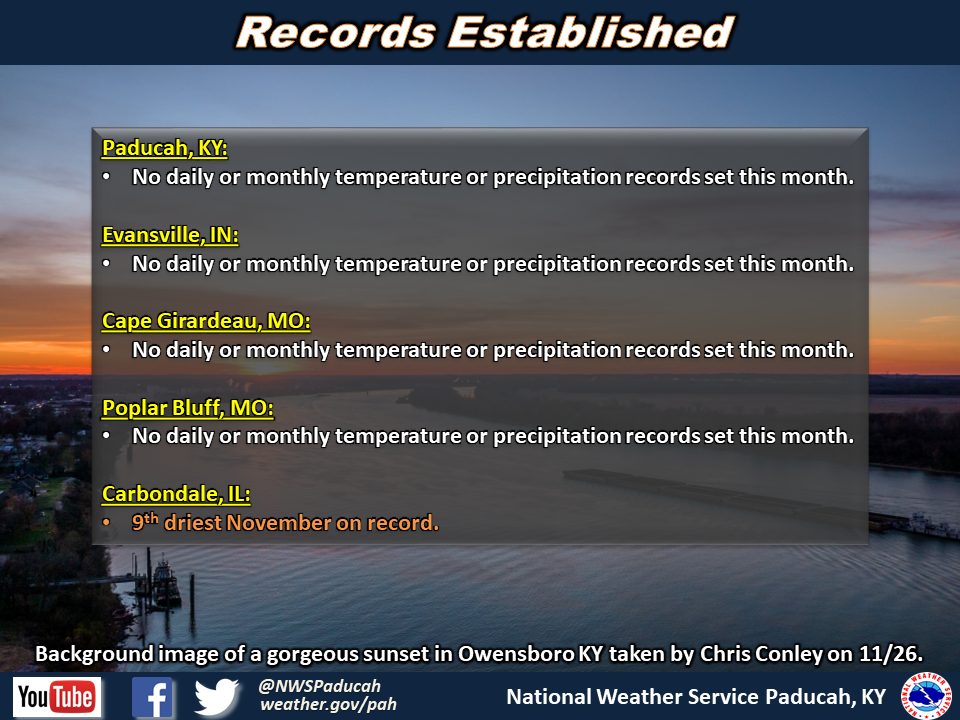
Precipitation: Drier than normal conditions took hold during the month of November. The total precipitation for the month ranged from 1.5 to 2.5 inches, which was 1.5 to 3 inches below normal. Our cooperative observer at Rosiclare, Illinois registered the most precipitation in November at 3.10 inches. Nearly 3 inches of rain also fell in multiple rain gages in the Cape Girardeau area. Some locations only measured around or slightly less than an inch of rain during the entire month. Our cooperative observer at Clearwater Dam in southeast Missouri only received 0.79 inches for the month. The official total from the ASOS in Carbondale was 0.99 inches, which ranks as the 9th driest November on record at that site. However, it should be noted that total is likely underestimated slightly due to a brief rain gage outage on November 17.
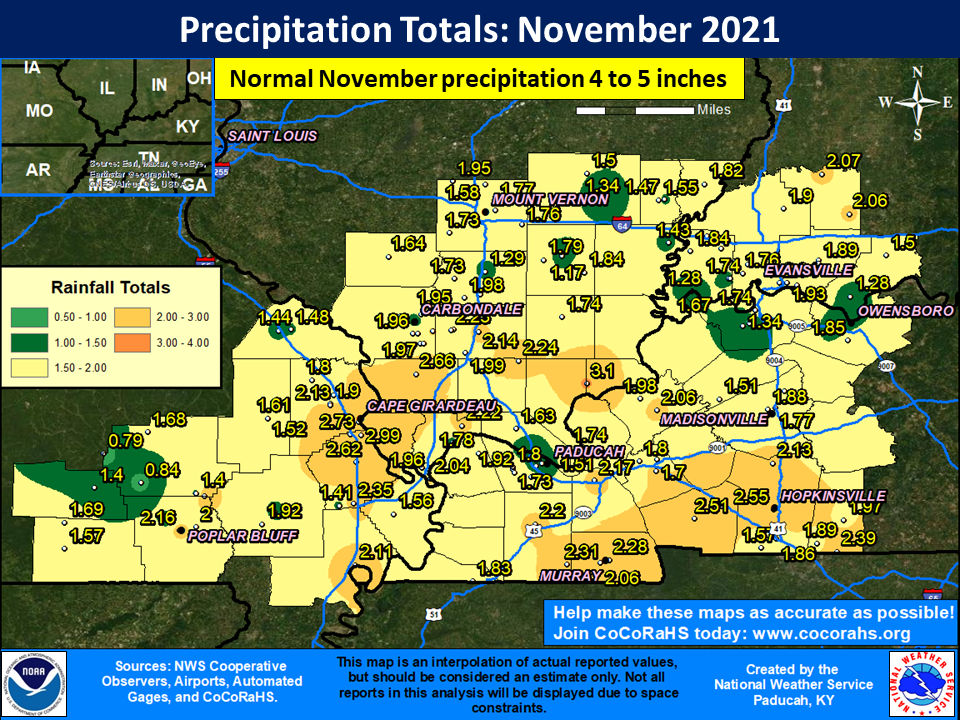
| November 2021 Review: Precipitation and Temperature Maps (Click on image to enlarge) |
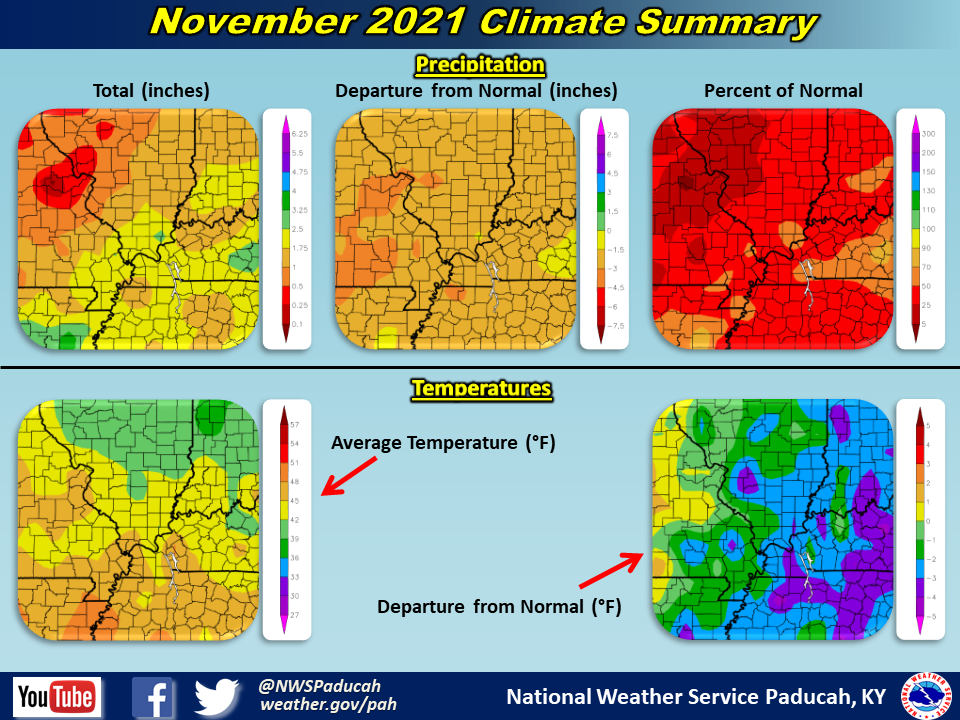 |
| Climate Maps are from the Northeast Regional Climate Center |
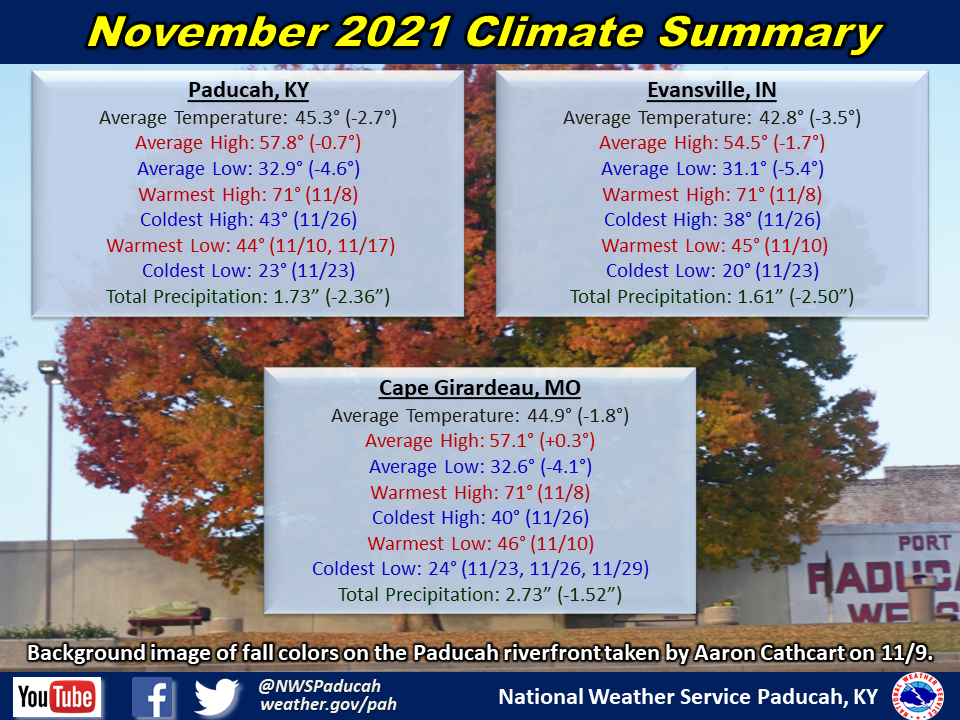
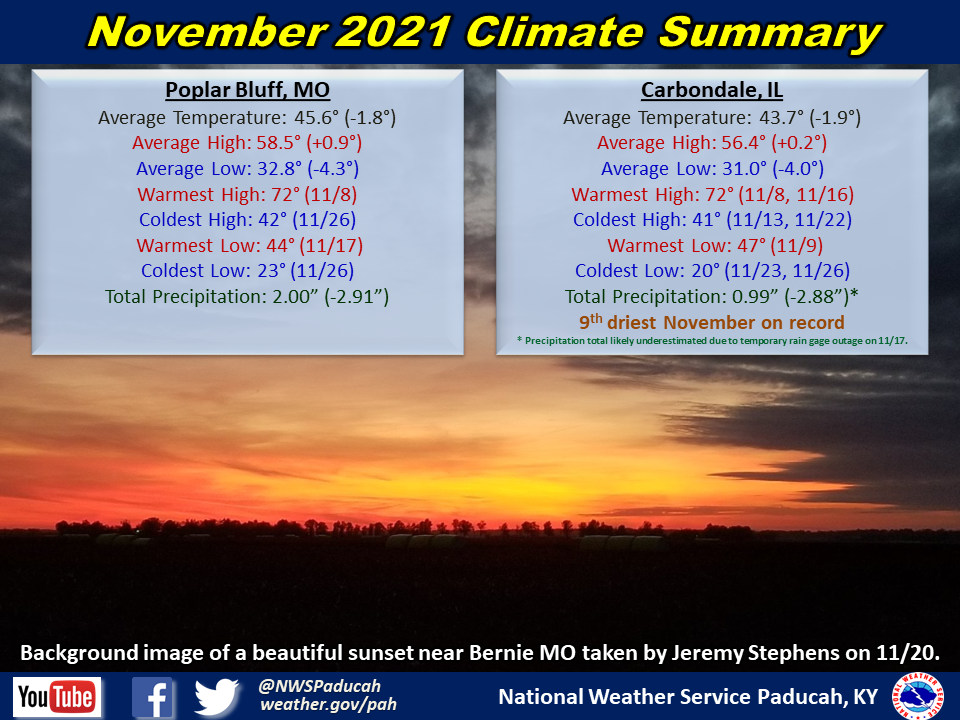
Monthly Climate Report: Paducah | Evansville | Cape Girardeau | Poplar Bluff | Carbondale