November 2023 Climate Review:
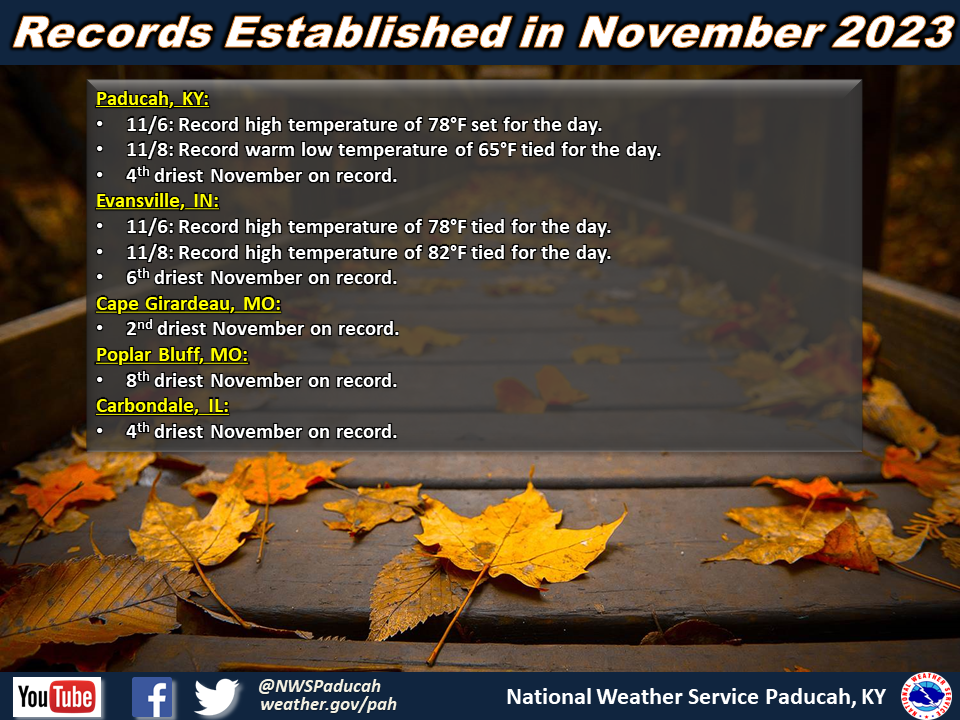
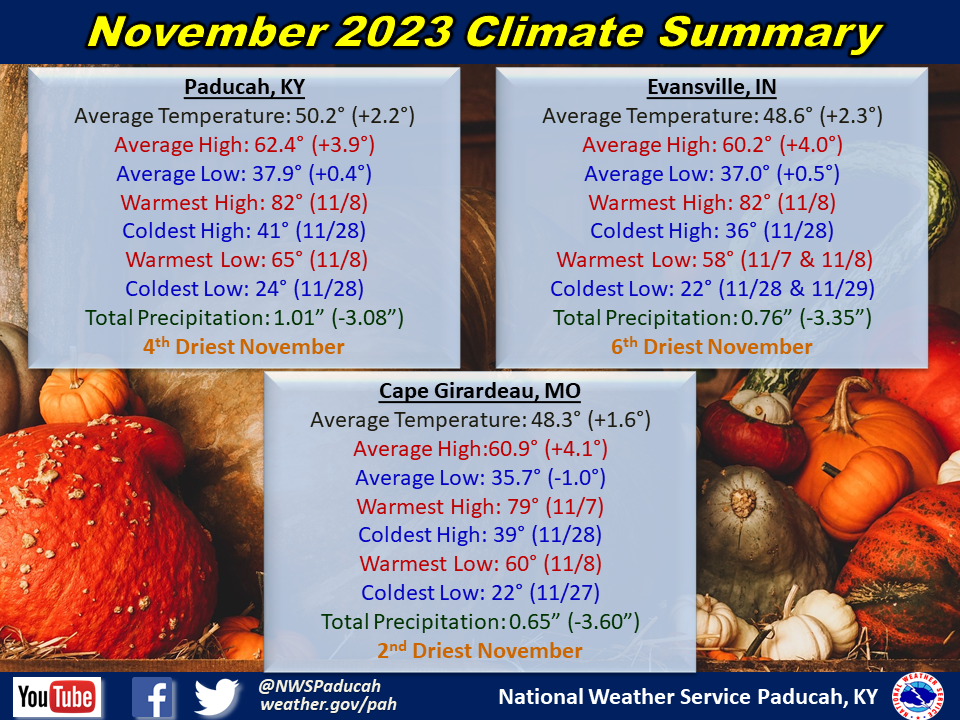
Temperatures finished above normal by around 1.5 to 2.5 degrees. The first two days of the month were rather chilly with highs only in the upper 40s and 50s while lows were in the 20s. This was followed by a prolonged warm period with temperatures above normal for most days from the 4th through 17th. Highs were commonly in the 60s and 70s, but much of western Kentucky and southwest Indiana reached 80 degrees on the 8th. This included 82 in Evansville and 83 in Owensboro. Temperatures fluctuated from the 18th through 23rd, largely remaining near normal. A cooler period descended across the region from the day after Thanksgiving (24th) through the 29th. Highs were in the 40s or 50s most of this time. The coldest day of the month for many of us was on the 28th when highs only reaching the mid 30s to lower 40s while lows fell into the low to mid 20s. A few locations even observed readings into the teens including Mt Vernon, IL and Henderson, KY. The month featured larger diurnal swings than usual, with highs averaging around 4 degrees above normal and lows near normal to even slightly below normal at some locations.
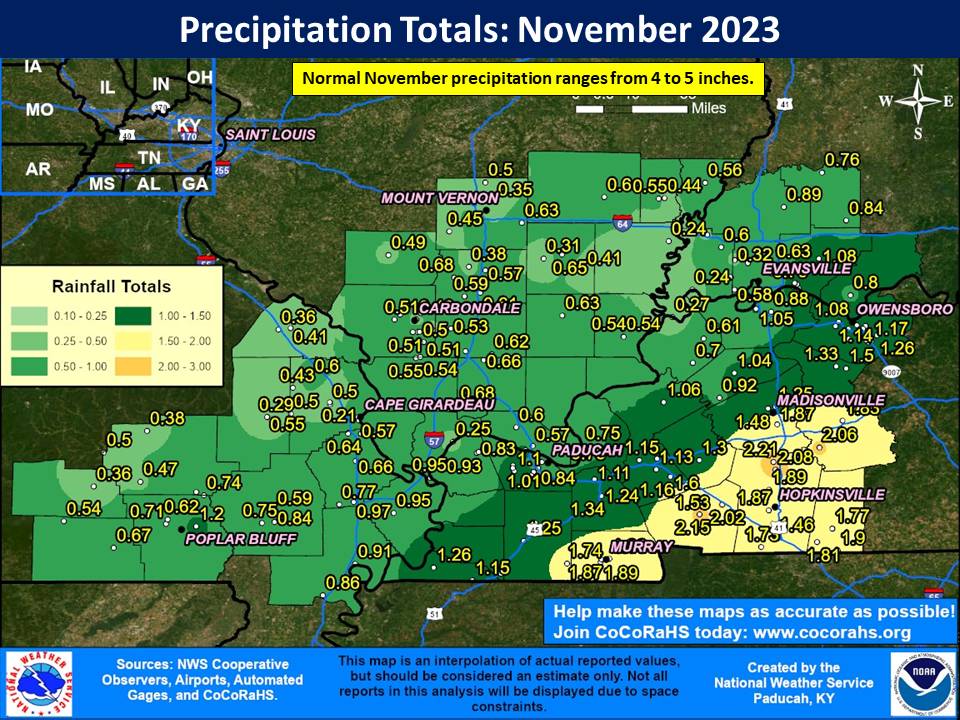
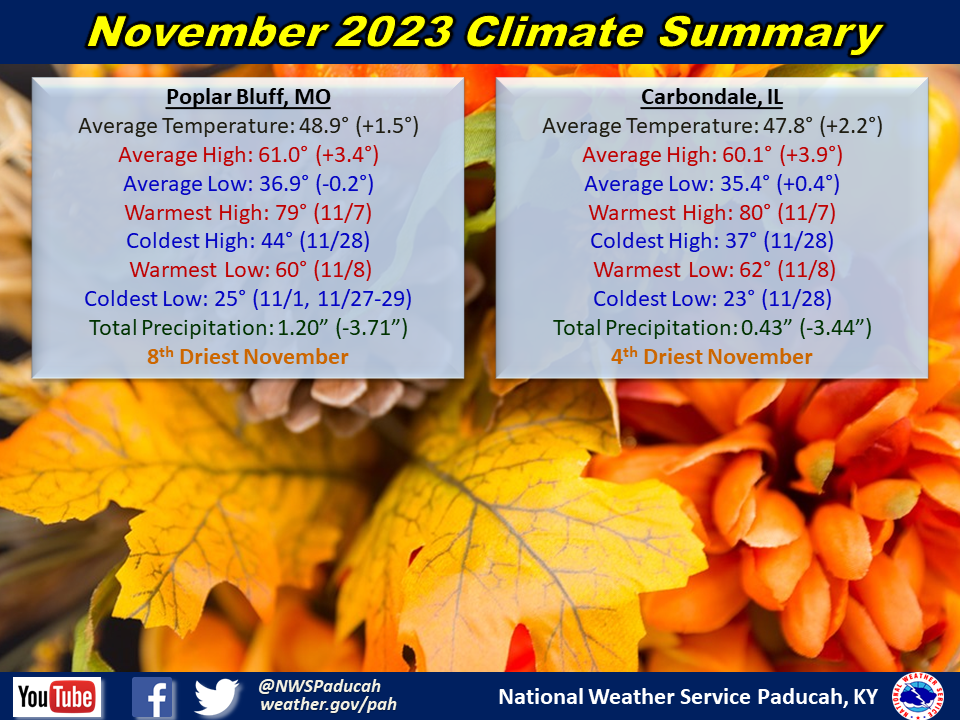
The month featured abnormally dry conditions across the entire region with precipitation totals only 0.50” to 1.50” in most locations. This was roughly 3 to 4” drier than normal or less than 25% of typical November precipitation. All 5 climate stations finished in their top 10 driest Novembers, with Cape Girardeau leading the way at 2nd driest, followed by Paducah and Carbondale at 4th driest. There were several locations across southeast Missouri, southern Illinois, and southwest Indiana that didn’t even receive 0.50” the entire month. The wettest locations were concentrated across Kentucky from the Lakes area into the southern Pennyrile where amounts of 1.5” to 2” occurred. The highest observed amount was 2.21” at the COOP station 3 miles north of Crofton in Christian County. There was no severe thunderstorm activity across our region during November.
| November 2023 Review: Precipitation and Temperature Maps (Click on image to enlarge) |
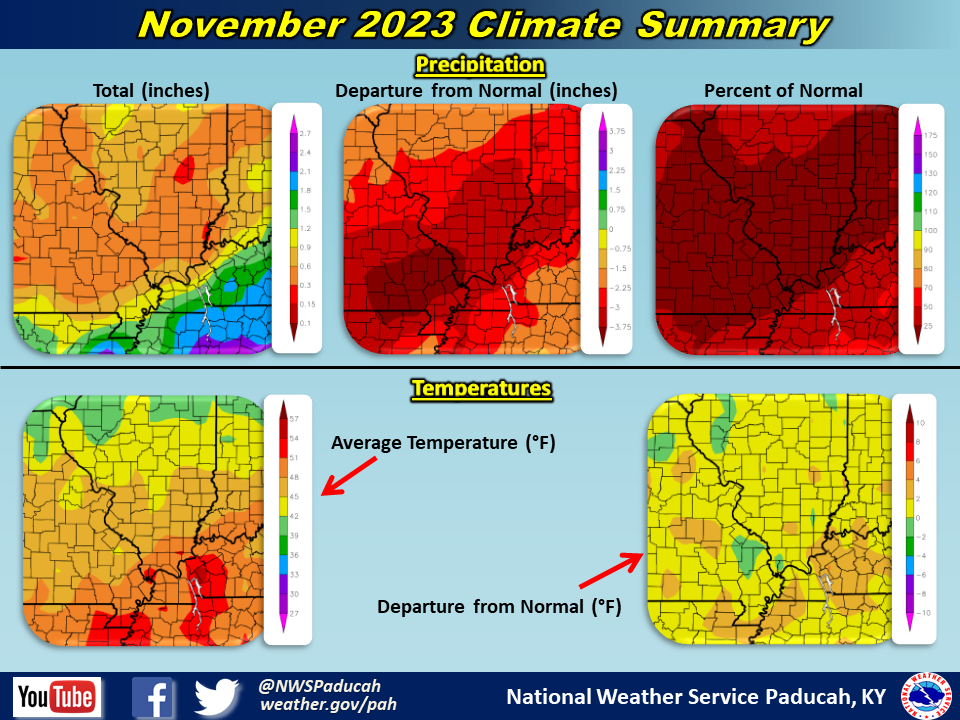 |
| Climate Maps are from the Northeast Regional Climate Center |
Monthly Climate Report: Paducah | Evansville | Cape Girardeau | Poplar Bluff | Carbondale