October 2023 Climate Review:
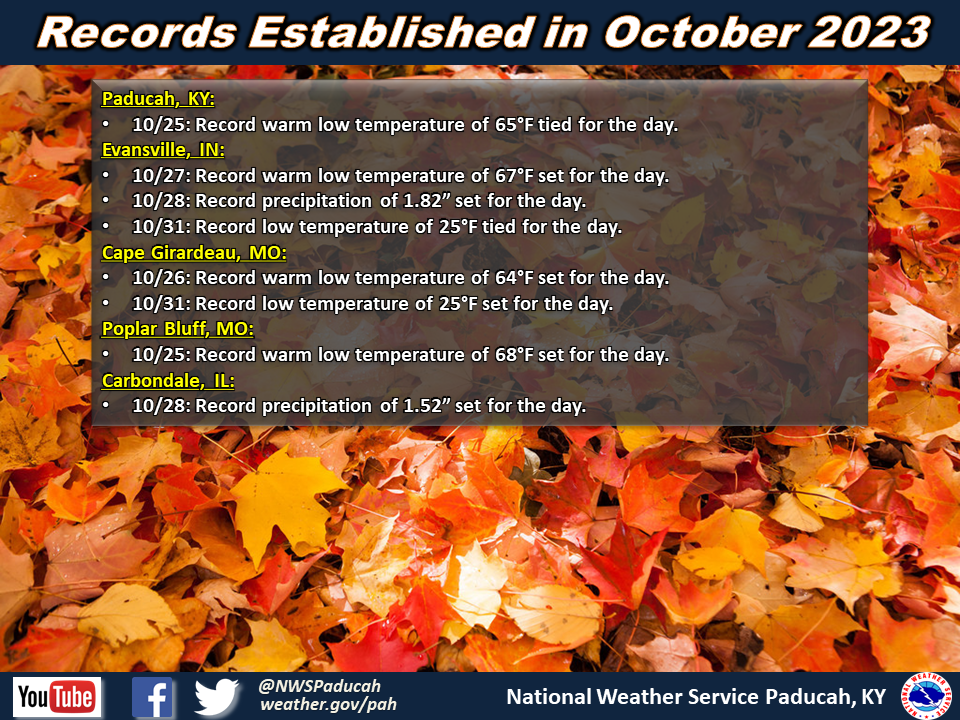
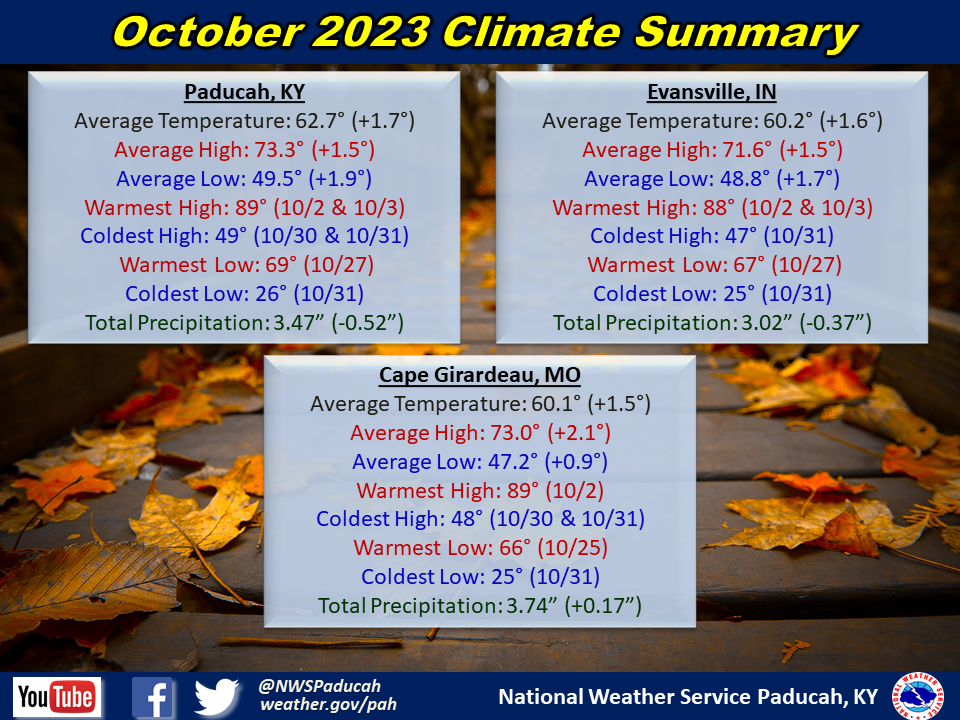
Temperatures finished above normal by around 1.5 to 2 degrees. The month started off on a warm note with highs in the mid 80s to around 90 degrees the first 4 days. A cooler stretch followed with most of the period from the 6th through 17th registering below normal temperatures. We then flipped the switch back to above normal from the 18th through 27th as highs rose back into the 70s and lower 80s. A strong cold front moved through the weekend before Halloween and we plummeted to 15 to 20 degrees below normal on the 30th and 31st. The first Fall freeze of the season occurred on the 30th or 31st, depending on your location. The entire area experienced a hard freeze on Halloween morning with temperatures in the low to mid 20s. Feels-like temperatures dropped 55 to 65 degrees between the 27th and 31st. Evansville was one of the most extreme going from a heat index of 83 on the 27th to a wind chill of 19 on the 31st. Needless to say, it was one of our coldest Halloween’s on record. Several sites registered record lows including Cape Girardeau (25) and Evansville (25). Wind chills didn’t make it out of the 30s the entire day on Halloween across northern portions of the region including Evansville, Marion (IL), and Mt Vernon (IL). Certainly more “Brrr” than “Boo” this year!
Precipitation finished near to slightly below normal across much of the region. The first 27 days of the month were abnormally dry, with most areas running 2 to 3” deficits. However, a widespread soaking rain on the order of 1.5” to 4” occurred on the 28th and 29th. This led to most areas finishing with 2.5 to 4.5” for the month. There were some localized heavier amounts in excess of 5” that were mainly focused across west Kentucky and southeast Missouri. The highest observed amount was 6.06” at a CoCoRaHS station 2.7 miles northeast of Doniphan, MO.
Severe thunderstorms were absent in October. We didn’t issue any warnings during the month, which is somewhat uncommon for October. This was the first time since 2018 and only the 7th October in the past 29 years with no warnings. On average we experience around 14 warnings issued across our 58 county area during the month of October.
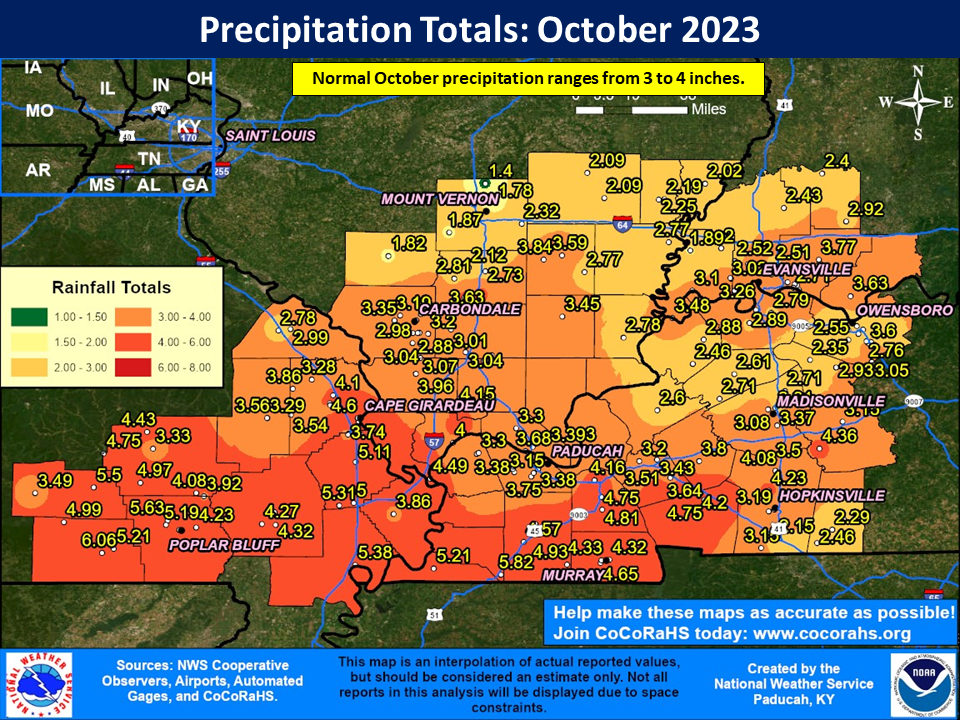
| October 2023 Review: Precipitation and Temperature Maps (Click on image to enlarge) |
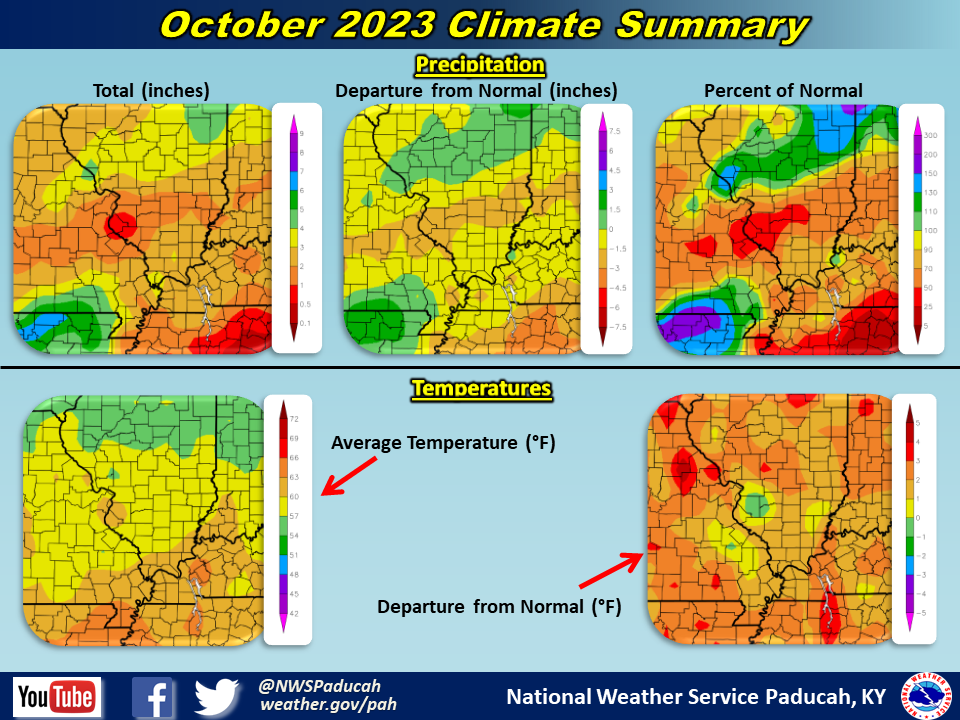 |
| Climate Maps are from the Northeast Regional Climate Center |
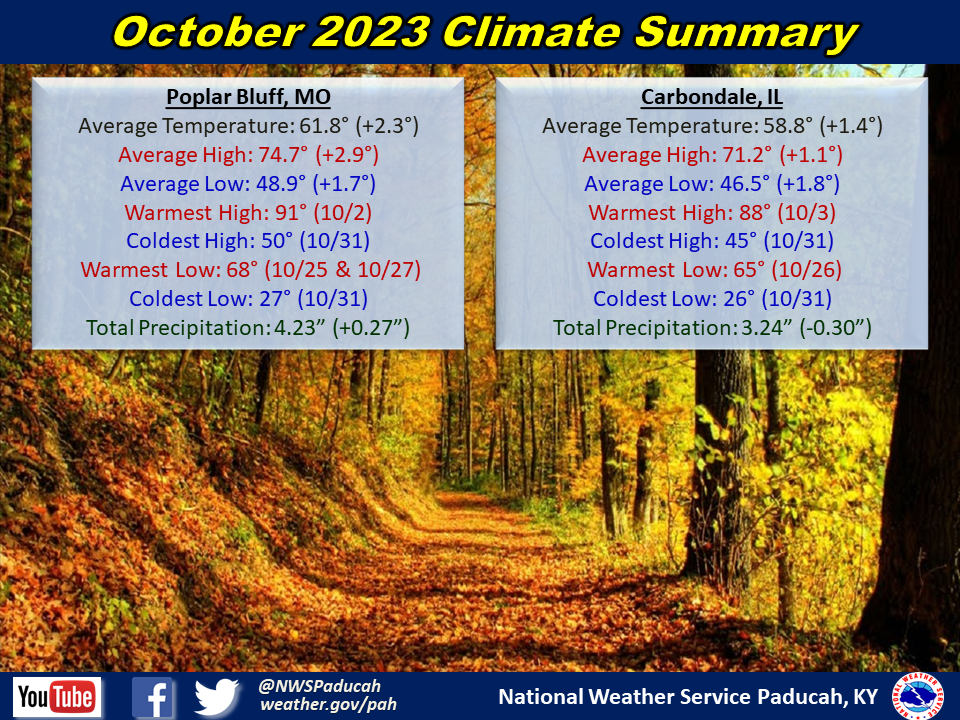
Monthly Climate Report: Paducah | Evansville | Cape Girardeau | Poplar Bluff | Carbondale