Highest Daily Dewpoint Climatology for Paducah, KY (September 1949 - July 2023)
Min = Minimum daily high dewpoint temperature recorded during that time period
10th Percentile = 10% chance that the highest daily dewpoint will fall below this threshold for that time period. Anything below the 10th percentile is considered unseasonably low. Another way to view it is that 90% of the time the daily high dewpoint will be higher than this specified threshold.
Median = Basically the average daily high dewpoint; there is an equal probability of dewpoints falling above or below this value.
90th Percentile = 10% chance that the highest daily dewpoint will fall above this threshold for that time period. Anything above the 90th percentile is considered unseasonably high. Another way to view it is that 90% of the time the daily high dewpoint will be lower than this specified threshold.
Max = Highest dewpoint temperature recorded during that time period
Dewpoints between the 25th and 75th percentile are the most common for that time period.
*NOTE: This data is only for the highest dewpoint recorded on a given day and does not take into account the lowest or average dewpoint for the whole day. The highest dewpoint is a good measure of the moisture content of the air. In the cool season, there is also an enhanced potential at severe weather occurring if the dewpoint reaches into the upper threshold (generally 95th percentile and above) for a given month.
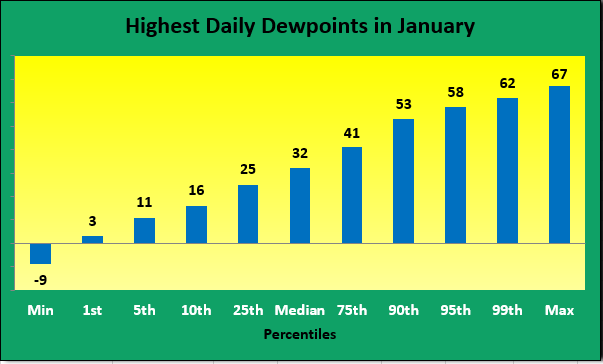
| January | # of Days | % of Days |
| Dewpoints >=65 | 2 | 0.1% |
| Dewpoints >=60 | 66 | 3.2% |
| Dewpoints >=50 | 284 | 13.9% |
| Dewpoints >=40 | 587 | 28.7% |
| Dewpoints >=30 | 1279 | 62.6% |
| Total Count: | 2042 |
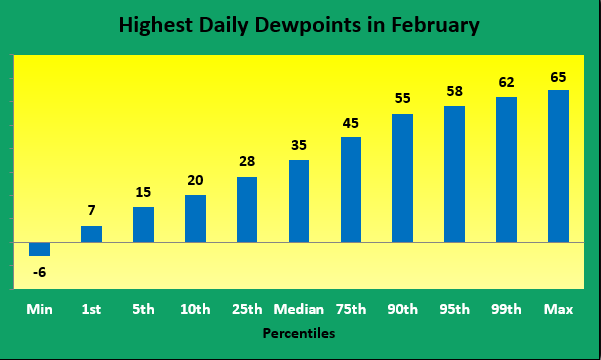
| February | # of Days | % of Days |
| Dewpoints >=65 | 1 | 0.1% |
| Dewpoints >=60 | 63 | 3.4% |
| Dewpoints >=50 | 331 | 17.8% |
| Dewpoints >=40 | 659 | 35.4% |
| Dewpoints >=30 | 1320 | 70.9% |
| Total Count: | 1863 |
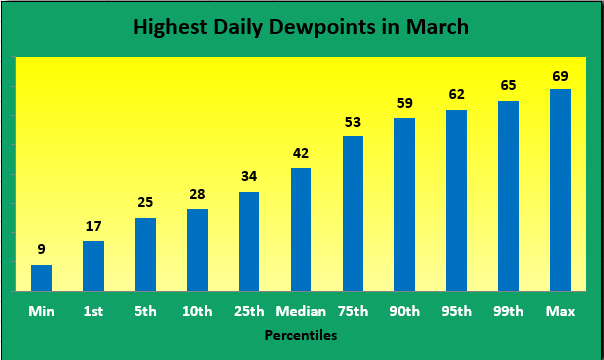
| March | # of Days | % of Days |
| Dewpoints >=65 | 22 | 1.1% |
| Dewpoints >=60 | 189 | 9.2% |
| Dewpoints >=50 | 649 | 31.7% |
| Dewpoints >=40 | 1207 | 59.0% |
| Dewpoints >=30 | 1783 | 87.1% |
| Total Count: | 2046 |
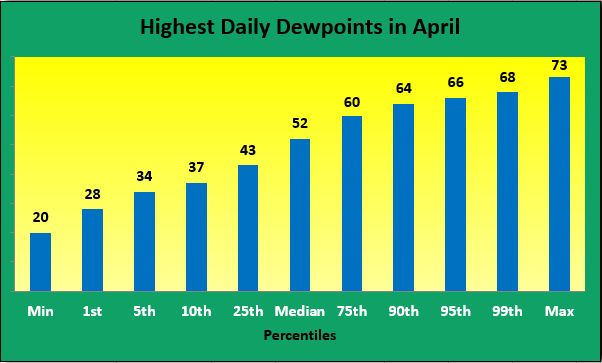
| April | # of Days | % of Days |
| Dewpoints >=70 | 9 | 0.5% |
| Dewpoints >=65 | 173 | 8.7% |
| Dewpoints >=60 | 530 | 26.8% |
| Dewpoints >=50 | 1112 | 56.2% |
| Dewpoints >=40 | 1683 | 85.1% |
| Dewpoints >=30 | 1945 | 98.3% |
| Total Count: | 1978 |
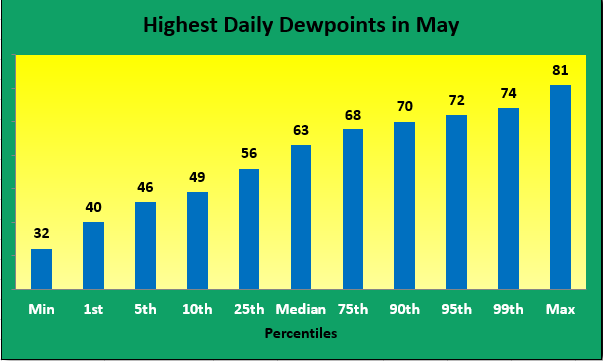
| May | # of Days | % of Days |
| Dewpoints >=80 | 1 | 0.1% |
| Dewpoints >=75 | 12 | 0.6% |
| Dewpoints >=70 | 285 | 13.9% |
| Dewpoints >=65 | 855 | 41.8% |
| Dewpoints >=60 | 1275 | 62.4% |
| Dewpoints >=50 | 1833 | 89.7% |
| Total Count: | 2044 |
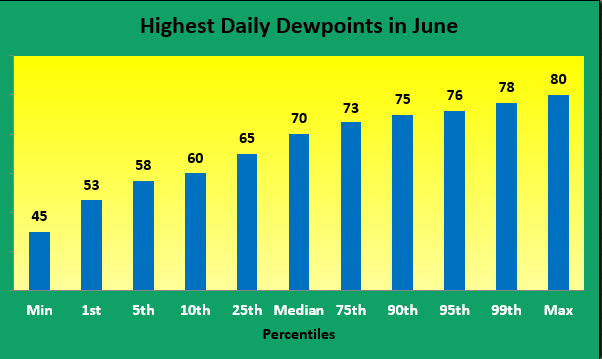
| June | # of Days | % of Days |
| Dewpoints >=80 | 1 | 0.1% |
| Dewpoints >=75 | 237 | 12.0% |
| Dewpoints >=70 | 1051 | 53.1% |
| Dewpoints >=65 | 1520 | 76.8% |
| Dewpoints >=60 | 1811 | 91.6% |
| Total Count: | 1978 |
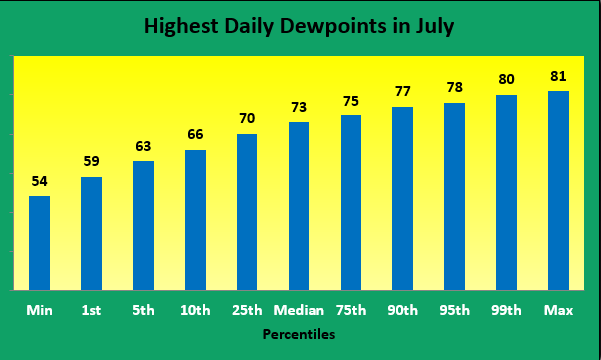
| July | # of Days | % of Days |
| Dewpoints >=80 | 25 | 1.2% |
| Dewpoints >=75 | 741 | 36.2% |
| Dewpoints >=70 | 1600 | 78.2% |
| Dewpoints >=65 | 1889 | 92.3% |
| Dewpoints >=60 | 2018 | 98.6% |
| Total Count: | 2046 |
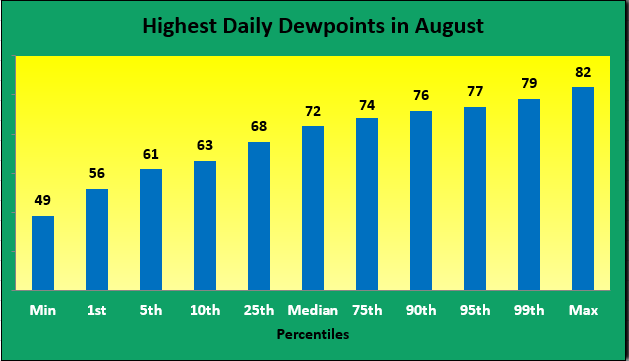
| August | # of Days | % of Days |
| Dewpoints >=80 | 16 | 0.8% |
| Dewpoints >=75 | 476 | 23.4% |
| Dewpoints >=70 | 1358 | 66.8% |
| Dewpoints >=65 | 1776 | 87.4% |
| Dewpoints >=60 | 1972 | 97.0% |
| Total Count: | 2033 |
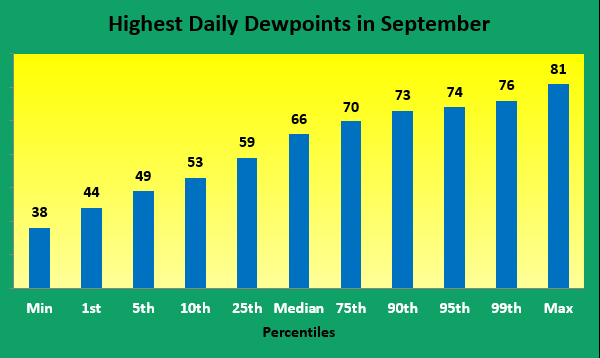
| September | # of Days | % of Days |
| Dewpoints >=80 | 2 | 0.1% |
| Dewpoints >=75 | 66 | 3.3% |
| Dewpoints >=70 | 591 | 29.8% |
| Dewpoints >=65 | 1085 | 54.8% |
| Dewpoints >=60 | 1427 | 72.1% |
| Dewpoints >=50 | 1877 | 94.8% |
| Total Count: | 1980 |
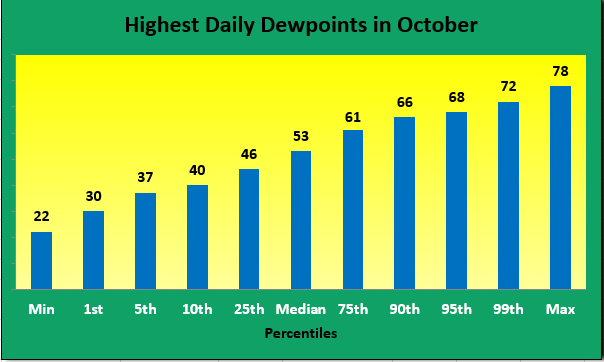
| October | # of Days | % of Days |
| Dewpoints >=75 | 2 | 0.1% |
| Dewpoints >=70 | 70 | 3.4% |
| Dewpoints >=65 | 307 | 15.0% |
| Dewpoints >=60 | 620 | 30.3% |
| Dewpoints >=50 | 1279 | 62.6% |
| Dewpoints >=40 | 1859 | 91.0% |
| Total Count: | 2043 |
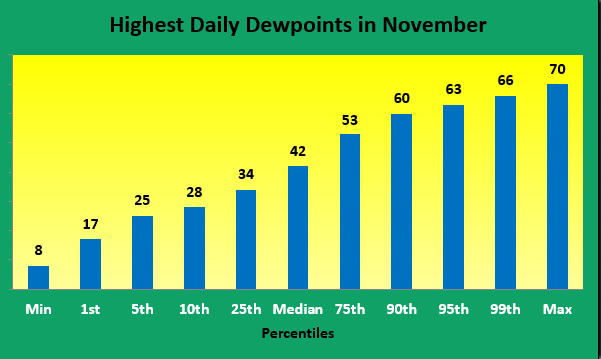
| November | # of Days | % of Days |
| Dewpoints >=70 | 1 | 0.1% |
| Dewpoints >=65 | 54 | 2.7% |
| Dewpoints >=60 | 229 | 11.6% |
| Dewpoints >=50 | 659 | 33.3% |
| Dewpoints >=40 | 1148 | 58.0% |
| Dewpoints >=30 | 1724 | 87.2% |
| Total Count: | 1978 |
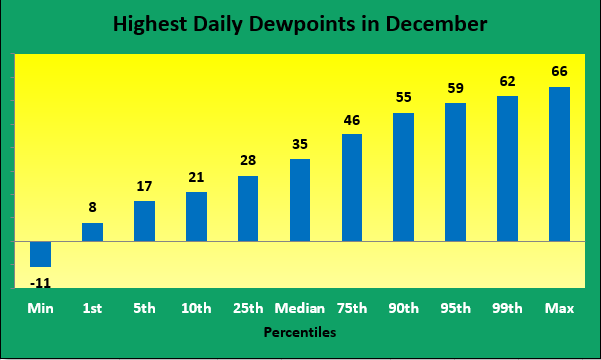
| December | # of Days | % of Days |
| Dewpoints >=65 | 10 | 0.5% |
| Dewpoints >=60 | 80 | 3.9% |
| Dewpoints >=50 | 382 | 18.7% |
| Dewpoints >=40 | 783 | 38.3% |
| Dewpoints >=30 | 1436 | 70.2% |
| Total Count: | 2047 |

