WFO Paducah High CAPE, Low Shear QLCS Tornado Study
Not peer reviewed
Spoden, Spaeth, Wielgos, York, Meffert, Presley, Ludington, Smith, Peterson
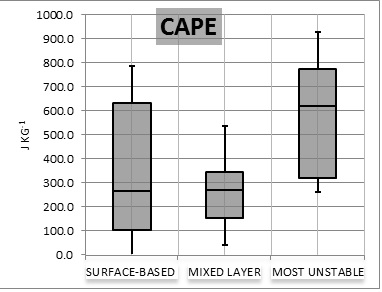
Comparison of SBCAPE, MLCAPE, and MUCAPE of all tornadoes. Note that 7 of the cases had SBCAPE and 1 case exhibited no MLCAPE
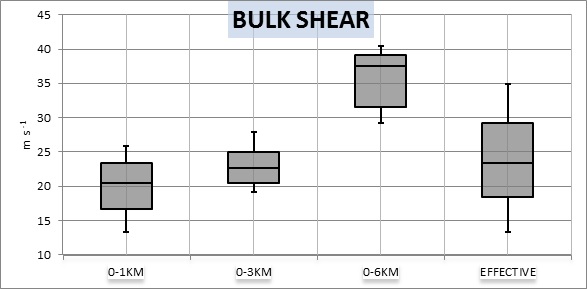
Comparison of 0-1 km, 0-3 km, 0-6 km and effective bulk shear of all tornadoes.
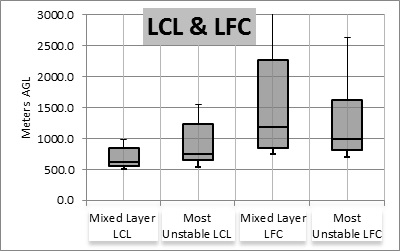
Comparison of mixed layer LCL, most unstable LCL, mixed layer LFC, and most unstable LFC of all tornadoes.
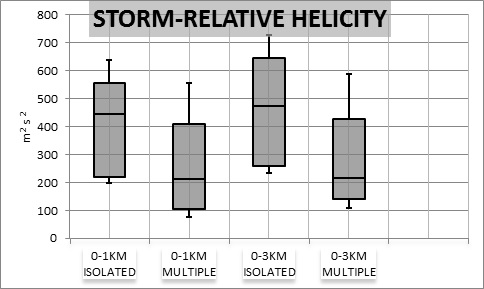
Comparison of storm-relative helicity between isolated and multiple tornadoes at both 0-1 km and 0-3 km.
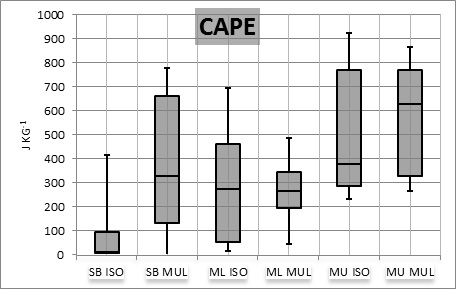
Comparison of surface based (SB), mixed layer (ML), and most unstable (MU) CAPE for isolated (ISO) and multiple (MUL) tornado events.
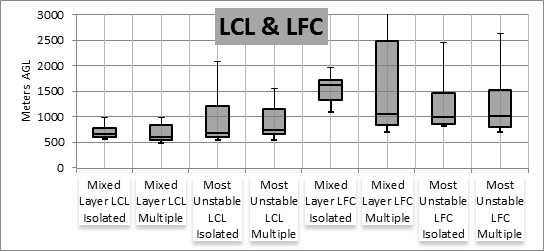
Comparison of mixed layer and most unstable lifted condensation level (LCL) and level of free convection (LFC) between isolated and multiple tornado events.
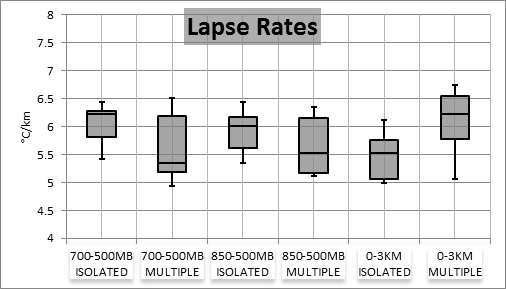
Comparison of lapse rates of 700-500 hPa, 850-500 hPa, and 0-3 km layers between isolated and multiple tornado events.
Main Findings from Rotational Values
Radar operators may want to combine Vrot analysis and low-level spectrum width values presented here to increase confidence levels for issuing tornado warnings
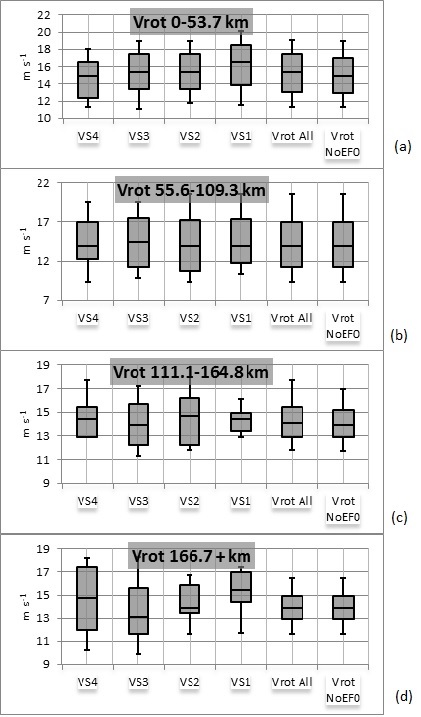
Box and whisker plots of Vrot values with median values highlighted for separate ranges and volume scans (VS), where the VS# is the volume scan prior to tornado formation and Vrot All contains all volume scans for all tornadoes in that range. Vrot NoEF0 contains all volume scans for all non EF0 tornadoes in that range.
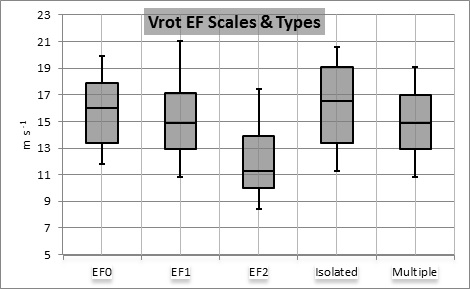
Box and whisker plots of Vrot values with median values highlighted for the different EF scales and whether the tornadoes were considered isolated or multiple tornado events.
Location of vertices within the QLCS
All circulations were examined to see whether they were located along the leading edge, embedded within, or near the rear flank of the reflectivity signature. Examples of each classification can be found in the figure below. Twenty two of the circulations were classified as being along the leading edge, 15 were considered near the rear of the storm, and 9 were considered embedded. Three of the seven multiple tornado events all followed the same characteristics of the circulations developing along the leading edge of the convection. The other four multiple events depicted a mix of leading edge, embedded, or rear flank.
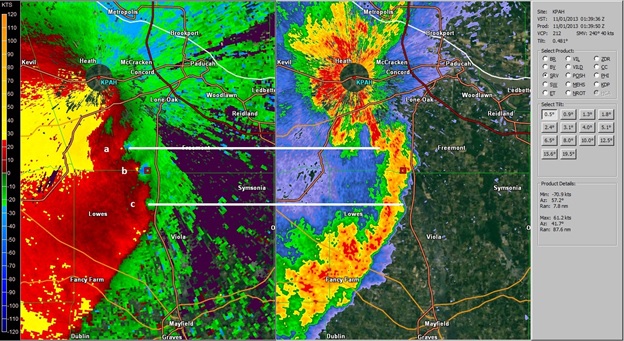
Storm-relative velocity and reflectivity from 01 Nov 2013. This depicts all three circulation location types. Circulation (a) is an example of a rear flank circulation, (b) is an example of an embedded circulation, while (c) is an example of a leading edge circulation. The white lines for (a) and (c) connect the approximate location on both SRM and reflectivity. The red box in (b) can be used for approximate location reference on both images. All three circulations produced tornadoes.
Ability to see the circulations
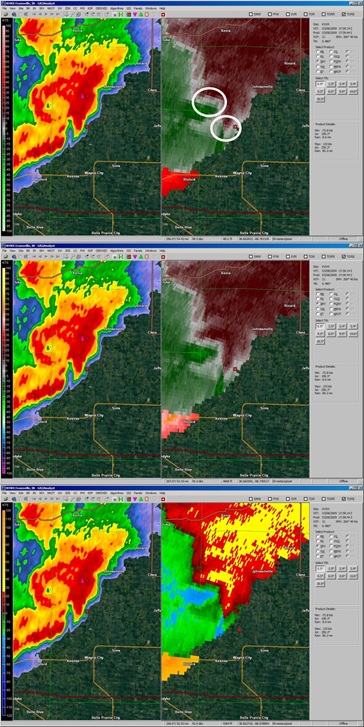
Reflectivity(L) and storm-relative velocity(R) 08 Mar 2009. Two tornadic circulations in Wayne county, IL at 1739 UTC. The image depicts three different color scales to show ease of interpretation. The top storm-relative velocity image has the circulation in white circles and is a typical red/green color scale. The middle image uses the popular “Bookbinder” velocity color scale, while the bottom image uses a local QLCS color scale.
Spectrum Width and QLCS Tornadoes
In this study, low level spectrum width (lowest two slices) was analyzed to see if there was any correlation between spectrum width values of 10.3 m s-1 (20 kt) or greater and tornado occurrence in these QLCSs. Forty four of 46 events, with the exception of events #4 and #6 in Table 1, showed spectrum width values at or above 10.3 m s-1 (20 kt) at least once in the four volume scans prior to or at tornado formation. In some cases, values of 10.3 m s-1 (20 kt) or greater would emerge prior to tornado touchdown. An example can be found in below.
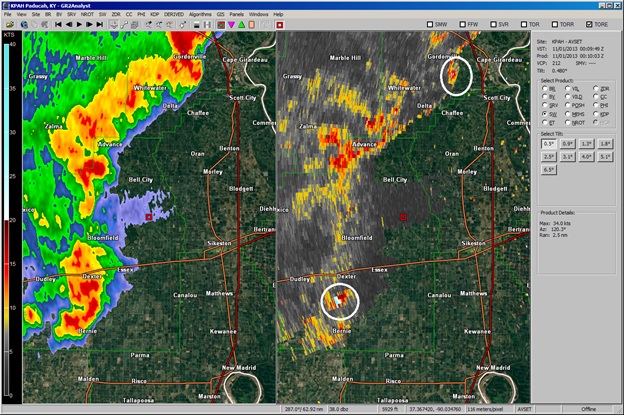
Reflectivity (L) and spectrum width (R) at 0009 UTC on 01 Nov 2013. The two circles on the spectrum width indicate the location of values > 10.3 m s-1. Tornadoes were on the ground at both locations.
Discussion
Forecasters often use “outside thresholds” other than radar data to adjust their level of situational awareness. Some of these include the presence (or lack thereof) of lightning, a categorized risk of severe storms as predicted by the Storm Prediction Center (SPC), or an SPC watch or mesoscale convective discussion. For example, archived lightning data was not available for all events, but it was determined that at least one event, 14 Oct 2012, did not contain any cloud to ground lightning. This study shows that constant monitoring of the radar data is critical in certain environments regardless of whether these “thresholds” are present or not.
Color tables used in radar interpretation are critical when determining circulation location and magnitude to the human eye. Many radar software programs allow for adjusting color tables away from the typical red/green scale. Forecasters are encouraged to be creative when working with color tables. For example, a color table used for attempting to identify HSLC tornadoes may not be as useful for supercell tornadoes.
This study found that 23 of the 46 tornadoes exhibited the strongest Vrot in the first volume scan at or just prior to tornado formation. In addition, the highest Vrot in the column usually was not at the lowest slice when the storms were close to radar. This suggests that radar operators need to be vigilant and look at the entire storm structure when considering a tornado warning. Since most of these HSLC QLCS circulations are generally at the low levels when compared to typical supercells, it is recommended that forecasters utilize four-panel presentations in the warning environment. This will also allow forecasters to easily utilize SAILS technology (Ice, et al. 2013).
Further study needs to be done to see if high spectrum width values of 10.3 m s-1 (20 kt) or greater, in combination with the Vrot values found in this study, can add to confidence levels of issuing tornado warnings with QLCS tornadoes. Preliminary work suggests that it may be beneficial to add spectrum width data when making warning decisions.

