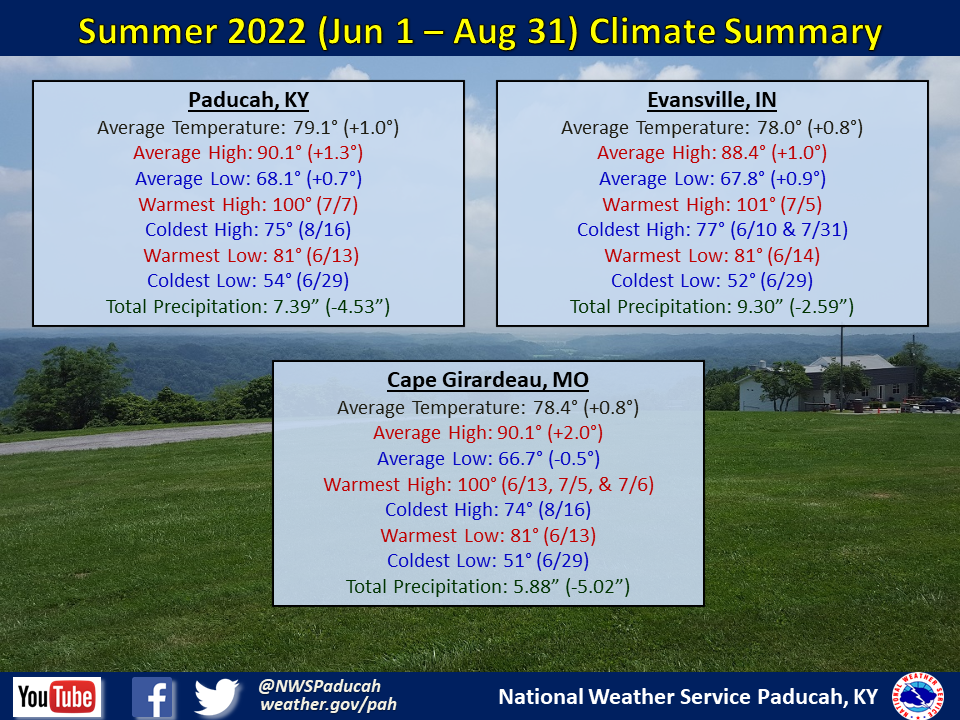
Summer 2022 Climate Summary: Temperatures averaged around 1 degree above normal. The warmest month compared to normal was July, averaging around 2 degrees above normal. June averaged around a degree above normal and then August finished near to slightly below normal. Many locations exceeded 100 degrees, which was the first time in 10 years for some. Heat and humidity was a big headline from mid June through July, but then it eased up some in August. Paducah observed 31 days with a heat index exceeding 100 degrees, including 10 days with 105 or above. Most of the 105+ days occurred in July, although 2 were observed in June.
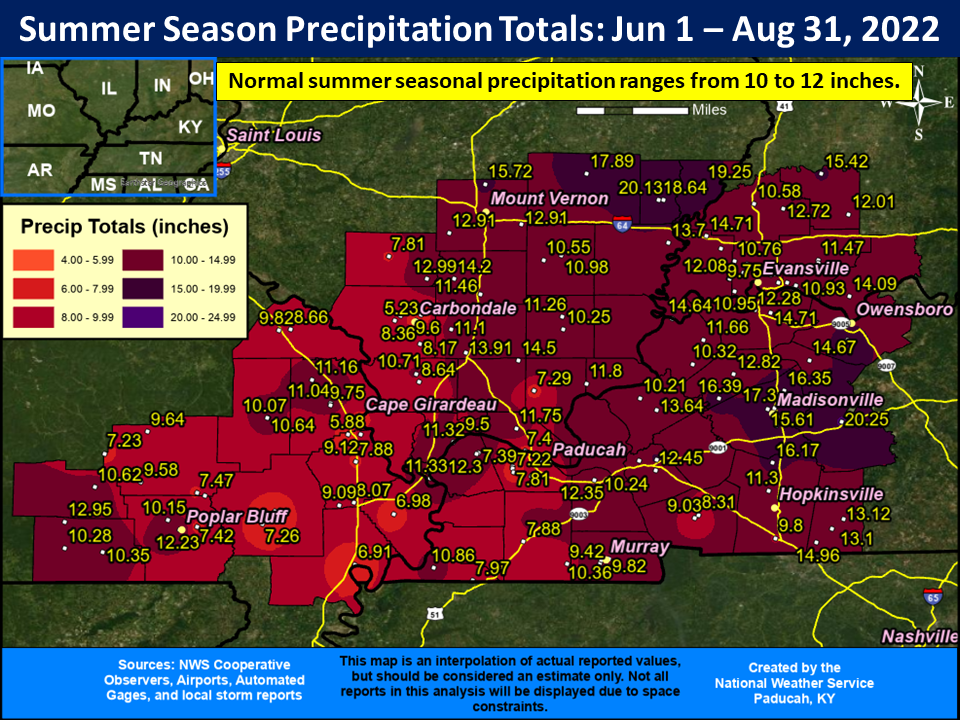
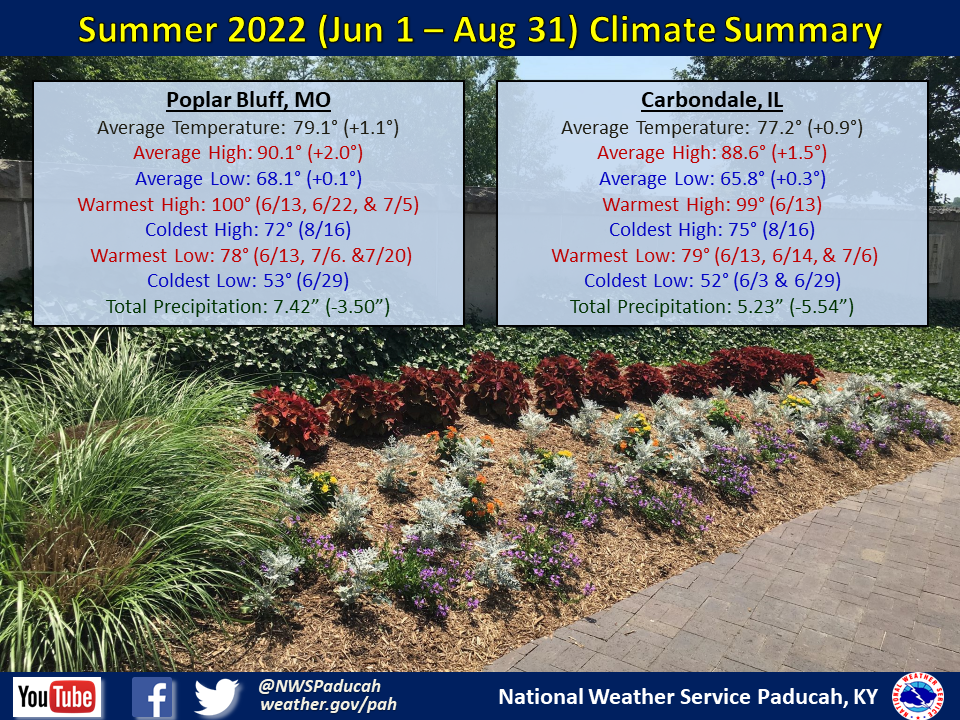
It was an abnormally dry summer across a large chunk of the region with rainfall deficits ranging from 1 to 5 inches in many locations. Many areas observed their driest summer season since 2012. The driest areas were primarily across southeast Missouri, far southern Illinois, and the Jackson Purchase region of west Kentucky. Meanwhile, it was a wetter than normal summer across sections of southern Illinois near the I-64 corridor, portions of the Pennyrile region of west Kentucky, and parts of southwest Indiana (except a dry pocket in the Evansville area). Some of this area received amounts of 15-20”. The highest observed amount in our forecast area was 20.25” at the Kentucky mesonet station 6 miles north of Greenville (Muhlenberg County). The driest month compared to normal was June, which lead to moderate to severe drought conditions developing. Beneficial rains occurred across portions of the region in July, helping to ease the drought. However, the relief didn’t occur until August in much of southeast Missouri and western Kentucky. This was our first widespread summer drought since 2012.
Disclaimer: Equipment was malfunctioning at Cape Girardeau when it rained on June 6-7 and Carbondale July 17-18 and 25. So while the official numbers suggest the 10th and 8th driest summer at these locations, they likely recorded enough precipitation on those days to avoid finishing in the top 10 driest. This is based on surrounding observations and radar estimates.
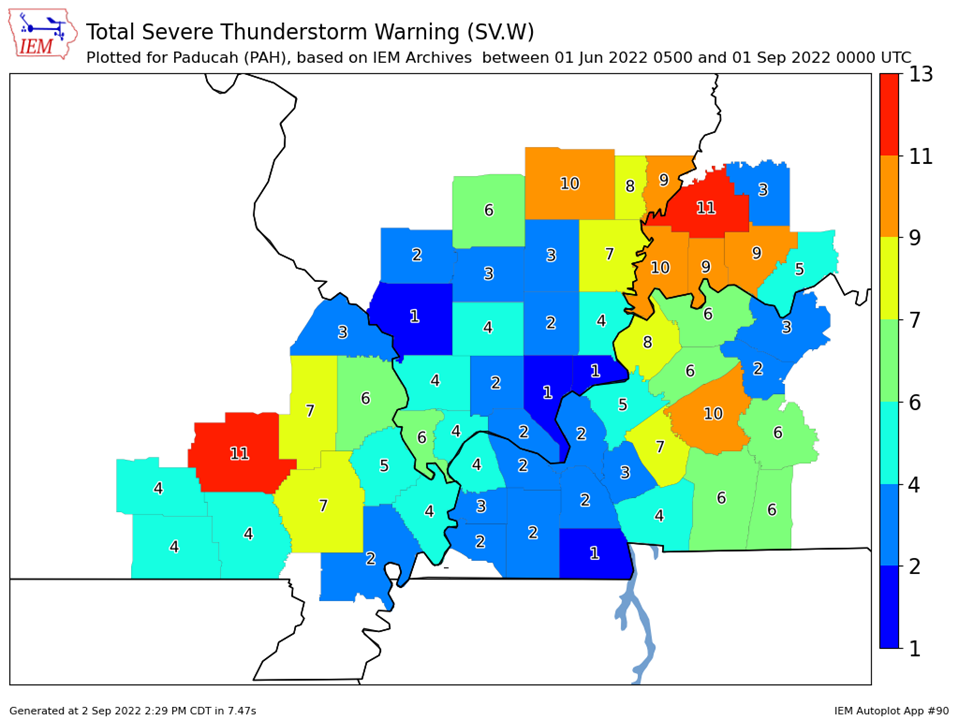
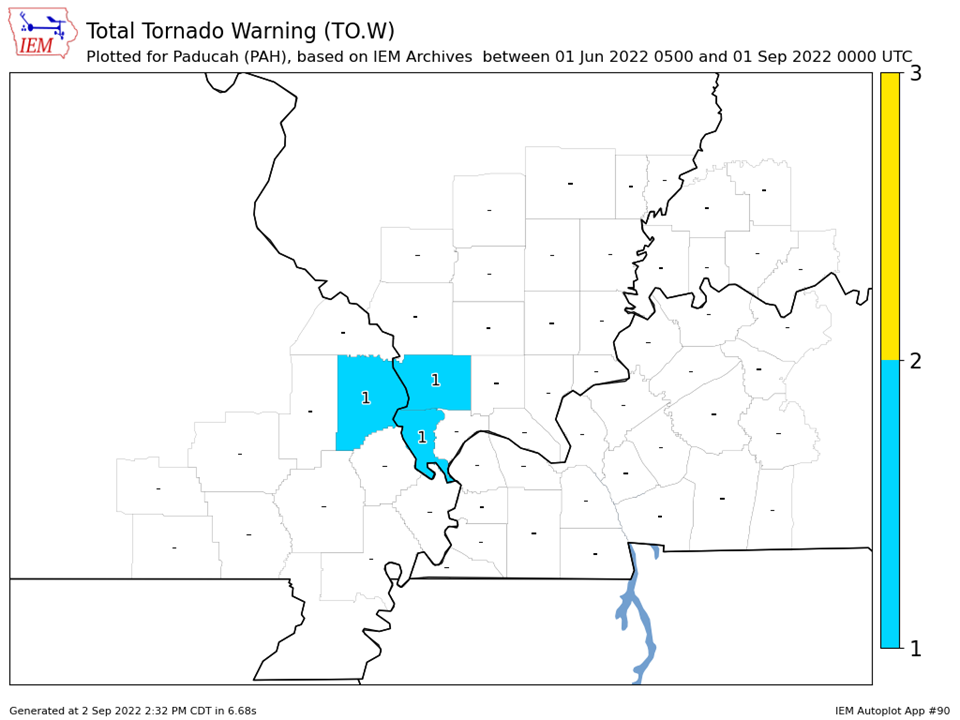
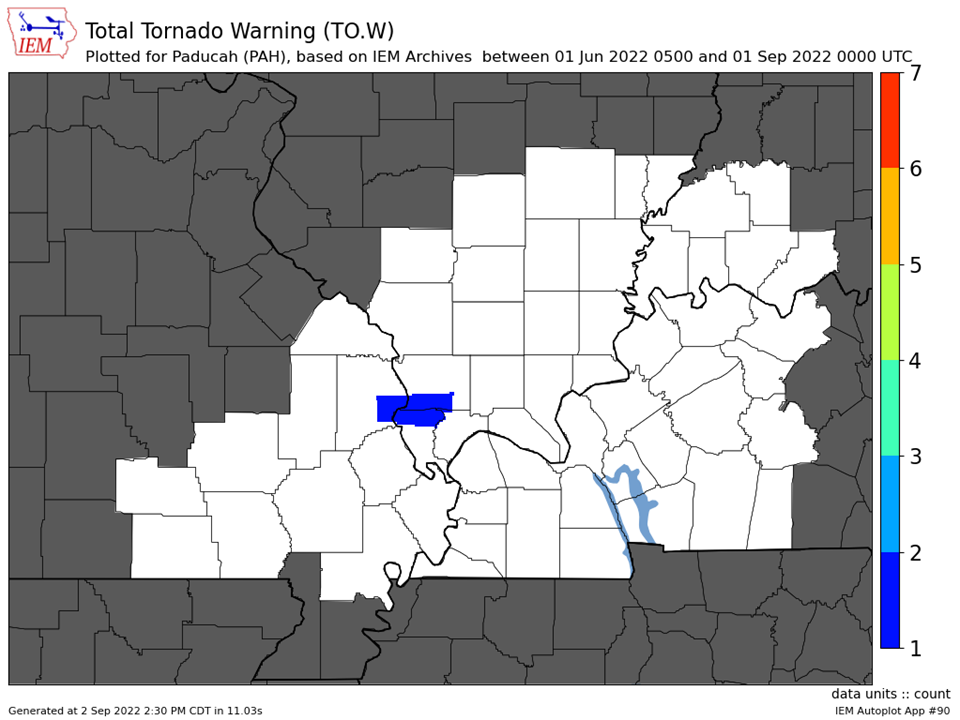
We issued a combined total of 110 severe thunderstorm and tornado warnings for our 58 county forecast area during the summer. This was right near the average of 100. However, only 1 of those was a Tornado Warning. This was the fewest number of Tornado Warnings issued by our office during the summer since 2010.
The graphic below is an interpolated rainfall map using actual observations. Please note that there are likely discrepancies in between observations, since the values are estimated based on nearest reports.
| Summer 2022 Review: Precipitation and Temperature Maps (Click on image to enlarge) |
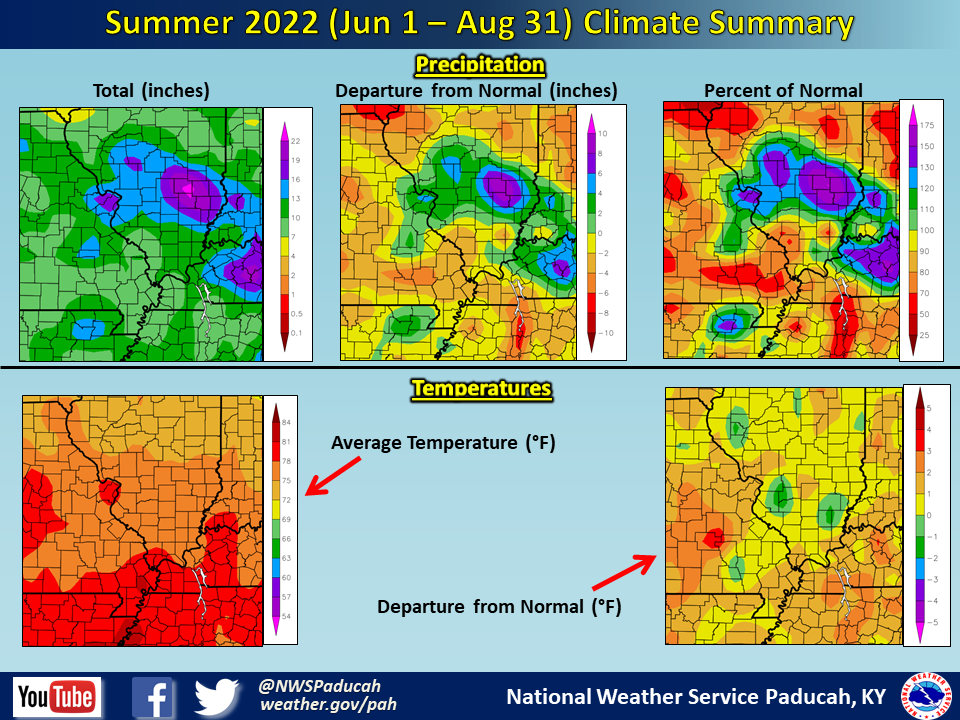 |
| Climate Maps are from the Northeast Regional Climate Center |
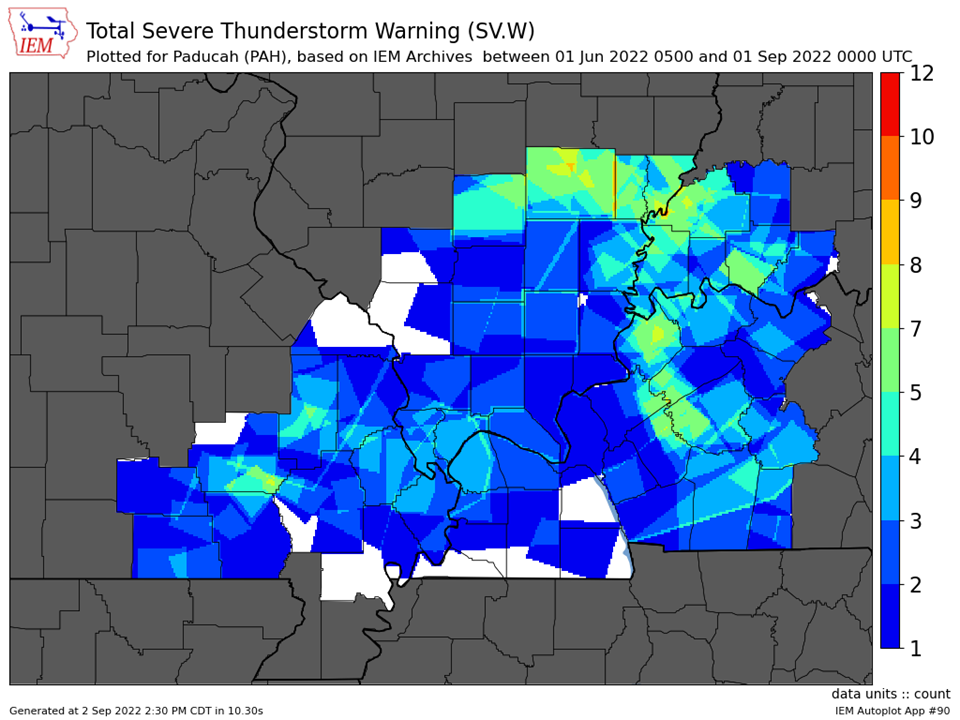
| Severe Thunderstorm Warnings - County Based | Severe Thunderstorm Warnings - Polygon Based |
 |
 |
| Tornado Warnings - County Based | Tornado Warnings - Polygon Based |
 |
 |

