On this page, you will learn what types of flooding are typical in Oregon and how to protect yourself, your family and your home. You can also find out more about significant Oregon floods. Finally, you'll find links to NWS offices that provide forecast and safety information for Oregon as well as links to our partners who play a significant role in keeping you safe.
Record Stages:
Columbia River at Vancouver: 30.8 feet on 6/1/1948, 31.0 feet on 6/13/1948
Willamette River at Portland: 30.0 feet on 6/1/1948
 |
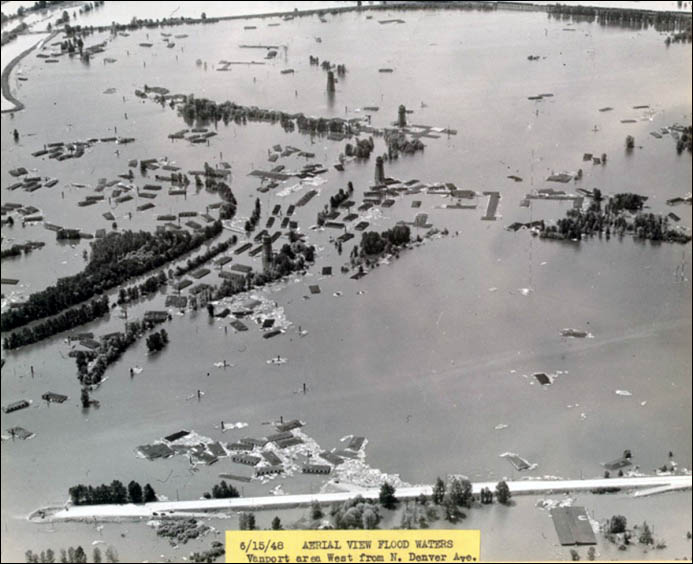 |
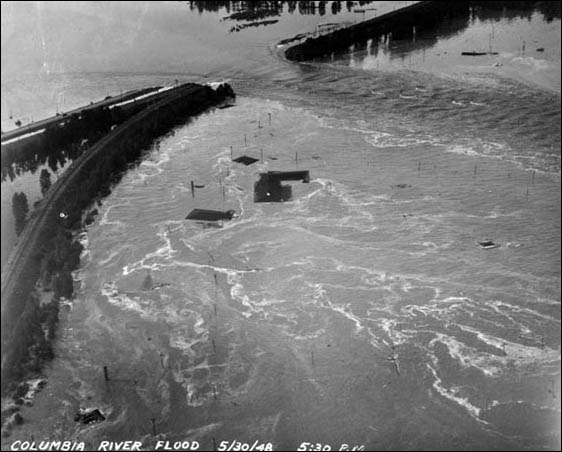
| Vanport levee failure, May 30, 1948 (USACE) | Inundation of Vanport 2 weeks after failure (Portland Public Works) |
Learn More:
This was a classic rain-on-snow flood. Heavy snow blanketed much of the state December 17-19, followed by a rapid transition to a warm, moist air mass. Rainfall totals December 20-24 were 10-20 inches in western Oregon and 5- 15 inches in central and eastern Oregon. Several inches (water-equivalent) of snowmelt added to the runoff, and areas of frozen ground increased the surface runoff.
Record Stages:
John Day River at Service Creek - Maximum discharge, 40,200 feet 3/s Dec. 23, 1964, gage height, 17.85 feet
Hood River near Hood River - Dec. 22, 1964, gage height 20.6 feet, discharge, 33,200 feet 3/s
Sandy River near Bull Run - Maximum discharge, 84,400 feet3/s Dec. 22, 1964
Marys River near Philomath - Maximum discharge, 13,600 feet3/s Dec. 22, 1964
Santiam River at Jefferson - Maximum discharge, 197,000 feet3/s Dec. 22, 1964, gage height, 24.22 feet
Luckiamute River near Suver - Maximum discharge, 32,900 feet3/s Dec. 22, 1964, gage height, 34.52 feet
Clackamas River at Estacada - Maximum discharge, 86,900 feet3/s Dec. 22, 1964, gage height, 30.36 feet
Alsea River near Tidewater - Maximum discharge, 41,800 feet3/s Dec. 22, 1964, gage height, 27.44 feet
South Fork Coquille River at Powers - Maximum discharge, 48,900 feet3/s Dec. 22, 1964, gage height, 26.51 feet
Rogue River near Agness - Maximum discharge, 290,000 feet3/s Dec. 23, 1964, gage height, 68.03 feet
 |
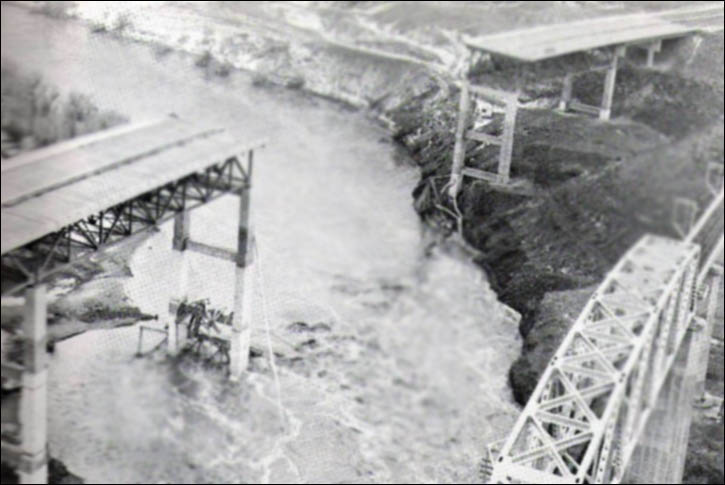 |
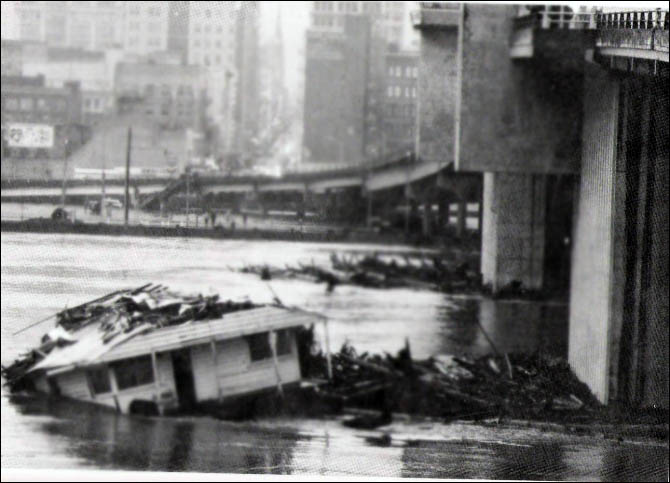
| Morrison Bridge and Willamette River in Portland (Ellis Lucia) | Hwy 30 Bridge destroyed over John Day River (Portland Public Works) |
Learn More:
Some river basins had 4-day rainfall totals exceeding 15 inches combined with another 10-15 inches of water equivalent in melted snow. Rivers rose rapidly February 6-9, with smaller creeks and rivers cresting on the 7th and 8th and larger rivers cresting on the 9th and 10th. There were 8 fatalities in Oregon. Several of these were the result of people driving their cars into flooded areas and being swept away. In addition, a woman died when her house along the Sandy River was undermined and slid into the river. A young girl in Scio was swept away when she went outside to get the newspaper. Total damages across the Pacific Northwest exceeded $1 billion.
Record Stages:
Grande Ronde River at Troy - Maximum discharge, 51,800 feet3/s Feb. 9, 1996, gage height
Deschutes River at Moody - Maximum discharge, 70,300 feet3/s Feb. 8, 1996, gage height, 12.08 feet
Mohawk River near Springfield - Maximum discharge, 13,500 feet3/s Feb. 7, 1996, gage height, 23.11 feet
South Yamhill River at McMinnville - Maximum discharge, 47,100 feet3/s Feb. 9, 1996, gage height, 59.33 feet
Molalla River at Canby - Maximum discharge, 43,600 feet3/s Dec. 22, 1964, gage height, 26.76 feet
Pudding River at Aurora - Maximum discharge, 43,700 feet3/s Feb. 8, 1996, gage height, 30.72 feet
Tualatin River at West Linn - Maximum discharge, 26,400 feet3/s Feb. 10, 1996, gage height, 18.32 feet
Willamette R below Falls at Oregon City - Maximum gage height, 46.04 feet Feb. 9, 1996
Nehalem River near Foss - Maximum discharge, 70,300 feet3/s Feb. 8, 1996, gage height, 29.56 feet
Umqua River near Elkton - Maximum discharge, 265,000 feet3/s Dec. 23, 1964, gage height, 51.95 feet
 |
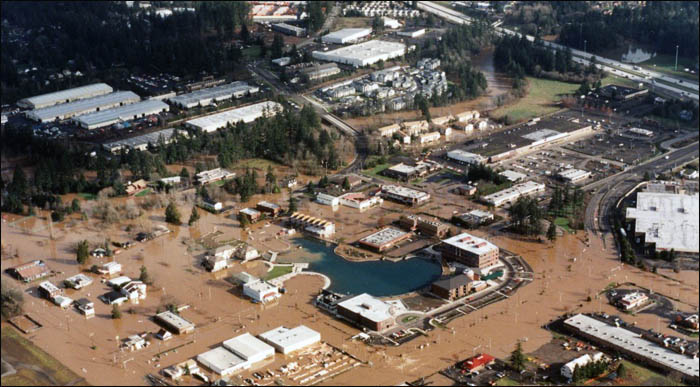 |
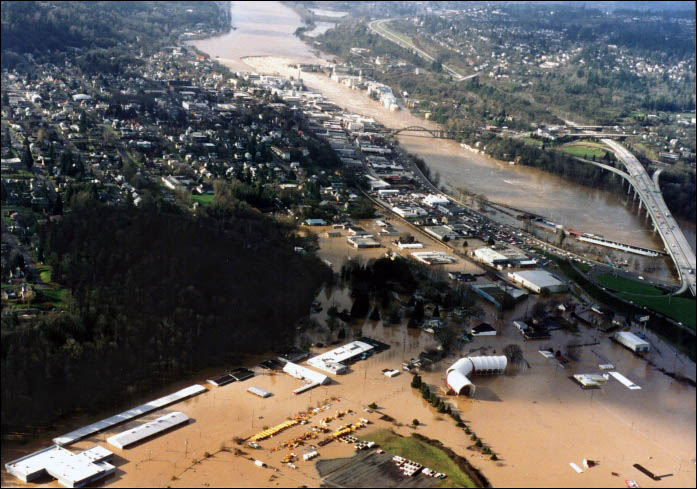
| Willamette River flooding Oregon City, Oregon, photos courtesy Lew Scholl | Tualatin River flooding Tualatin Commons area near Portland,Oregon, photos courtesy Lew Scholl |
Learn More:
Record Stages:
Imnaha River at Imnaha - Maximum discharge, 20,200 feet3/s Jan. 1, 1997, gage height, 11.44 feet
 |
 |
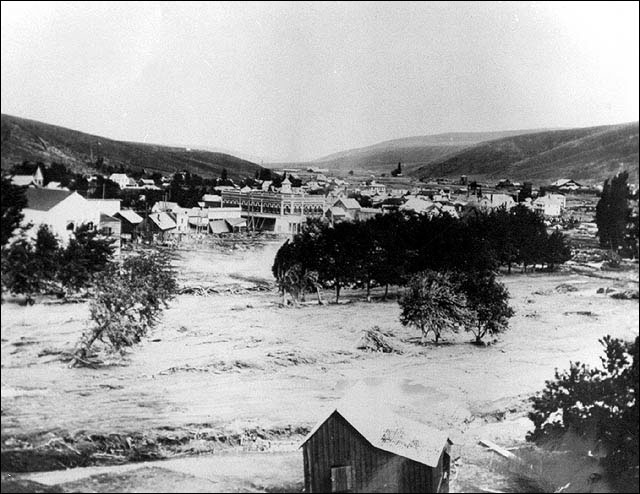
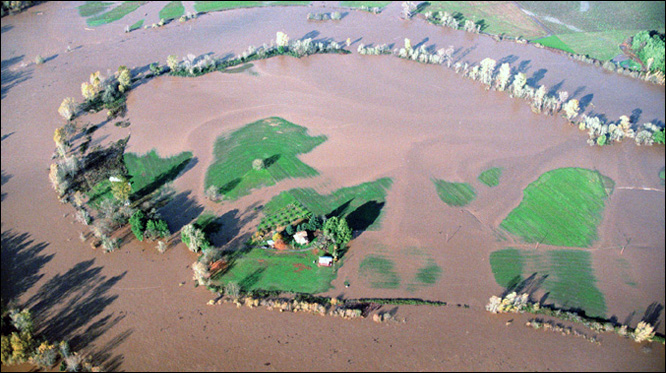
| Flood damage in central Ashland from Ashland Creek, courtesy Roger Christianson |
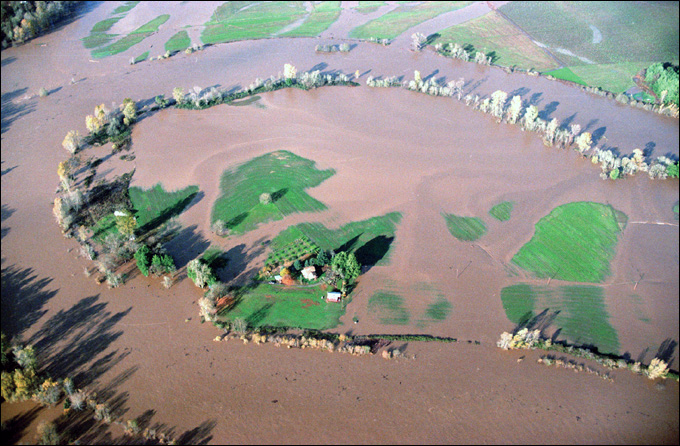
Flooding along lower Umpqua River, southwest Oregon, Jerry Redfern, Roseburg, Oregon, News Review |
Learn More:
|
||||||