Overview
|
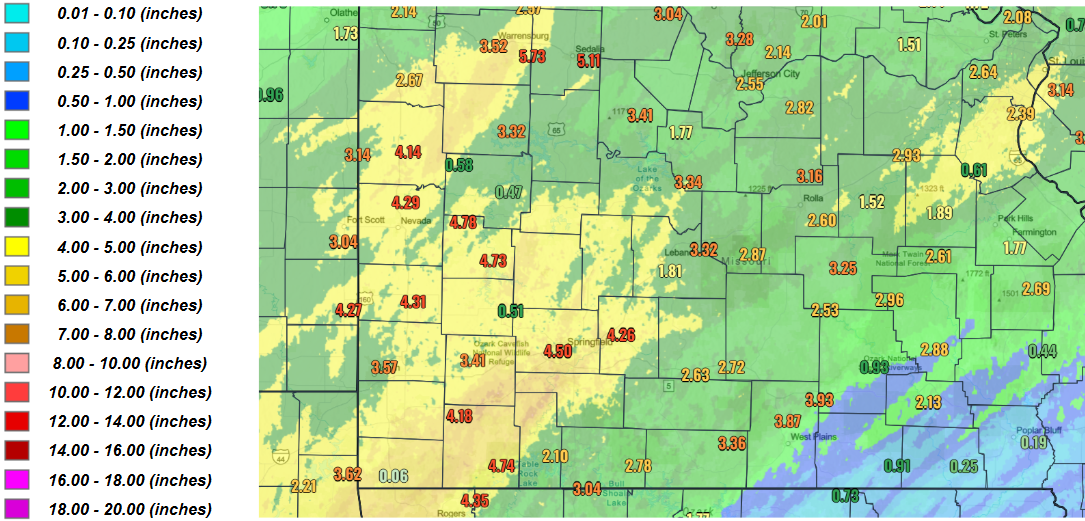
A strong storm system moved through the area on Sunday April 20th, 2025. This system brought tornadoes, damaging wind, large hail and heavy rain. The heavy rainfall led to flooding as the area had already received heavy rainfall from Friday night into Saturday night. |
Tornadoes
Select a tornado from the table to zoom into the track and view more information. The default table view is limited to 8 tracks, but can be scrolled by a mouse wheel or dynamically expanded. Additionally, the table can fill the entire window by clicking the small circular expanding arrow icon at the very top right of the table and returned to its original size by clicking the button again. The side information panel that opens over the map can be closed using the "X" on the upper right corner of the pop-up. Zoom into the map and click damage points to see detailed information and pictures from the surveys.
|
NOTE: times shown below are local to your device's time zone. |

The Enhanced Fujita (EF) Scale classifies tornadoes into the following categories:
| EF0 Weak 65-85 mph |
EF1 Moderate 86-110 mph |
EF2 Significant 111-135 mph |
EF3 Severe 136-165 mph |
EF4 Extreme 166-200 mph |
EF5 Catastrophic 200+ mph |
 |
|||||
| Tornadoes that fail to impact any ratable structures on the EF-Scale are rated EF-Unknown (EF-U) | |||||
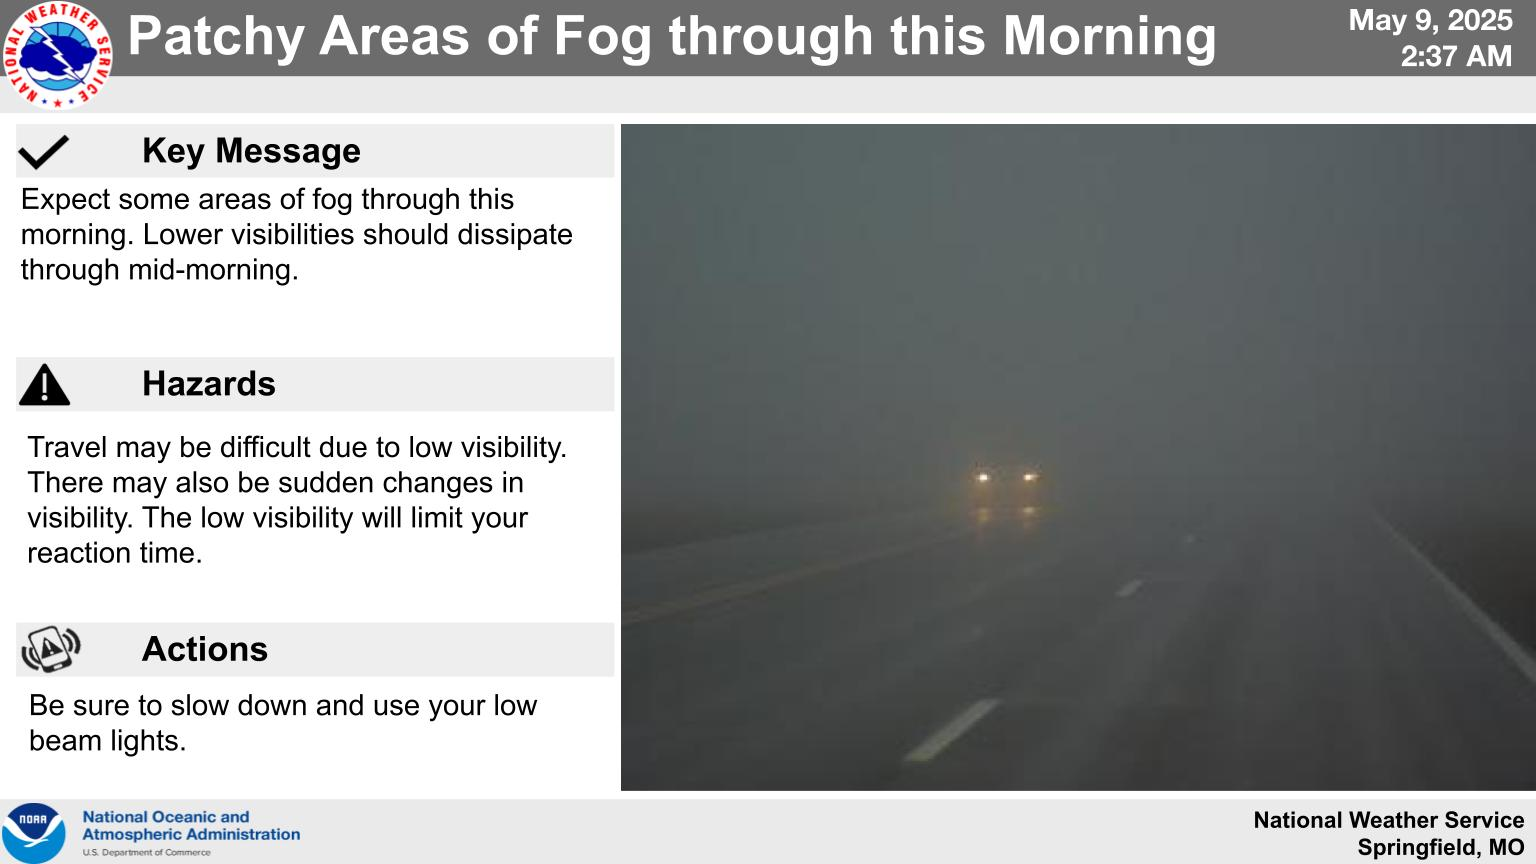
Flooding
Add a written summary if needed.
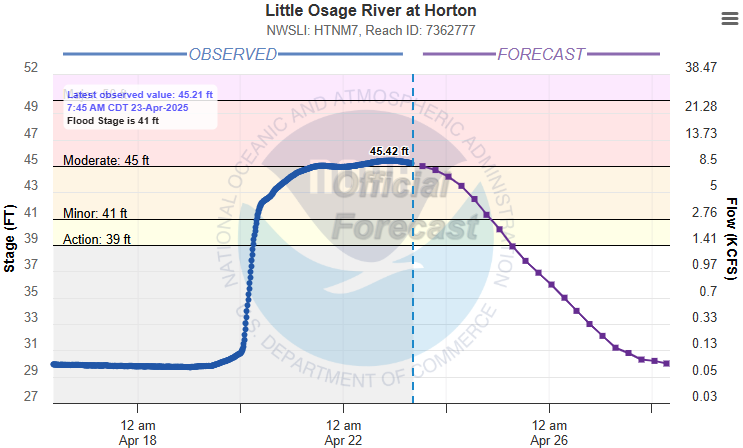
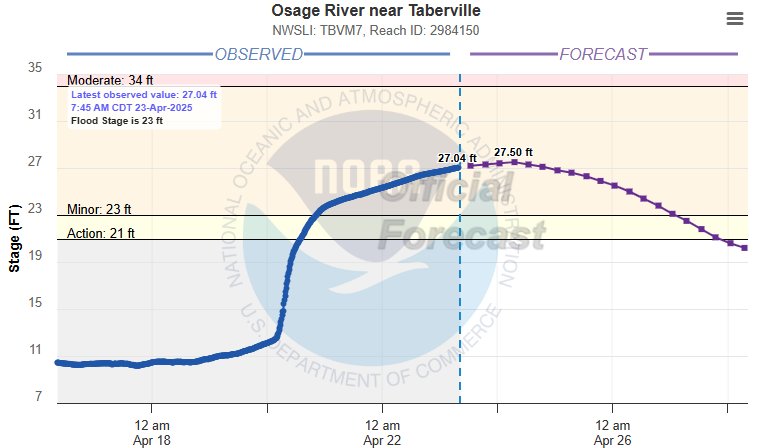
Hydrographs
 |
 |
 |
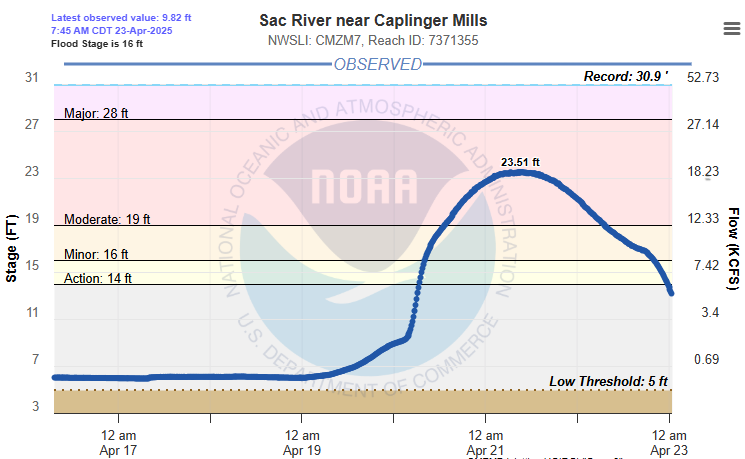 |
| Little Osage River at Horton | Marmaton River near Nevada | Osage River near Taberville | Sac River near Caplinger Mills |
Radar
Storm Reports
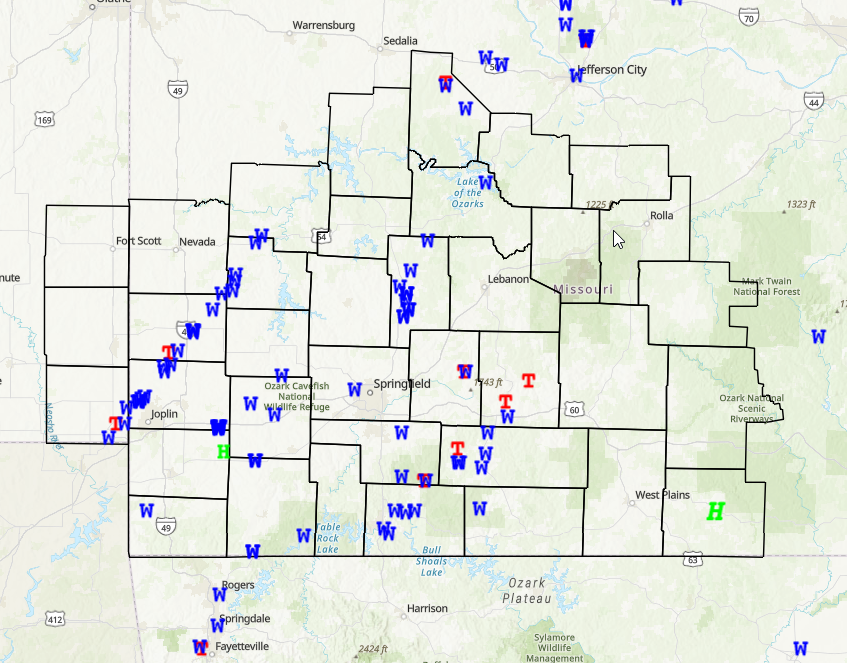
Red T - Tornadoes
Blue W - Wind Damage or Severe Wind Gusts
Green H - Large Hail
 |
Media use of NWS Web News Stories is encouraged! Please acknowledge the NWS as the source of any news information accessed from this site. |
|


 Weather Story
 Weather Map
 Local Radar