13 October 2012 Willard, MO Tornado
A diffluent southwesterly flow aloft was present across the Missouri Ozarks during the evening of 13 October 2012. A 500 hPa closed low was centered across western Kansas (Figure 1) with a 300 hPa jet core extending from the southern Texas Panhandle, northeast into the western Great Lakes (Figure 2). The 00 UTC surface analysis (Figure 3) depicted surface low pressure centered across north-central Kansas with a cold front trailing the low through central Oklahoma.
 |
 |
 |
| Fig. 1 500 hPa plot valid on 14 October 2012 at 0000 UTC. Plot courtesy of the Storm Prediction Center (SPC). | Fig. 2 300 hPa plot valid on 14 October 2012 at 0000 UTC. Plot courtesy of SPC. | Fig. 3 Surface plot valid on 14 October 2012 at 0000 UTC. Plot courtesy of the Hydrometeorological Prediction Center (HPC). |
Temperatures ahead of the cold front were in the lower to middle 70s with surface dew points in the middle 60s. The atmosphere across southwestern Missouri was modestly unstable with MLCAPE values from the SPC Mesoscale Analysis Page (SMAP) in the 250-500 J/kg range (Figure 4). MUCAPE values from SMAP were on the order of 1000 J/kg (Figure 5). The 00 UTC KSGF RAOB (Figure 6) indicated that the most unstable air parcel was rooted near 800 hPa. Also of note in Figures 5 and 6 are that 50-75 J/kg of convective inhibition was present early that evening.
 |
 |
 |
| Fig. 4 MLCAPE and MLCIN plot valid on 14 October 2012 at 0000 UTC. Units are in J/kg. Images courtesy of SMAP. | Fig. 5 MUCAPE (J/kg) and lifted parcel level plot (m) valid on 14 October 2012 at 0000 UTC. Images courtesy of SMAP. |
Fig. 6 KSGF RAOB valid on 14 October 2012 at 0000 UTC. Image courtesy of SPC. |
Thunderstorms initially developed across western and central Oklahoma during the afternoon of the 13th. These storms grew upscale into a Quasi-Linear Convective System (QLCS) as cold pools conglomerated across central and eastern Oklahoma (Figures 7 and 8). These storms reached the Kansas/Missouri state line around 00 UTC (Figure 9).
 |
 |
 |
| Fig. 7 Regional radar image valid on 13 October 2012 at 2200 UTC. Images courtesy of SMAP. | Fig. 8 Regional radar image valid on 13 October 2012 at 2300 UTC. Images courtesy of SMAP. |
Fig. 9 Regional radar image valid on 14 October 2012 at 0000 UTC. Images courtesy of SMAP. |
The orientation and magnitude of 0-3 km bulk shear was favorable for mesovortex potential that evening. Ambient bulk shear vectors in the 0-3 km layer ahead of the QLCS were orientated towards the northeast at 35 to 40 knots (Figure 10). Thus, any line segments moving towards the east or northeast would realize line-normal bulk shear magnitudes at or above 30 knots.
 |
| Fig. 10 0-3 km bulk shear vectors valid on 14 October 2012 at 0000 UTC. Images courtesy of SMAP. |
As these storms continued to progress northeast through southwestern Missouri, several small line segments became apparent on radar. One line segment moved into western Lawrence County right around 0100 UTC. Comparison of the storm relative motion (SRM) image to the reflectivity (Z) image in Figure 11 indicates that three different shear/cold pool balance regimes were contained within this line segment.
 |
 |
| Fig. 11a Raw KSGF storm relative motion image valid on 14 October 2012 at 0103 UTC. RAP40 0-3km bulk shear vectors overlaid in black. | Fig. 11b Raw KSGF reflectivity image valid on 14 October 2012 at 0103 UTC. RAP40 0-3km bulk shear vectors overlaid in black. |
 |
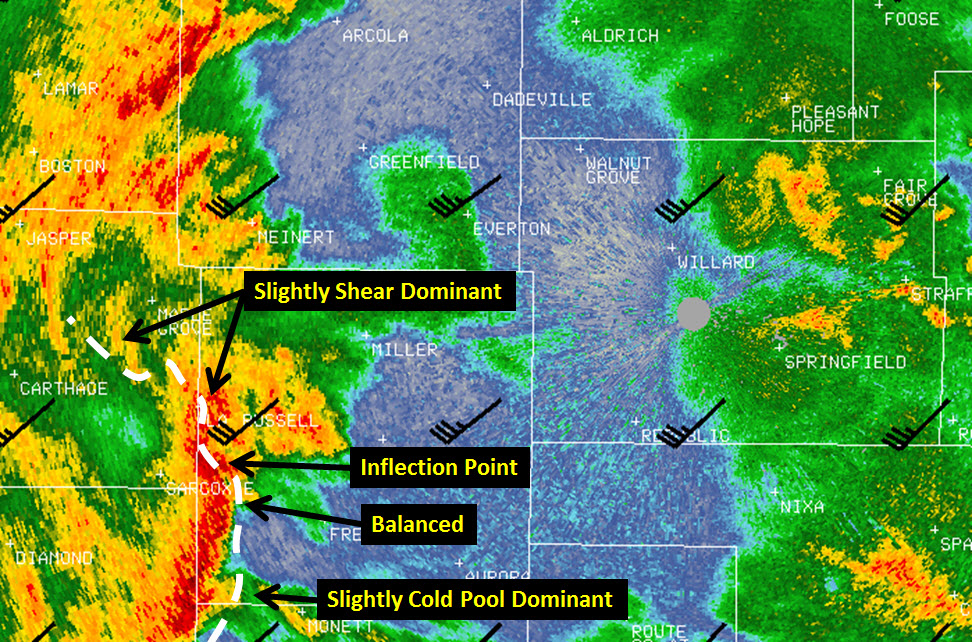 |
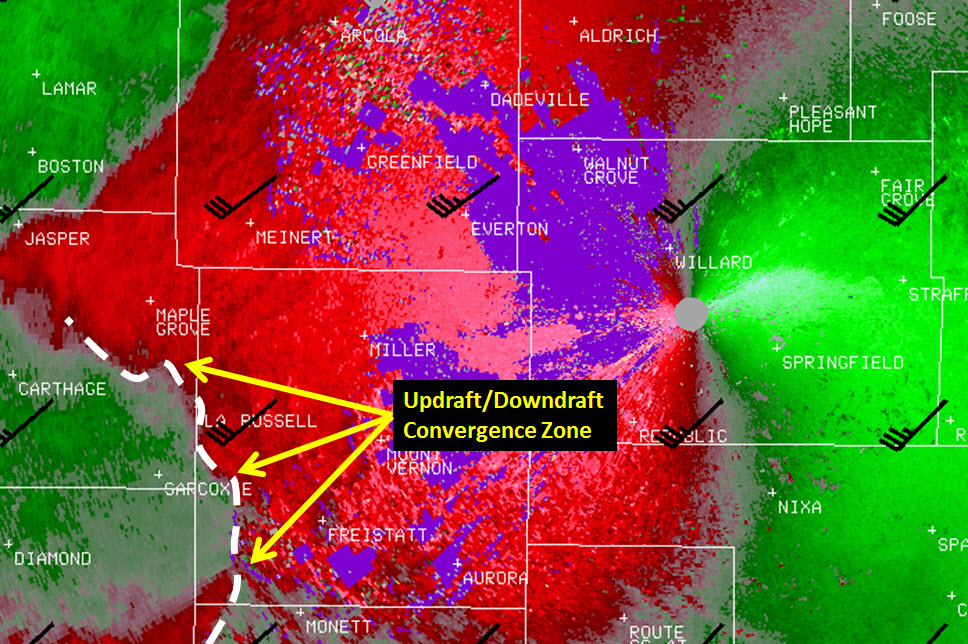
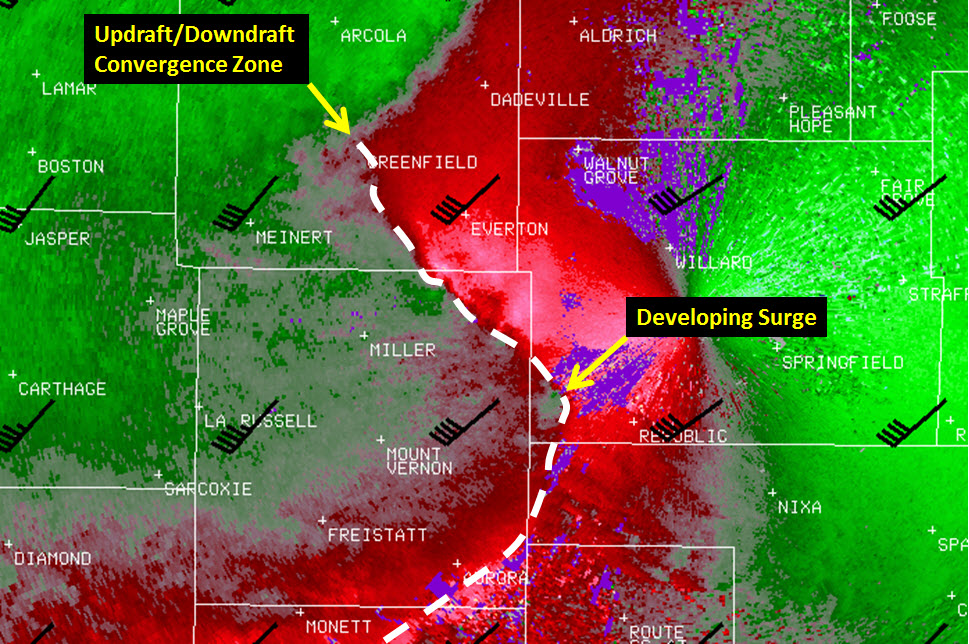
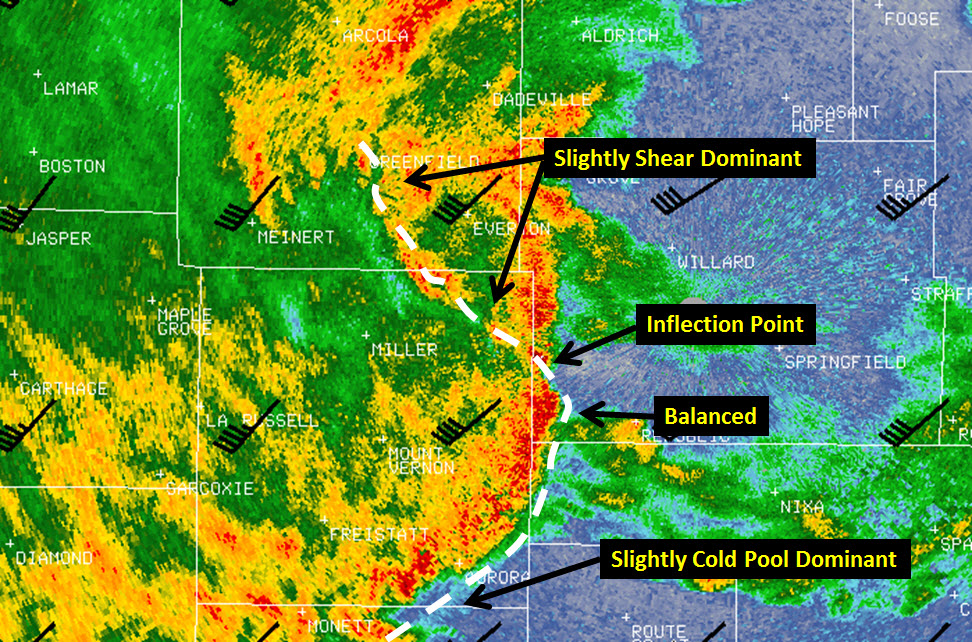
| Fig. 11c Modified KSGF storm relative motion image valid on 14 October 2012 at 0103 UTC. RAP40 0-3km bulk shear vectors overlaid in black. The dashed white line indicates the location of the updraft/downdraft convergence zone. | Fig. 11d Modified KSGF reflectivity image valid on 14 October 2012 at 0103 UTC. RAP40 0-3km bulk shear vectors overlaid in black. The dashed white line indicates the location of the updraft/downdraft convergence zone. Differing shear/cold pool regimes are identified along with the inflection point. |
The easiest way to visualize shear/cold pool balance regimes is to compare the low-level updraft/downdraft convergence zone (UDCZ) in the SRM product to the reflectivity image. Notice in the SRM product that outbound velocities (red colors) quickly transition to gray from just south of Maple Grove to east of Sarcoxie. That transition gradient is the location of the UDCZ. Comparison of the UDCZ to the reflectivity image then reveals the differing shear/cold pool balance regimes. The UDCZ to the west of Monett is out ahead of the main convective updrafts and is representative of a slightly cold pool dominant regime. In contrast, the UDCZ just east of Sarcoxie is located right along the leading edge of the heavier precipitation. This is representative of balance between the system cold pool and environmental shear. Further north, the UDCZ curls back into the precipitation up towards La Russell. This UDCZ placement is indicative of a slightly-shear dominant regime. Interestingly, we have found that the transition area from a balanced to a slightly shear dominant regime (inflection point) can be a favored location for mesovortex genesis.
One other item to point out in Figure 11 is the orientation and magnitude of the 0-3 km bulk shear vectors. Again, these vectors are orientated to the northeast at around 35 knots. One important caveat about selecting which vectors to use is that they must be representative of the ambient atmosphere (ahead of the line). Vectors in the area of convection will likely be contaminated. In this particular case, vectors around Pleasant Hope and Springfield were good selections.
As you can see in Figure 11, these vectors were nearly perpendicular to this line segment from just east of Sarcoxie, north towards Maple Grove. Thus, the line-normal component of 0-3 km bulk shear was also right around 35 knots. Further to the south, the line segment was orientated more parallel to the 0-3 km bulk shear vectors. This resulted in poor line-normal values of 0-3 km bulk shear to the west of Monett.
At this point, we have established that two of the three ingredients are present for mesovortex genesis and rapid intensification along this line segment for just east of Sarcoxie, north towards Maple Grove:
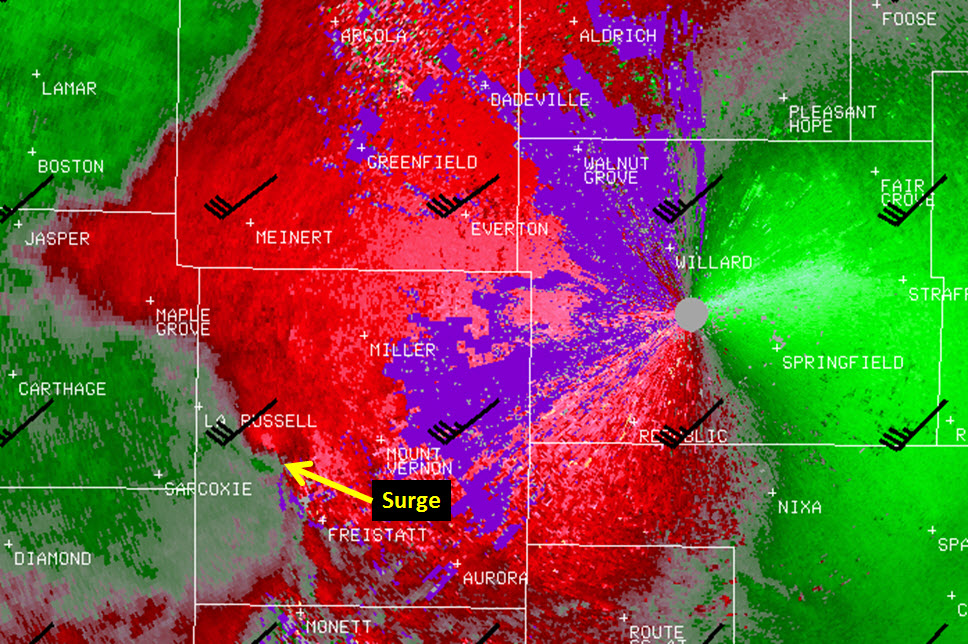
Moving ahead to the next radar volume scan (Figure 12), you can see that a localized surge has developed in this line segment directly to the west of Mount Vernon. This surge is most noticeable in the SRM product where the UDCZ has taken on a definite concave appearance.
 |
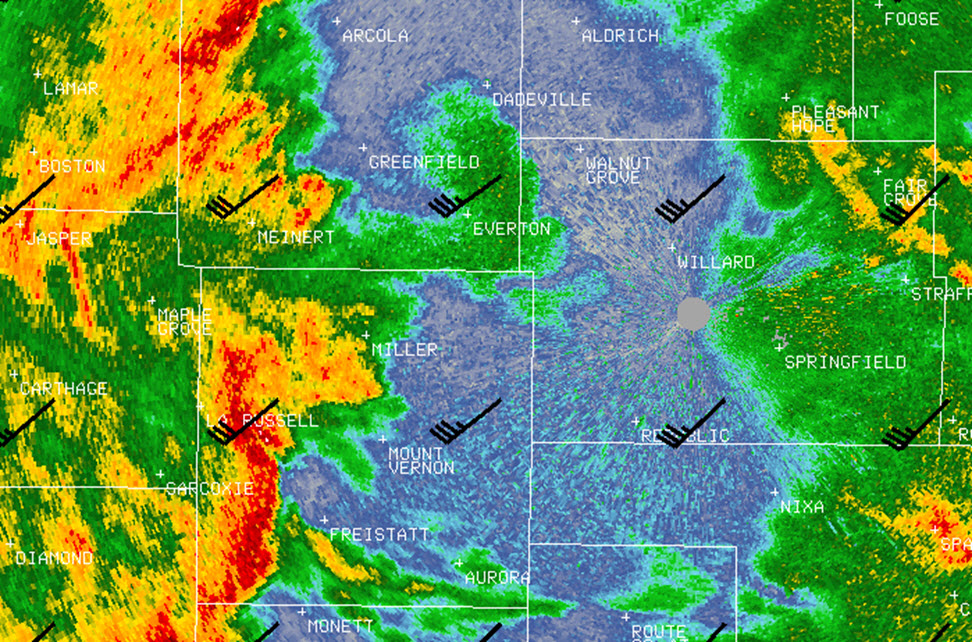 |
| Fig. 12a KSGF storm relative motion image valid on 14 October 2012 at 0108 UTC. RAP40 0-3km bulk shear vectors overlaid in black. | Fig. 12b KSGF reflectivity image valid on 14 October 2012 at 0108 UTC. RAP40 0-3km bulk shear vectors overlaid in black. |
The presence of this surge meant that the third and final ingredient for mesovortex genesis and rapid intensification was being met:
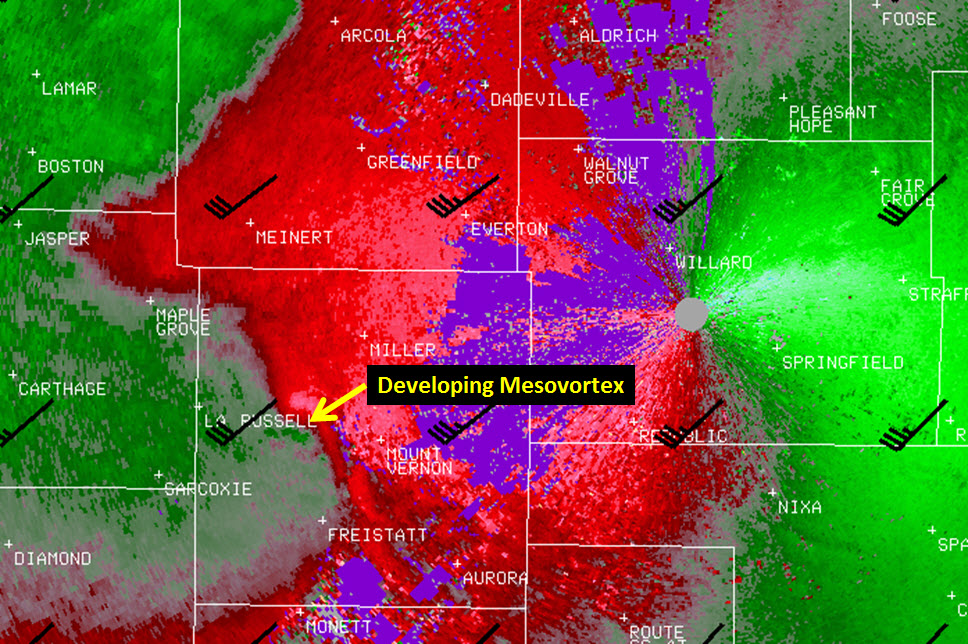
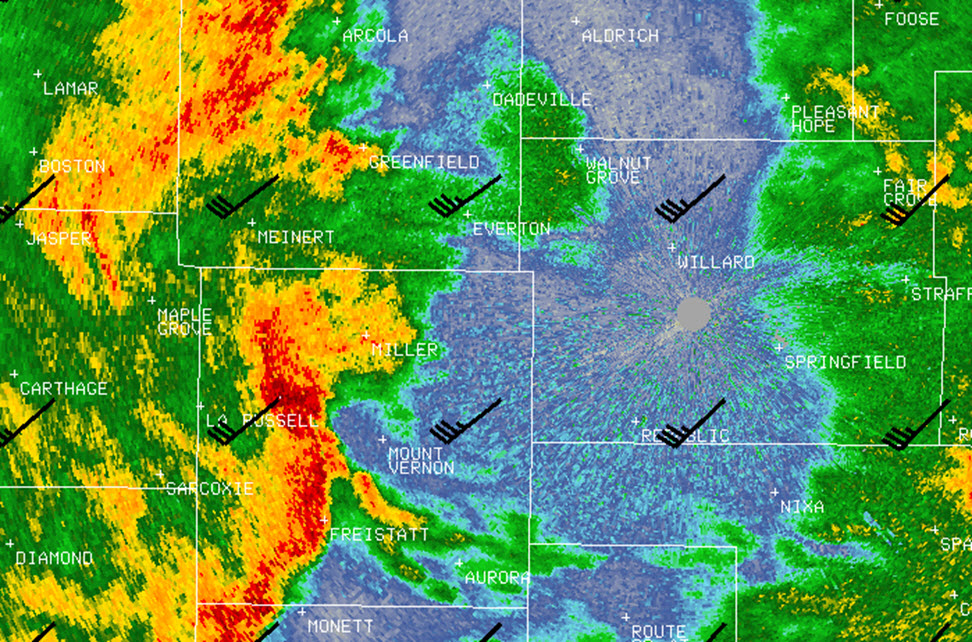
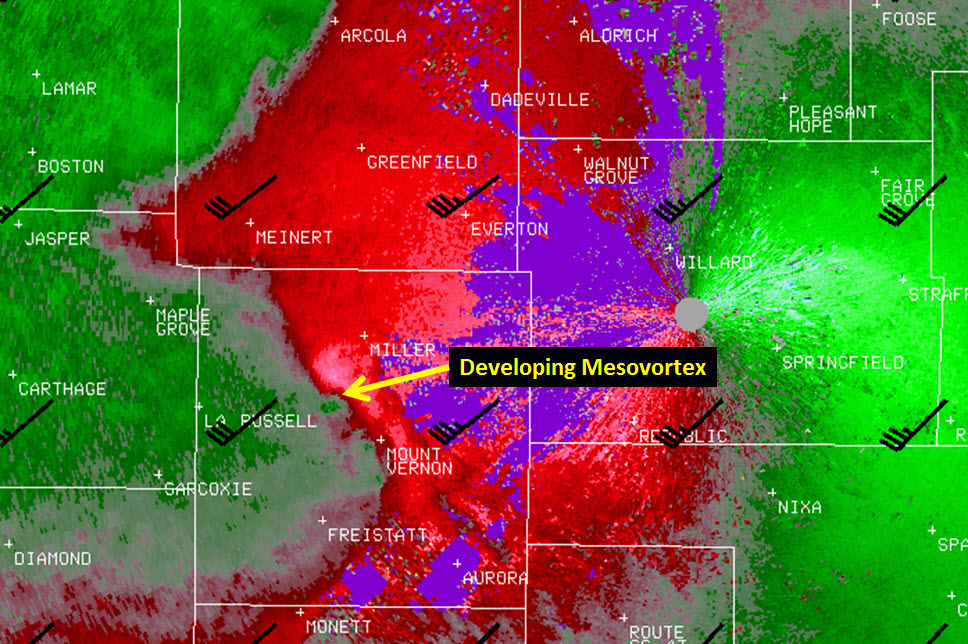
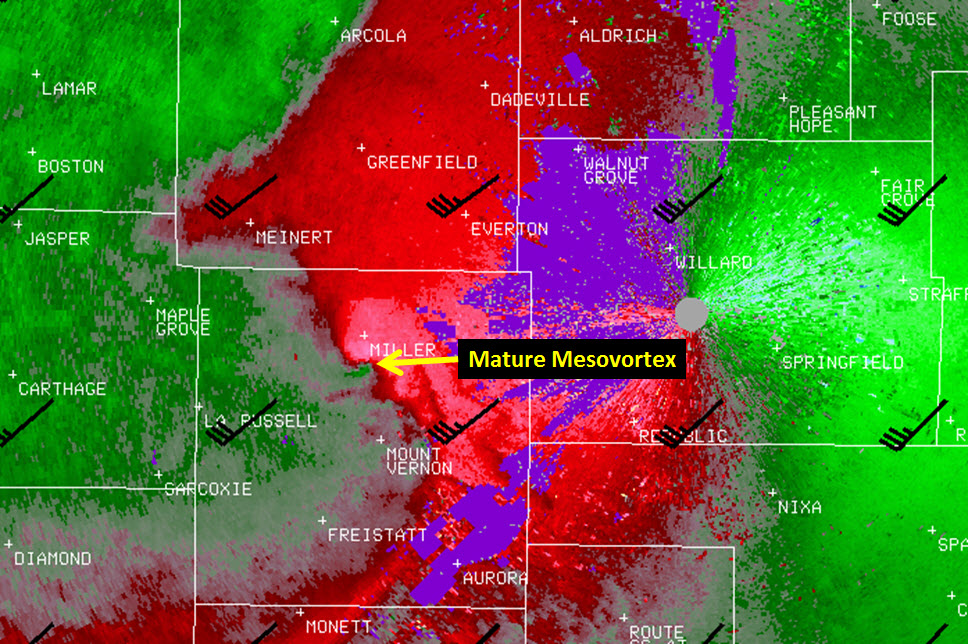
In subsequent radar volume scans, a mesovortex does indeed develop immediately north of the surge apex (Figure 13). The mesovortex reaches peak strength just to the south of Miller. This mesovortex did produce wind damage between Miller and Mount Vernon.
 |
 |
 |
 |
 |
 |
| Fig. 13a KSGF storm relative motion sequence valid on 14 October 2012 from 0112 to 0121 UTC. RAP40 0-3km bulk shear vectors overlaid in black. | Fig. 13b KSGF reflectivity sequence valid on 14 October 2012 from 0112 to 0121 UTC. RAP40 0-3km bulk shear vectors overlaid in black. |
Interestingly, this mesovortex formed in the previously mentioned "inflection point" region where the shear/cold pool balance regime transitioned from balanced to slightly shear dominant. Additionally, this mesovortex quickly propagated north along the UDCZ into the slightly shear dominant region of the line segment. This is a rather common occurrence with mesovortices.
Several more sequences of surge and subsequent mesovortex development then took place as this line segment moved through eastern Lawrence County and into western Greene County. Interrogation of the line segment across western Greene County (Figure 14) indicated that the balanced portion of the segment was located just west of Republic, with a slightly shear dominant regime present across the remainder of western Greene County.
Also of note in Figure 14 is a surge beginning to develop just to the west of Republic. As was the case multiple times with this line segment, all three ingredients for mesovortex genesis and rapid intensification were being met. By this time, the strength of the 0-3 km bulk shear vectors had actually increased to around 40 knots immediately ahead of the line.
 |
 |
| Fig. 14a KSGF storm relative motion image valid on 14 October 2012 at 0135 UTC. RAP40 0-3km bulk shear vectors overlaid in black. The dashed white line indicates the location of the updraft/downdraft convergence zone. | Fig. 14b KSGF reflectivity image valid on 14 October 2012 at 0135 UTC. RAP40 0-3km bulk shear vectors overlaid in black. The dashed white line indicates the location of the updraft/downdraft convergence zone. Differing shear/cold pool regimes are identified along with the inflection point. |
In the following three radar volume scans (Figure 15), the surge intensifies with a mesovortex taking shape to the north of the surge apex.
 |
 |
 |
 |
 |
 |
| Fig. 15a KSGF storm relative motion sequence valid on 14 October 2012 from 0140 to 0149 UTC. RAP40 0-3km bulk shear vectors overlaid in black. | Fig. 15b KSGF reflectivity sequence valid on 14 October 2012 from around 0140 to 0149 UTC. RAP40 0-3km bulk shear vectors overlaid in black. |
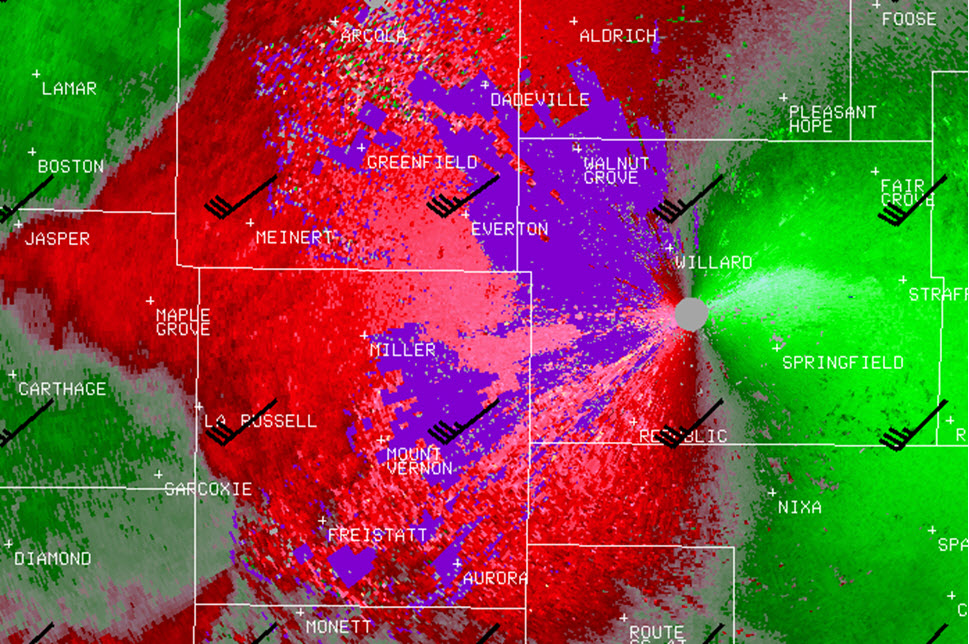
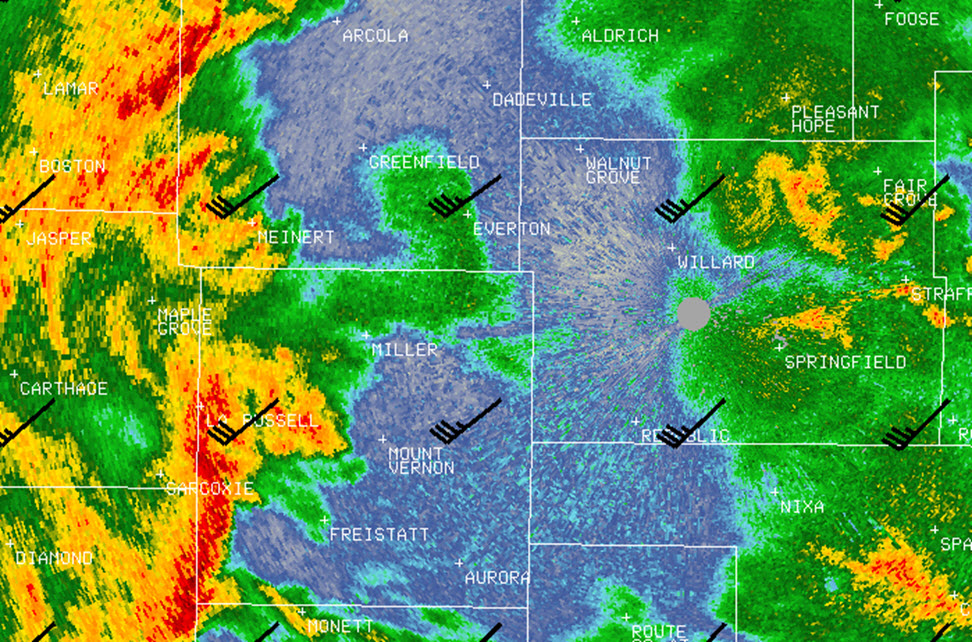
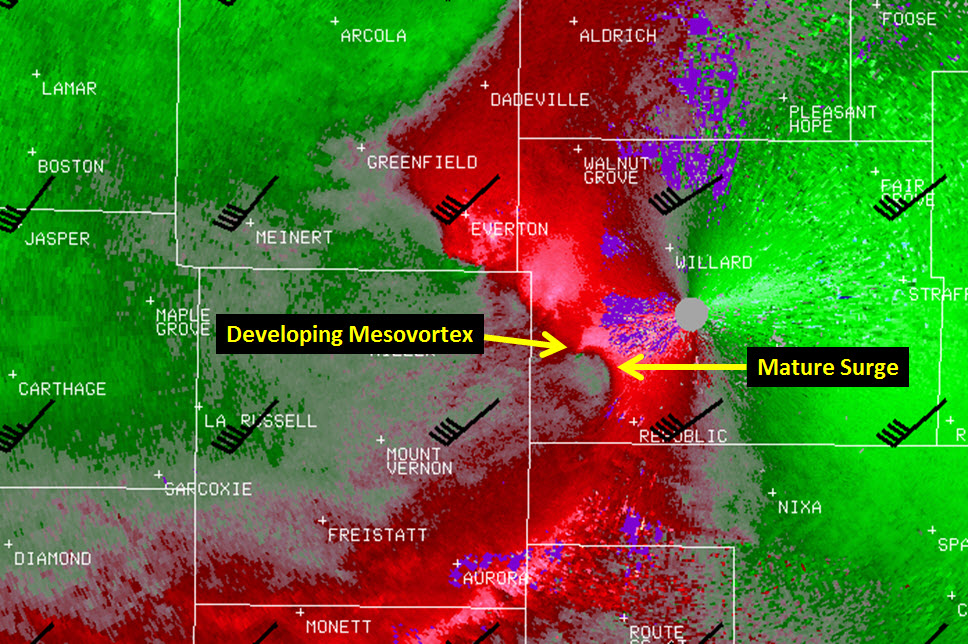
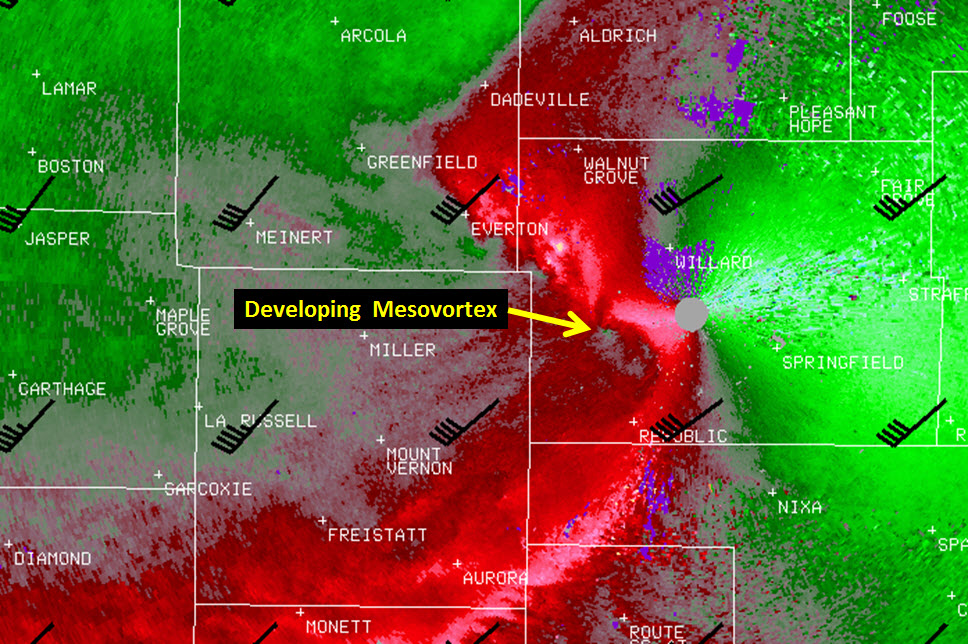
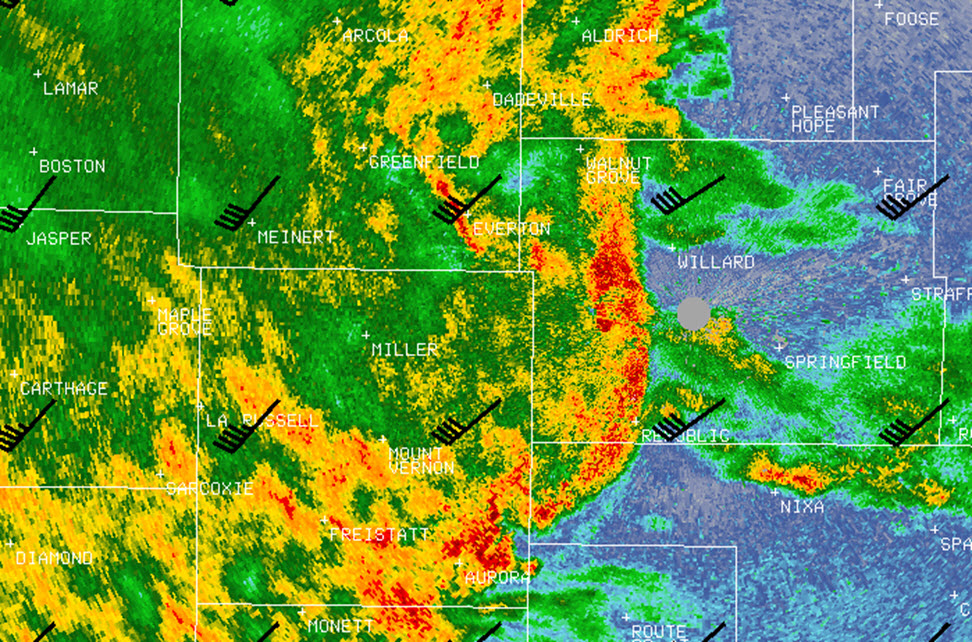
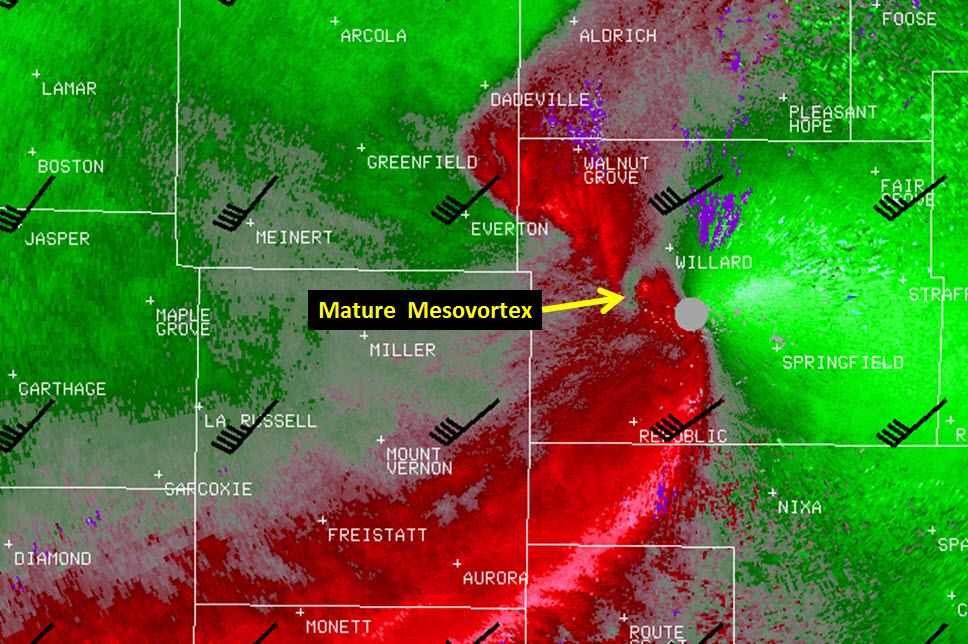
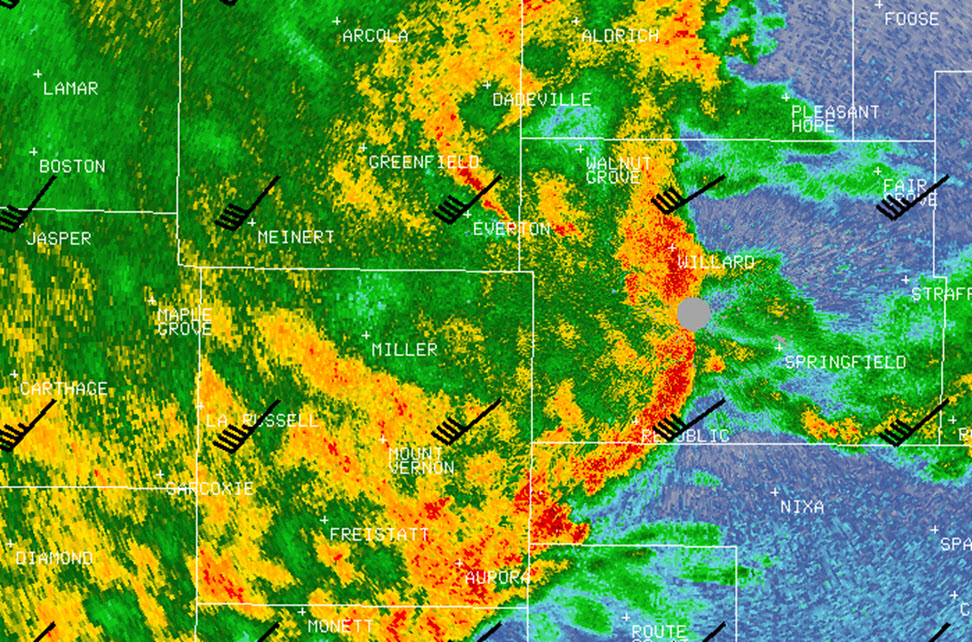
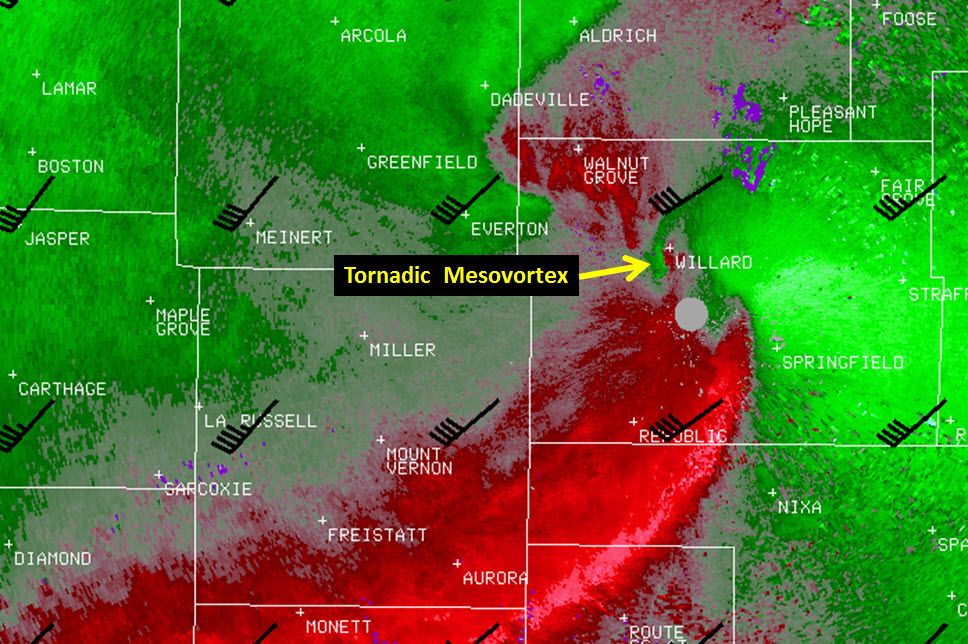
The following radar volume scan (Figure 16) then showed a mature mesovortex impinging on the southwest side of Willard. It was at this point that the mesovortex spawned a tornado which tracked for around a half mile. As was the case with the mesovortex across eastern Lawrence County, this mesovortex and attendant tornado migrated north along the UDCZ into the slightly shear dominant region of the line segment. Comparing the location of the mesovortex in the storm relative motion image to the reflectivity image, the mesovortex and associated tornado are clearly embedded within an area of heavy precipitation. The rain-wrapped nature of tornadoes within the slightly shear dominant portion of line segments makes them nearly impossible to see.
 |
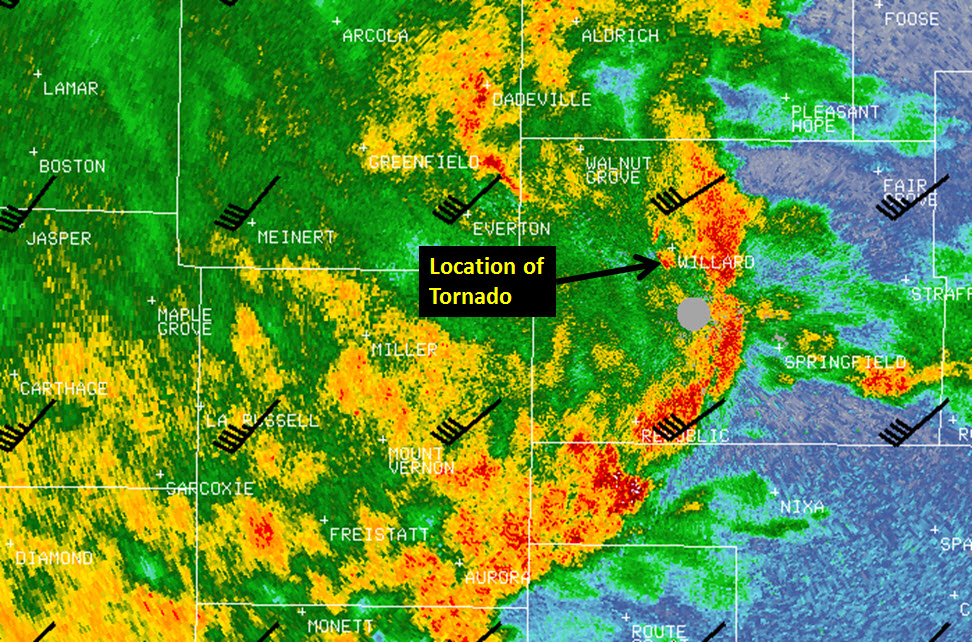 |
| Fig. 16a KSGF storm relative motion image valid on 14 October 2012 at 0154 UTC. RAP40 0-3km bulk shear vectors overlaid in black. | Fig. 16b KSGF reflectivity image valid on 14 October 2012 at 0154 UTC. RAP40 0-3km bulk shear vectors overlaid in black. |
For an animation of radar reflectivities and storm relative motions from Lawrence County through the time of the Willard tornado, you can click on the following links. Please note that each of these animations are 2-3 mb in size!
While we presented two surges and resulting mesovortices in this case study, close examination of the radar animations reveals that several other surges and mesovortices were present that evening.
For a summary of this severe weather event including the Willard tornado track and storm survey information, please click on this link.


 Weather Story
 Weather Map
 Local Radar