The NOAA National Environmental Satellite, Data, and Information Service (NESDIS) provides geostationary and low-earth-orbiting satellite imagery and data that are widely used by both government and private stakeholders. A key use of this data is to avoid hazards during travel such as severe weather, ice, wind, fires, smoke, hurricanes and more. In this article we are going to focus on imagery access for quick use in situational awareness to stay safe while out on the water.
GOES Image Viewer:
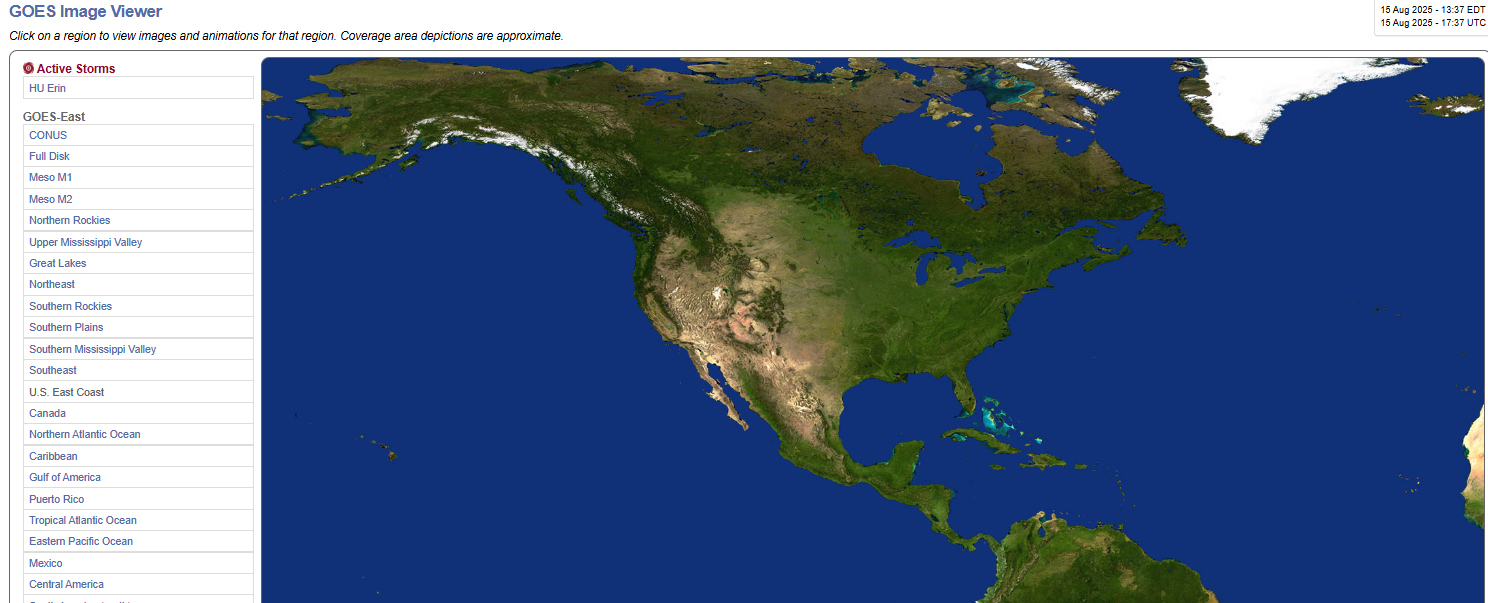 |
| The landing page of the GOES Image Viewer |
URL: https://www.star.nesdis.noaa.gov/goes/index.php
The GOES Image Viewer is a powerful tool to quickly access a wide variety of still images and animated loops from the GOES-R series geostationary satellites. This viewer page includes links to low-bandwidth imagery for weak or slow internet connections while away from land.
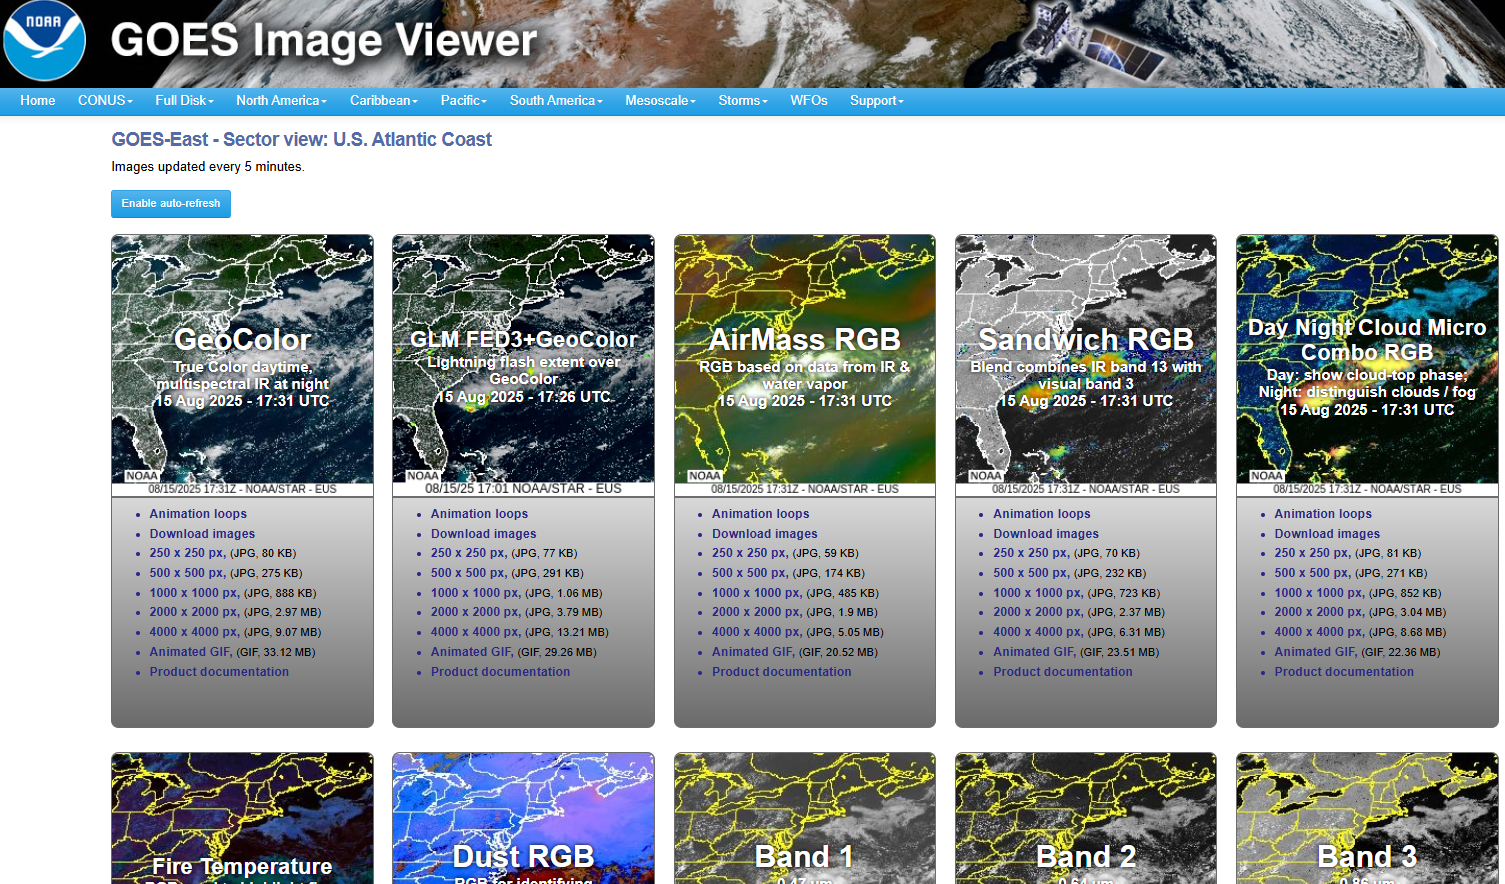
There are numerous geographical sectors to choose from. Roll your mouse over various areas of the map or the list on the left menu to see the geographical coverage areas highlighted on the map. Click on the region of interest, and it will take you to a page similar to the image below, with numerous choices of still and animated imagery products. A good choice for severe weather avoidance is the “GLM FED3 + GeoColor” combined product.
 |
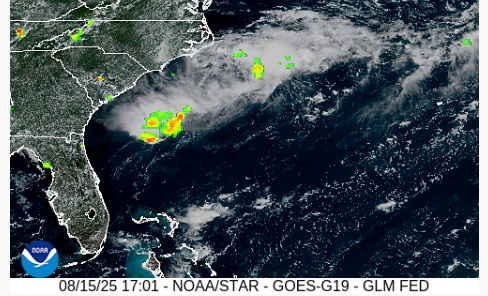 |
| Submenus of various GOES-R satellite imagery products with choices for different file sizes | GLM FED3 + GeoColor Image, showing visible cloud cover and color coded lightning density |
CIRA Slider:
The CIRA slider is a web-based application where the user can select different geostationary or low earth orbit satellites, image products, overlays, and timeframes to create and zoom into animations or still images.
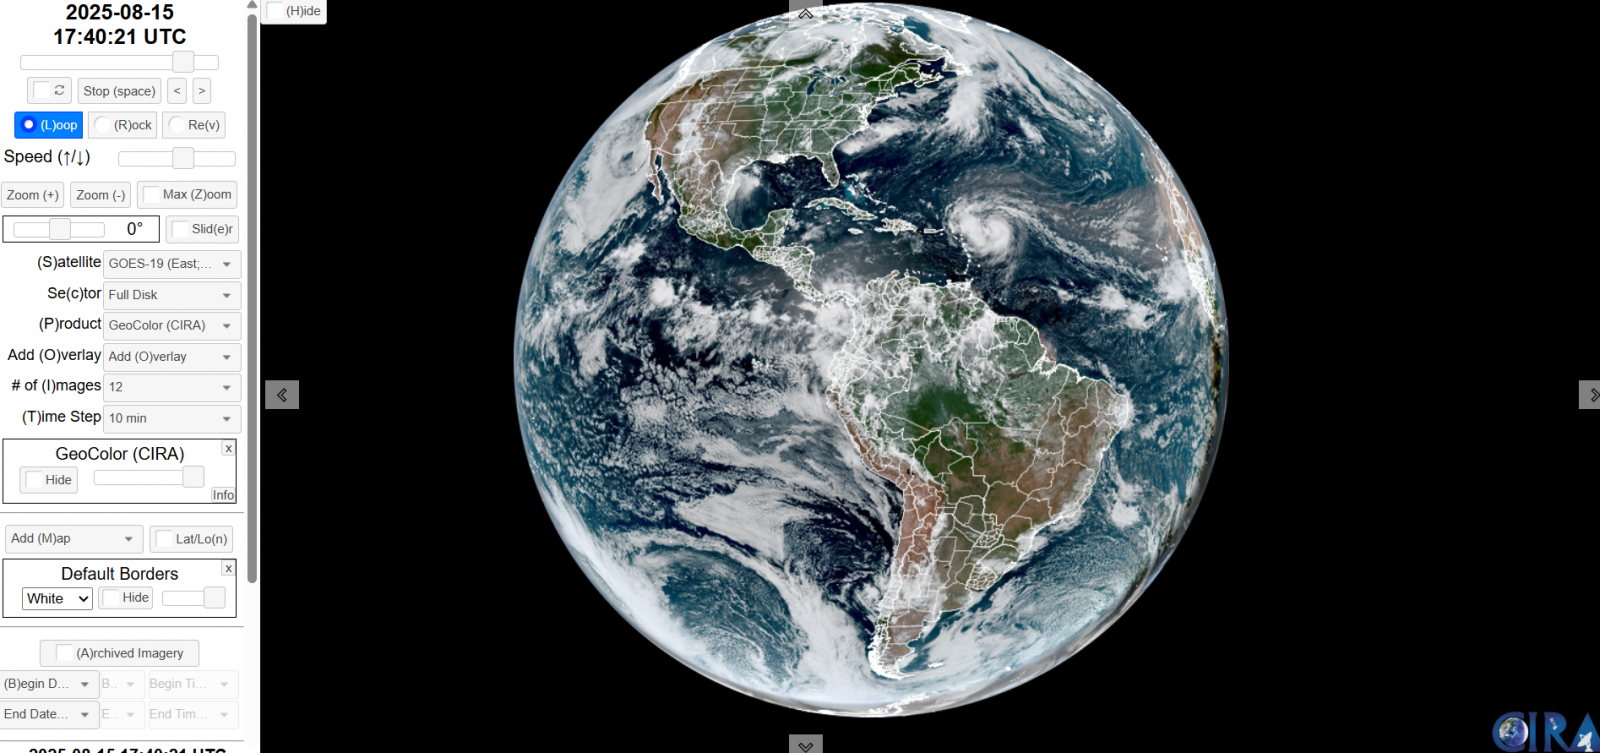 |
| The CIRA Slider Application |
URL: https://rammb-slider.cira.colostate.edu
For example, if a user wanted to see what type of weather was approaching them near the Texas gulf coast, they could zoom in to that area of interest. From there they can select whichever imagery, with any overlays, they wish using the “(P)roduct” and “Add (O)verlay” drop-downs in the left menu. The image below shows the GeoColor product and Group Energy Density overlay.
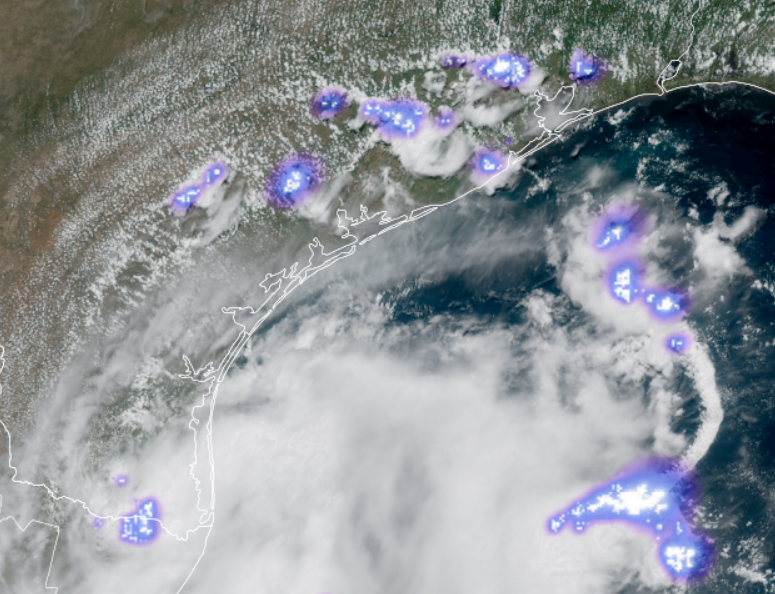 |
| Visible image along the Texas gulf coast showing white hues (clouds) and blue/white pixels (lightning flash density) |
For those interested in learning more about accessing GOES-R imagery, reference the Beginner’s Guide to GOES-R Series Data.

