Please help the NWS spread these messages on social media! Everyone is welcome to use the text and images provided below to help the NWS build a Weather-Ready Nation.
Facebook
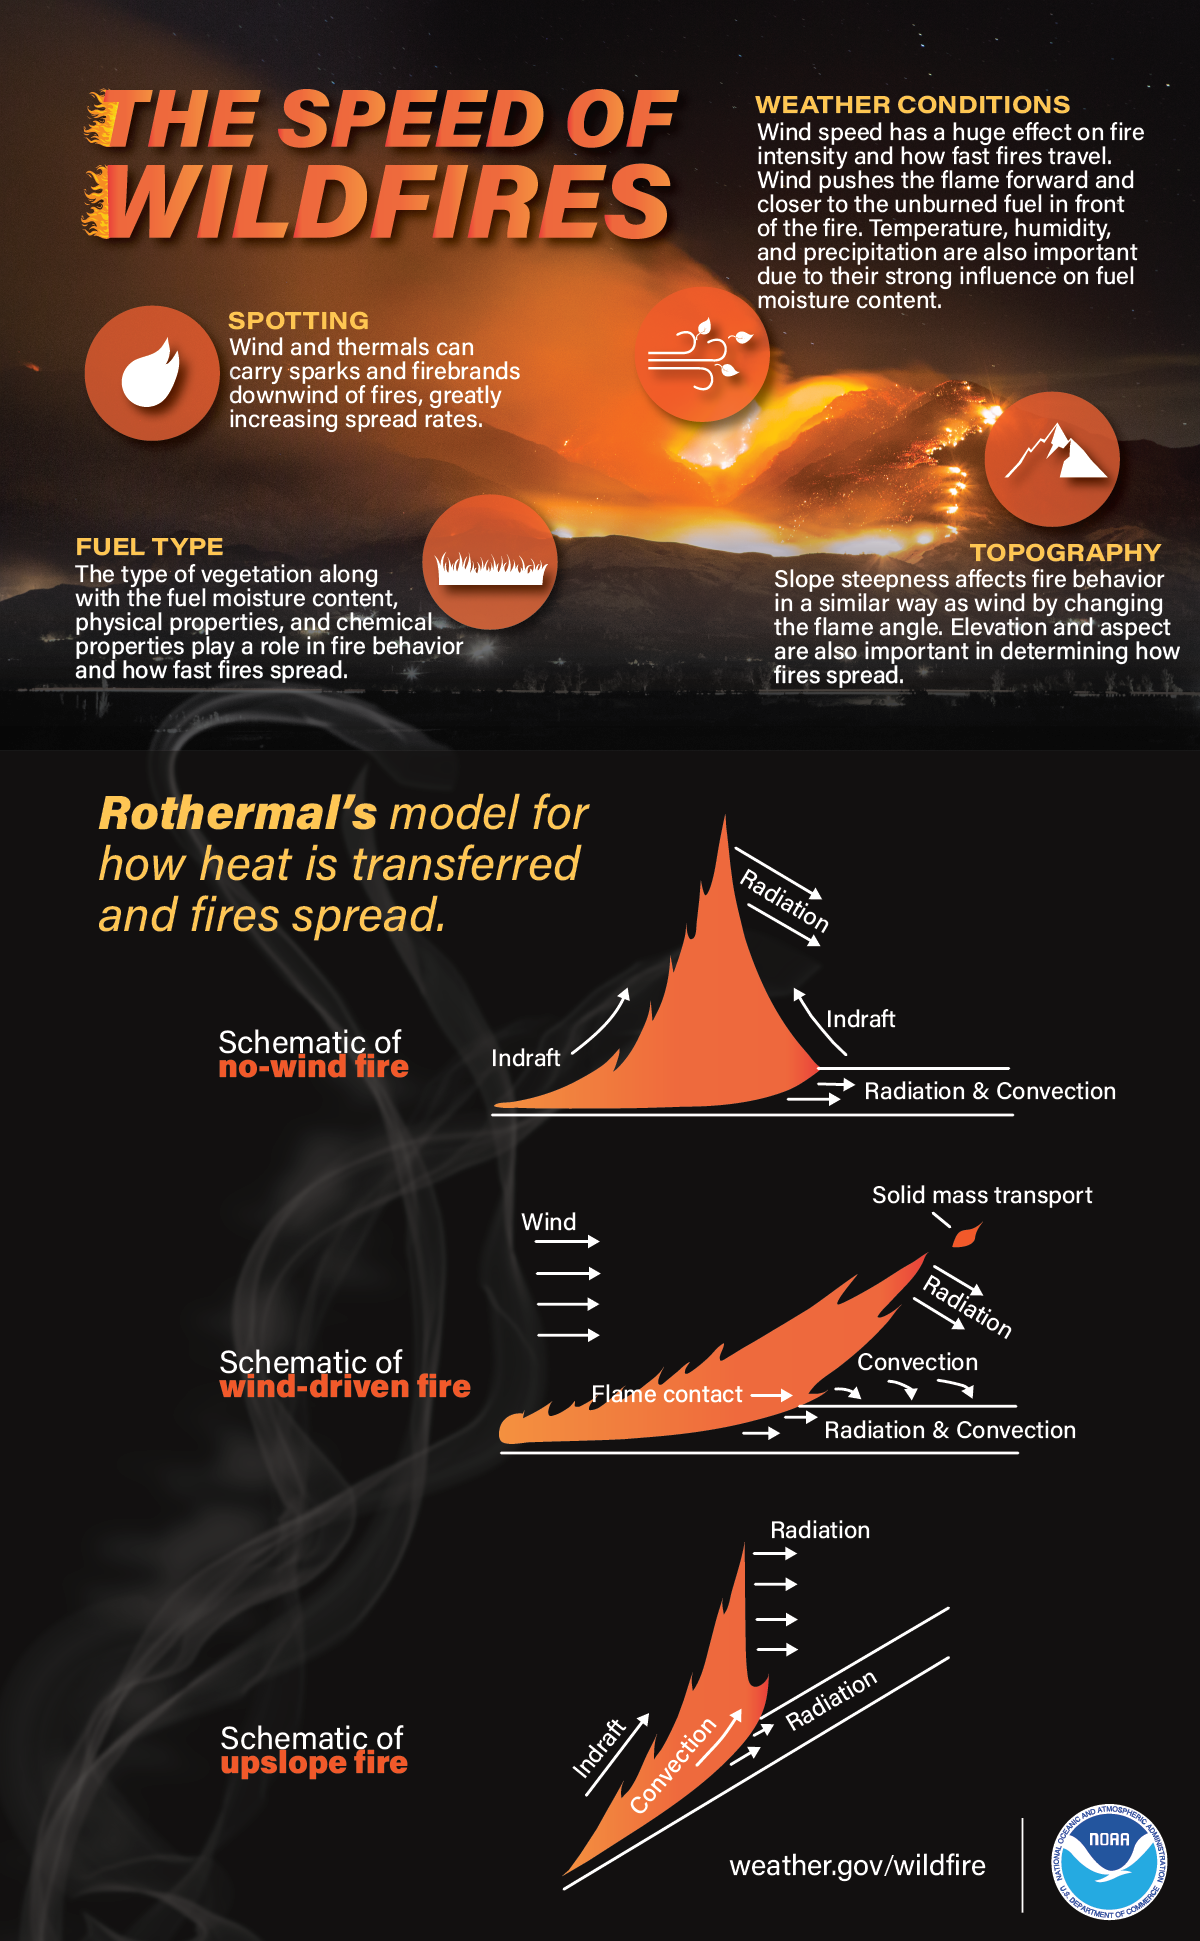
There are a lot of factors that determine the speed of wildfires. Check out the infographic below to learn a little #WildfireScience, and visit weather.gov/safety/wildfire for the latest safety tips.
Twitter
There are a lot of factors that determine the speed of wildfires. Check out the infographic below to learn a little #WildfireScience, and visit weather.gov/safety/wildfire for the latest safety tips.
|
Facebook
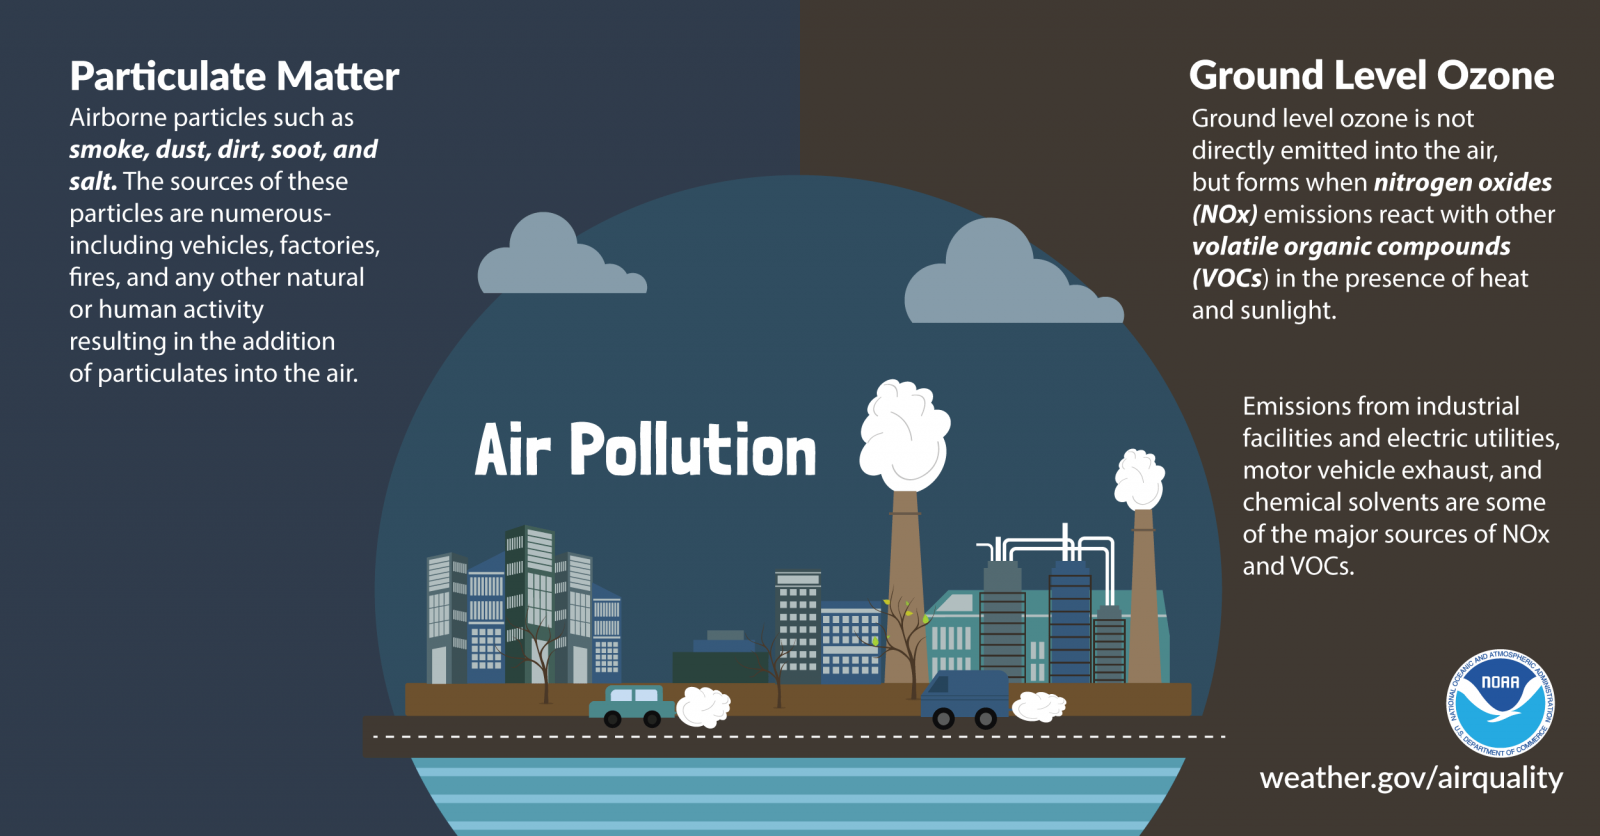
What is air pollution? The two primary culprits are: 1) Airborne particles such as smoke, dust, dirt, and soot, also called particulate matter. 2) Ground level ozone, which is formed when nitrogen oxides emissions react with other volatile organic compounds in the presence of heat and sunlight. To learn #AirQuality safety tips, visit weather.gov/safety/airquality #SummerSafety
Twitter
What is air pollution? The two primary culprits are particulate matter and ground level ozone. Check out the graphic below, and visit weather.gov/safety/airquality for #AirQuality safety tips. #SummerSafety
|
Facebook
Haboob. Funny name, dangerous weather phenomenon. Learn about them and other examples of weird weather in this short video: youtu.be/vuk6gvq7Nwk #wxscience
Twitter
Haboob. Funny name, dangerous weather phenomenon. Learn about them and other examples of weird weather in this short video: youtu.be/vuk6gvq7Nwk #wxscience
Facebook
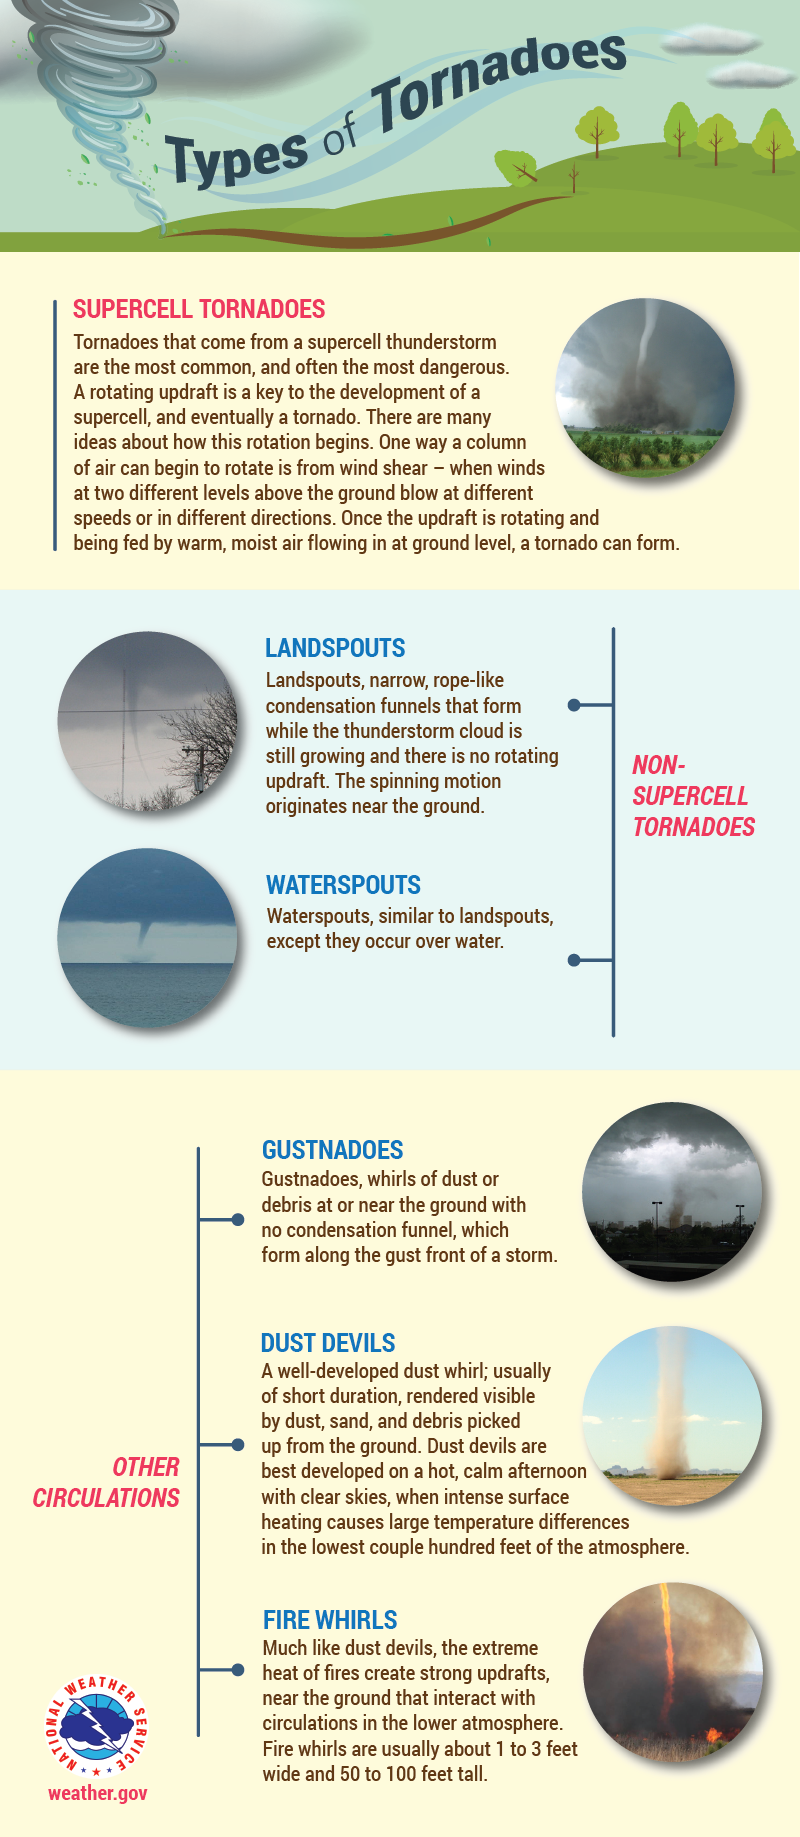
Supercells are not the only types of storms that develop tornadoes. Did you know that there are multiple types of tornadoes that can form? Learn all about them in the infographic below, and visit weather.gov/jetstream/tornado for more #TornadoScience
Twitter
Did you know that they are multiple types of tornadoes? Visit weather.gov/jetstream/tornado for more #TornadoScience
|
Facebook
The term 500-year flood doesn’t necessarily mean that it’s only going to happen one time every 500 years. Rather, it’s a reference to the probability of occurrence. youtu.be/eQFyaXDH42U #FloodScience
Twitter
The term 500-year flood doesn’t necessarily mean that it’s only going to happen one time every 500 years. Rather, it’s a reference to the probability of occurrence. youtu.be/eQFyaXDH42U #FloodScience
Facebook
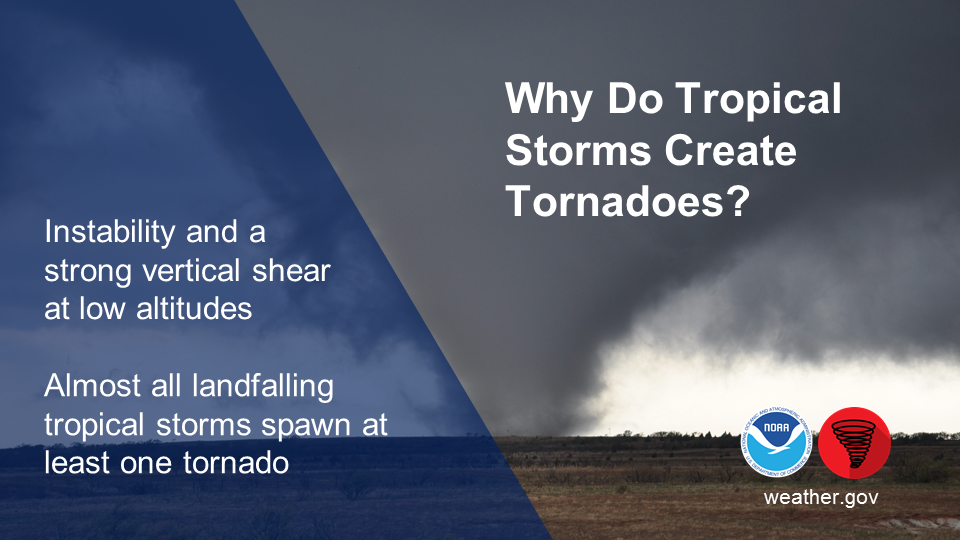
Tropical cyclones spawn tornadoes when certain instability and vertical shear criteria are met, in a manner similar to other tornado-producing systems. Almost all landfalling tropical cyclones spawn at least one tornado. Read more, and other facts about hurricanes and tornadoes, at prh.noaa.gov/cphc/pages/FAQ/Hurricanes_vs_tornadoes.php #TornadoScience
Twitter
Tropical cyclones spawn tornadoes when certain instability and vertical shear criteria are met, in a manner similar to other tornado-producing systems. Read more at prh.noaa.gov/cphc/pages/FAQ/Hurricanes_vs_tornadoes.php #TornadoScience
|
Facebook
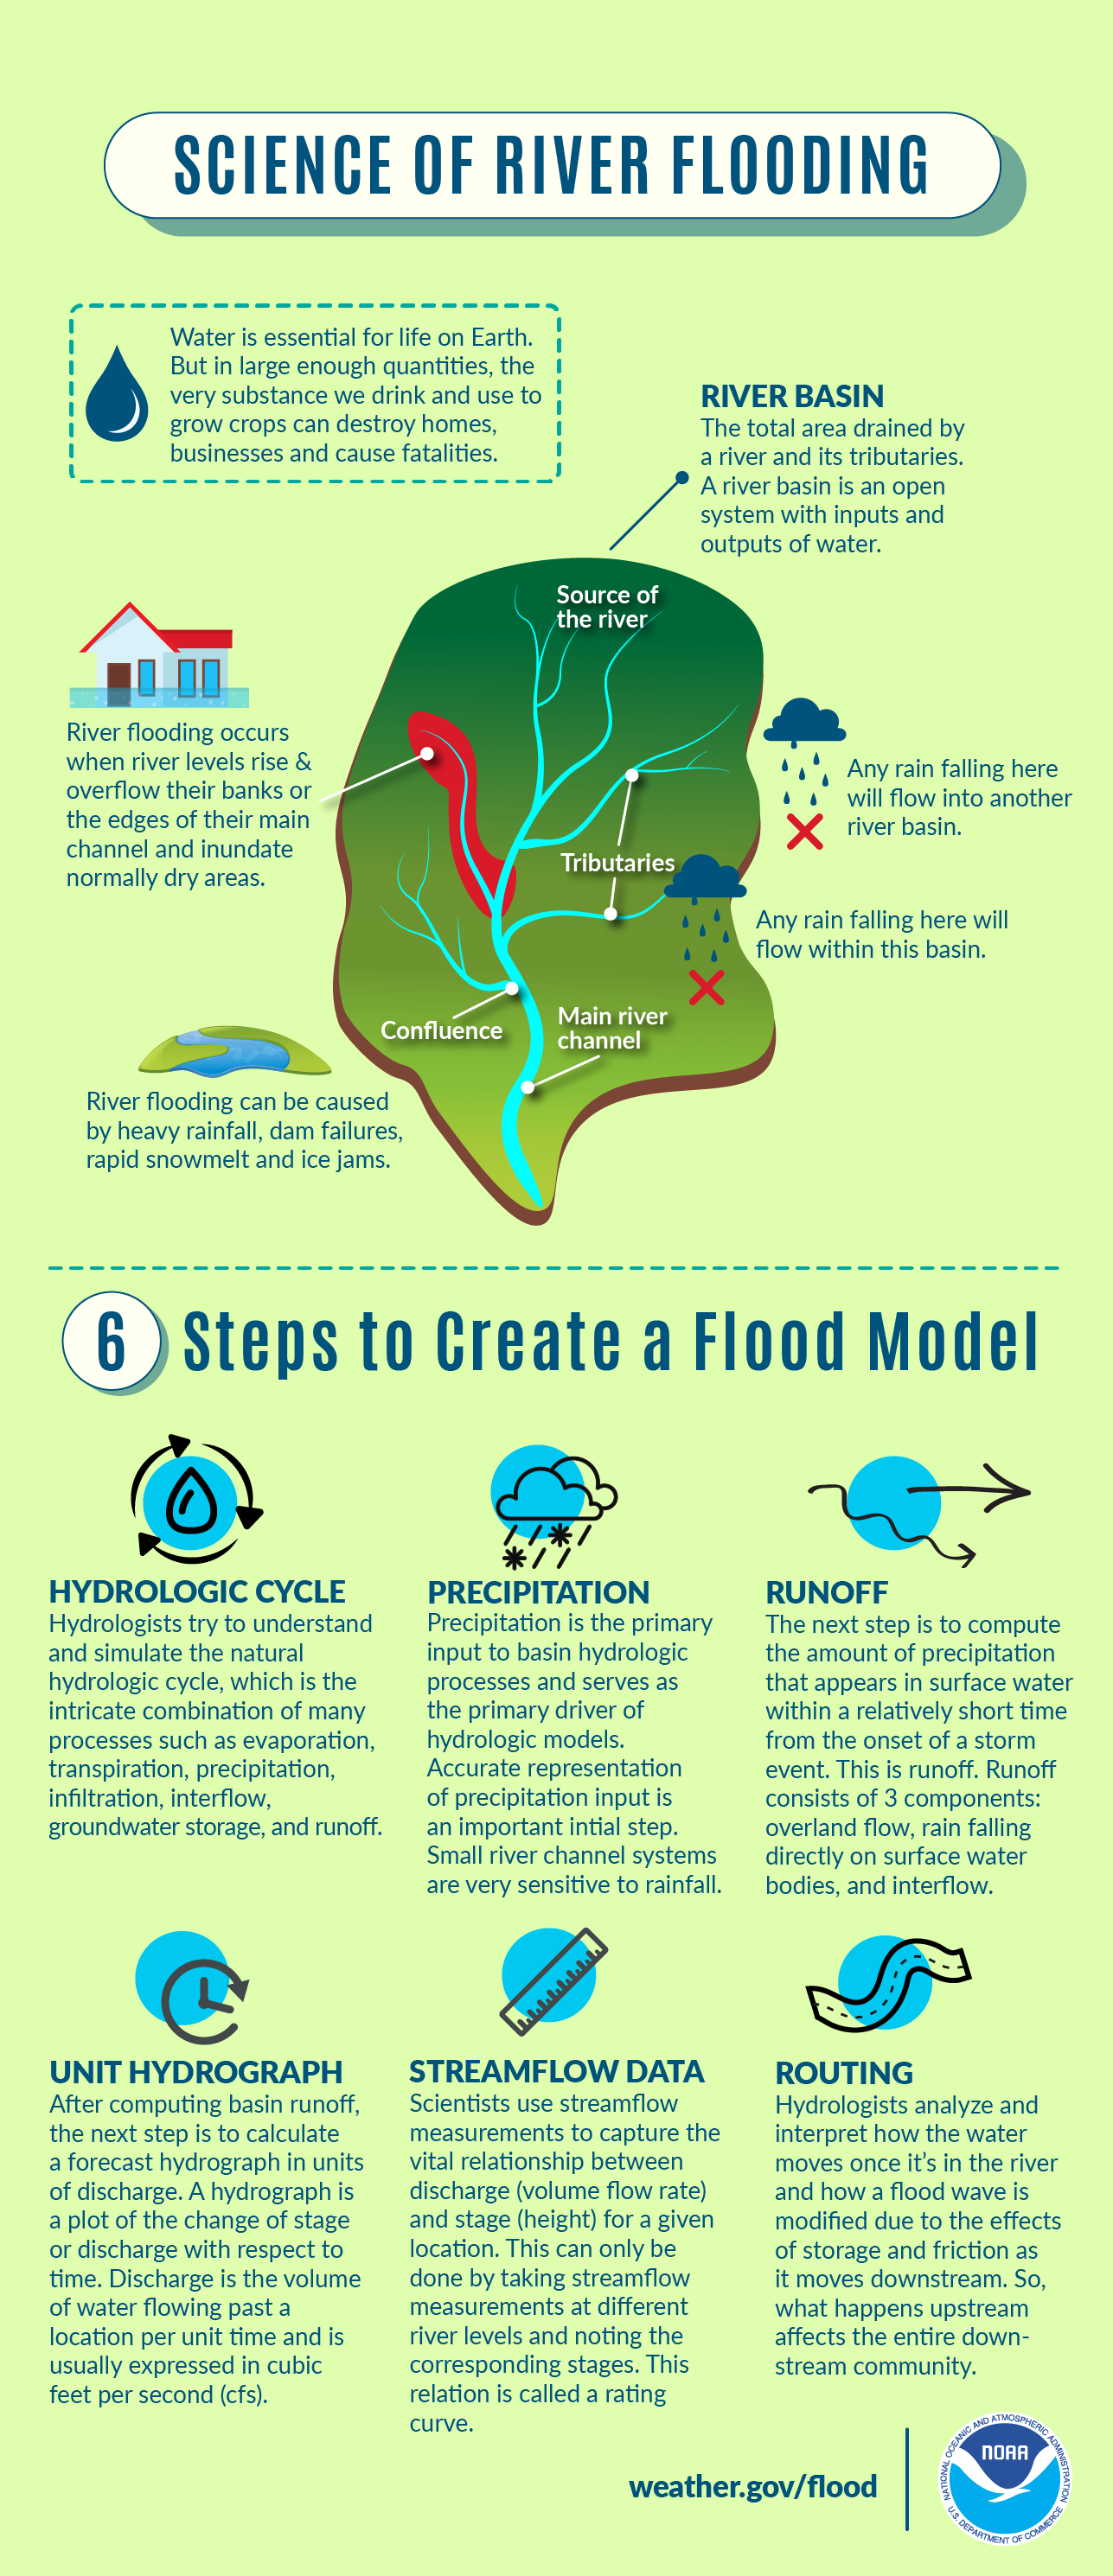
Water is essential for life on Earth. But in large enough quantities, the very substance we drink and use to grow crops can destroy homes, businesses, and cause fatalities. Learn all about the science of river flooding in the infographic below, and visit weather.gov/safety/flood for flood safety tips. #FloodScience
Twitter
Learn all about the science of river flooding with this graphic, and visit weather.gov/safety/flood for flood safety tips. #FloodScience
|
Facebook
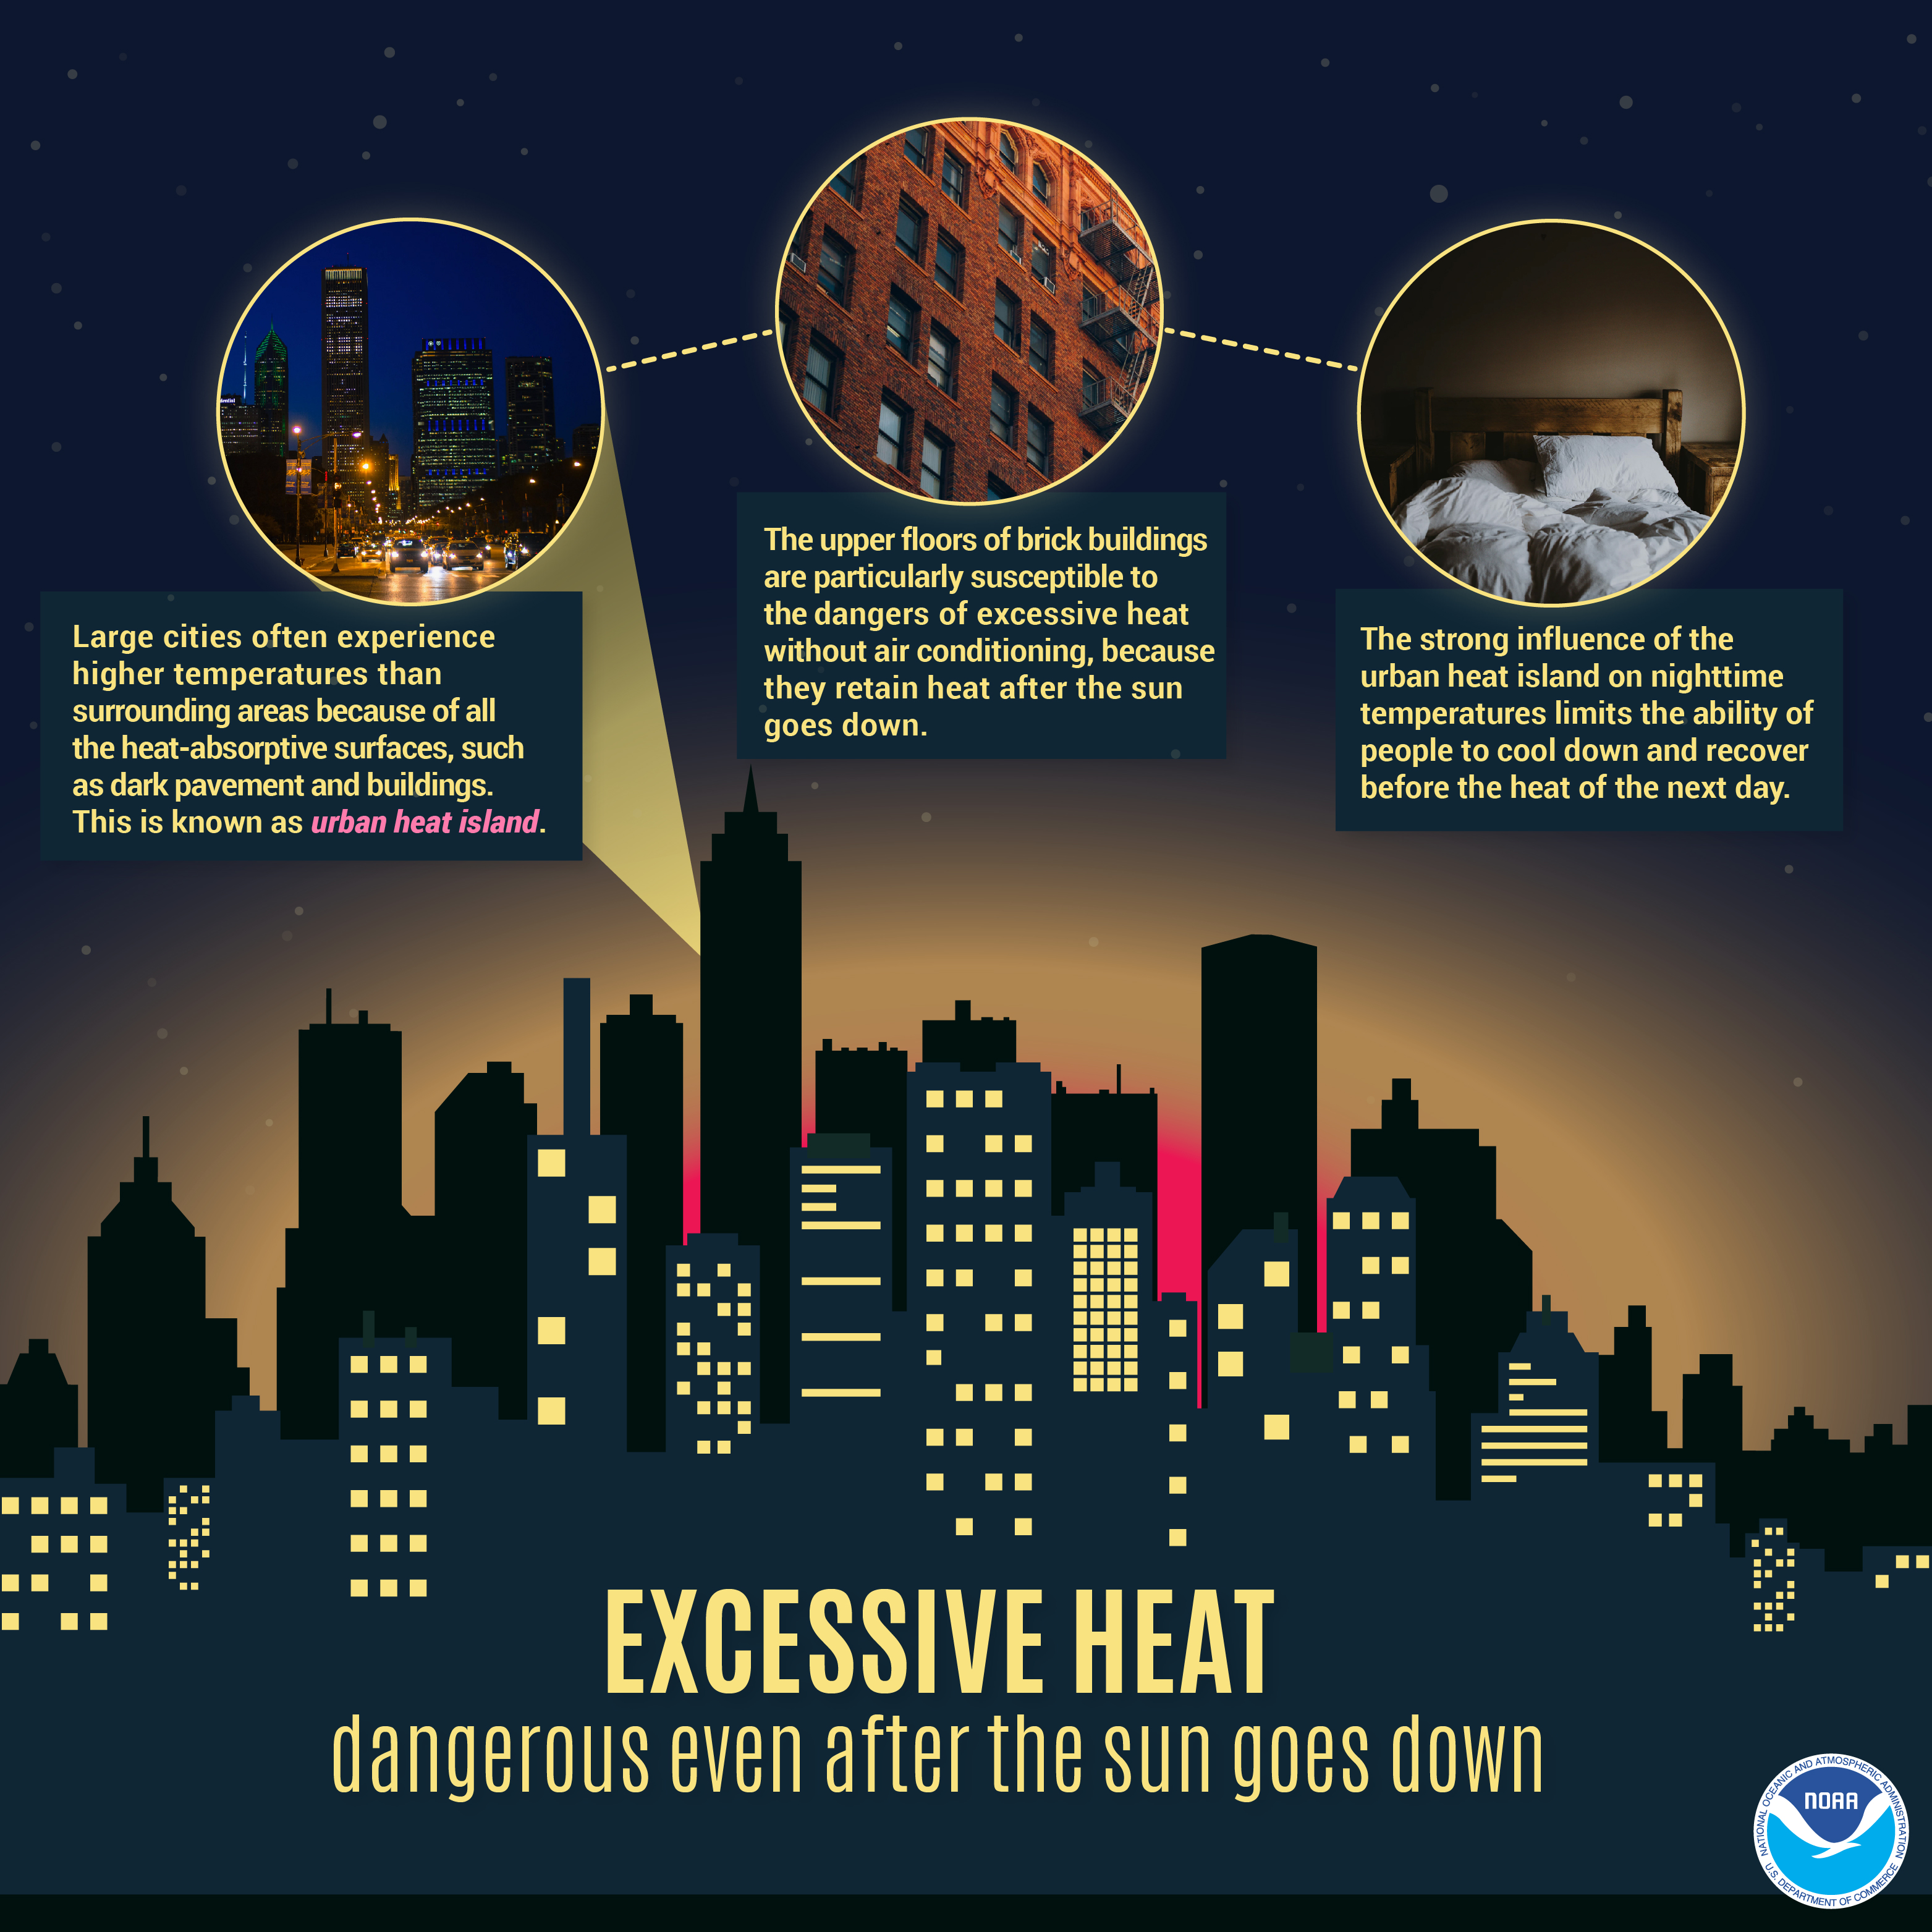
Did you know that large cities are often hotter than the surrounding areas? Called an “urban heat island”, this is because of the heat-absorptive surfaces, such as dark pavement and buildings. weather.gov/heat
Twitter
Did you know that large cities are often hotter than the surrounding areas? Called an “urban heat island”, this is because of the heat-absorptive surfaces, such as dark pavement and buildings. weather.gov/heat
|
Facebook
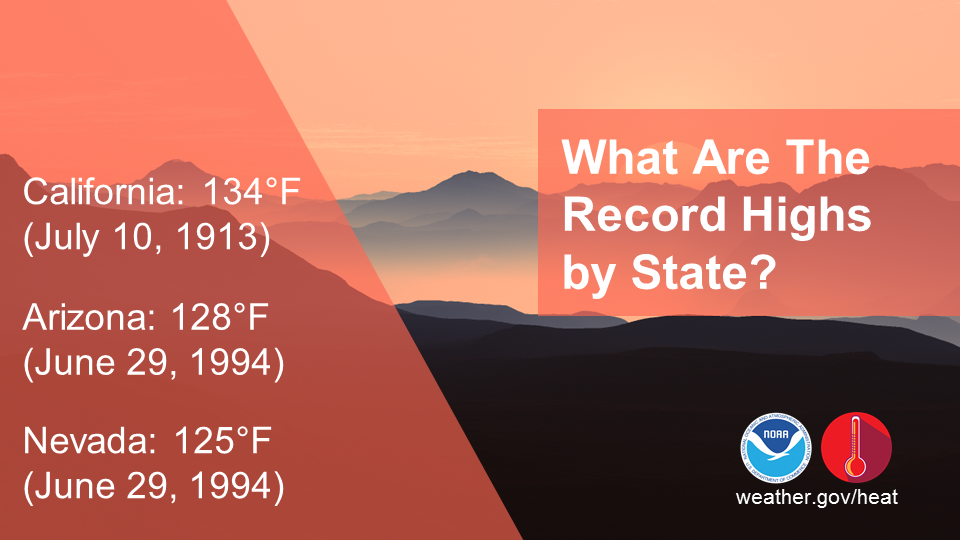
Do you know your state’s hottest recorded temperature? In California, that was 134°F on July 10, 1913 in Death Valley. In fact, that is the hottest air temperature ever recorded on Earth. The next two highest U.S. recorded temperatures both came on June 9, 1994 in Arizona (128°F) and Nevada (125°F). To view your state’s highest temperature (along with other extreme weather records), visit ncdc.noaa.gov/extremes/scec/records
Twitter
Do you know your state’s hottest recorded temperature? In California, that was 134°F on July 10, 1913 in Death Valley. To view your state’s highest temperature (along with other extreme weather records), visit ncdc.noaa.gov/extremes/scec/records
|
Facebook
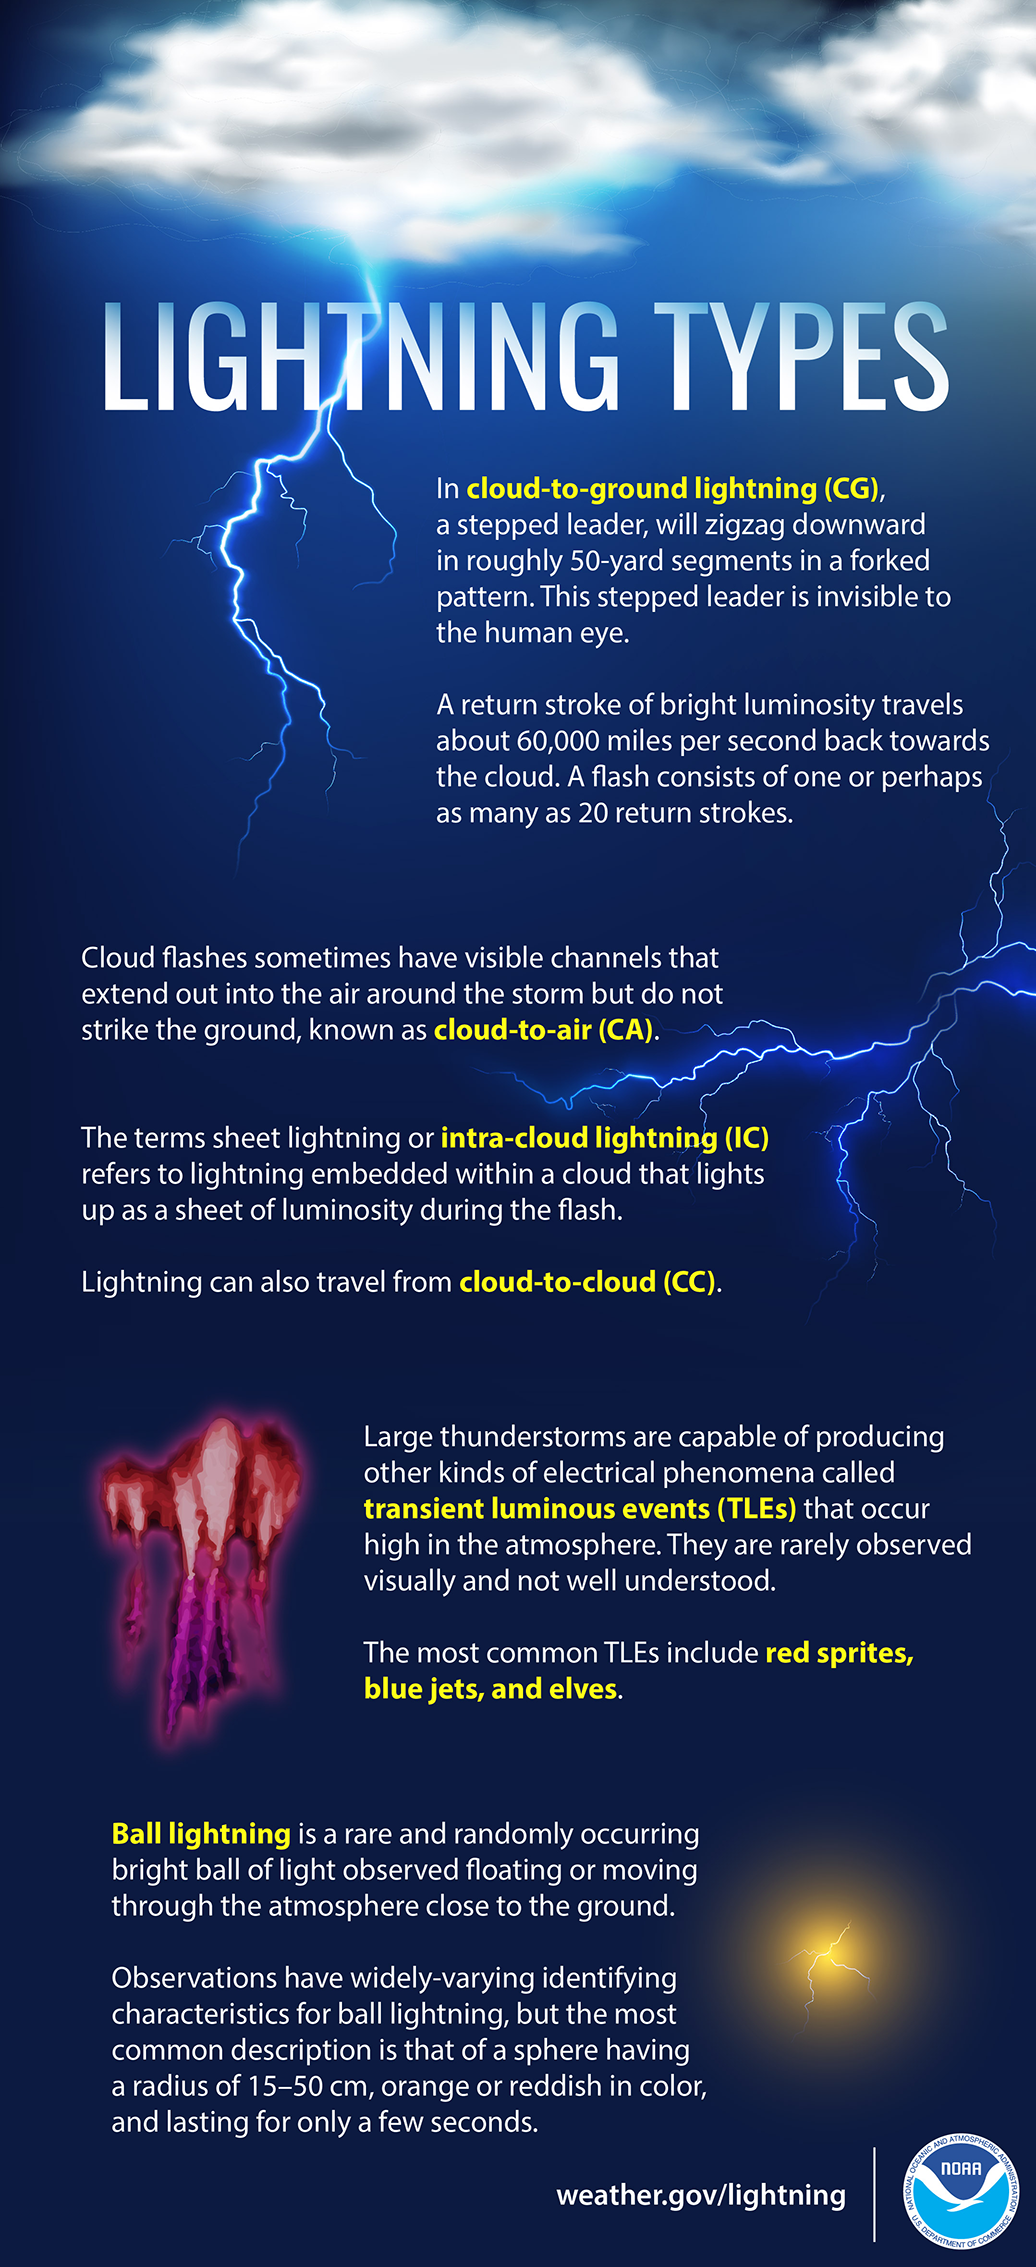
Did you know there any many different kinds of lightning? Learn all about them in the graphic below or by visiting nssl.noaa.gov/education/svrwx101/lightning/types/ #LightningScience
Twitter
Did you know there any many different kinds of lightning? Learn all about them in the graphic below or by visiting nssl.noaa.gov/education/svrwx101/lightning/types/ #LightningScience
|
Facebook
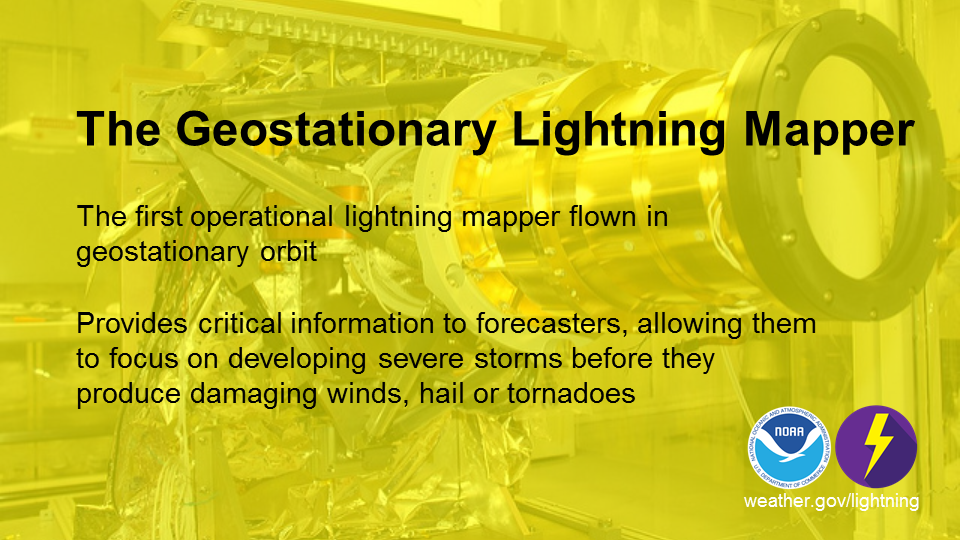
Did you know that GOES-16 (a satellite that orbits the Earth) houses the very first operational lightning mapper flown in geostationary orbit? GLM measures total lightning (in-cloud, cloud-to-cloud and cloud-to-ground) activity continuously over the Americas and adjacent ocean regions with near-uniform spatial resolution of approximately 10 km. #GLM goes-r.gov/spacesegment/glm.html
Twitter
GOES-16 houses the first operational lightning mapper flown in geostationary orbit. #GLM goes-r.gov/spacesegment/glm.html
|
Facebook
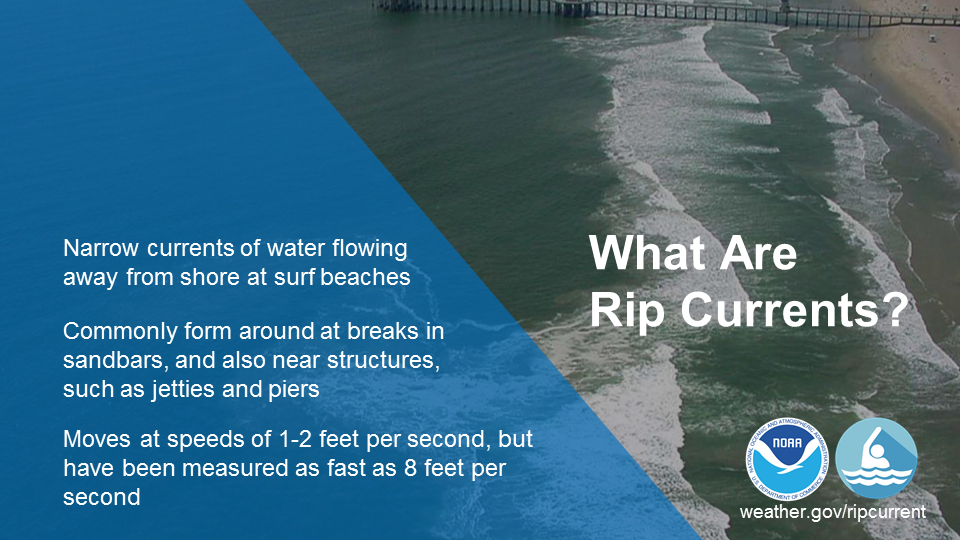
Rip currents are channelized currents of water flowing away from shore at surf beaches. Moving at speeds of up to eight feet per second, rip currents can move faster than an Olympic swimmer. oceantoday.noaa.gov/ripcurrentscience/welcome.html #RipCurrentScience
Twitter
Rip currents are channelized currents of water flowing away from shore at surf beaches, and can reach speeds of 8 feet per second! oceantoday.noaa.gov/ripcurrentscience/welcome.html #RipCurrentScience
|
Facebook
Did you know there are different types of thunderstorms? Watch this video and learn what they are: youtu.be/NNrb0hI5JD4 #ThunderstormScience
Twitter
Did you know there are different types of thunderstorms? Watch this video and learn what they are: youtu.be/NNrb0hI5JD4 #ThunderstormScience
Facebook
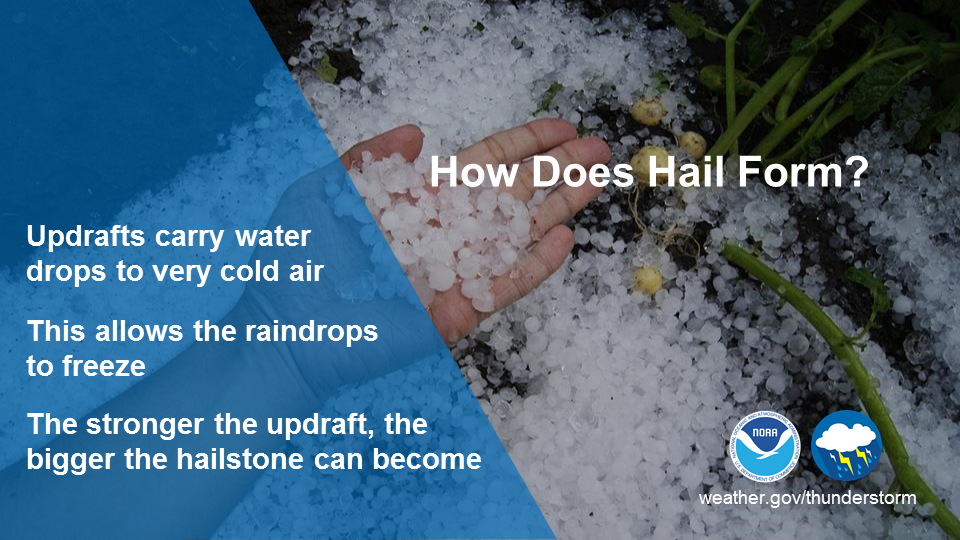
Hail forms when updrafts (or rising air) in thunderstorms carry raindrops upward into extremely cold areas of the atmosphere, allowing the raindrops to freeze. The stronger the updraft, the bigger the hailstone can become before falling out of the storm (typically when the hailstone becomes too heavy for the updraft). Some of the largest hailstones ever recorded are the size of softballs! weather.gov/jetstream/hail #ThunderstormScience
Twitter
Hail forms when thunderstorm updrafts (or rising air) carry raindrops upward into extremely cold areas of the atmosphere. weather.gov/jetstream/hail #ThunderstormScience
|
Facebook
Do you know what to watch for when severe weather threatens? Check out NWS Skywarn. Help keep your community safe by volunteering to become a trained storm spotter for NOAA's National Weather Service. Potential volunteers should visit nws.noaa.gov/skywarn/ and contact their local NWS office. #CitizenScience
Twitter
Let’s learn about #NWSCitizenScience opportunities! Become a trained Skywarn storm spotter and help keep your community safe! nws.noaa.gov/skywarn/ #CitizenScience
|
Facebook
Ever wanted to take rain or snow measurements? Join CoCoRaHS or Community Collaborative Rain, Hail, and Snow Network. This volunteer network of observers measure precipitation from their backyard. Any age can volunteer. Data is used by NWS meteorologists to help with forecasts. www.cocorahs.org
Twitter
Ever wanted to take rain or snow measurements? Learn more about #NWSCitizenScience and join CoCoRaHS today! Cocorahs.org #CitizenScience
|
Facebook
Check out mPING (Meteorological Phenomena Identification Near the Ground) project. Weird name, cool app! You can report the type of precipitation you see where you are. No need to measure! Use the free mobile app to send reports anonymously. Reports are automatically recorded into a database, which improves weather computer models. The information is even used by road maintenance operations and the aviation industry to diagnose areas of icing. mping.nssl.noaa.gov #CitizenScience
Twitter
Check out mPING! Weird name, cool app for #CitizenScience! Report weather types via the mPing app and help improve weather model forecasts! mping.nssl.noaa.gov #NWSCitizenScience
|
Facebook
The NWS Cooperative Observer Program (COOP) is truly the Nation's weather and climate observing network of, by and for the people. With over 8,700 volunteer observers, this program has existed since 1890 and is one of the few programs that measures snowfall and its water equivalent. Help #NWSCitizenScience and become a COOP! You can help support warnings, forecasts, and build a climatological database! For more information, visit weather.gov/coop/Overview
Twitter
Join NWS COOP! The NWS Cooperative Observer Program (COOP) is truly the Nation's weather and climate observing network of, by and for the people. Help support warnings, forecasts & build a climatological database! weather.gov/coop/Overview #NWSCitizenScience
|

